Wer regelmäßig Bitcoin kauft, sollte dies weiterhin tun. Es gibt keine Anzeichen, dass Bitcoin seinen Aufwärtstrend verlassen hat. Die Volatilität von Bitcoin und Bewertung von Bitcoin liegt im Rahmen der letzten beiden Zyklen. Wer zuwenig Bitcoin hat, kann gerne jetzt kaufen. Bitcoin ist etwas günstig ggü. Trend bei gleichzeitig guter Stimmung an den Kapitalmärkten. Wer Bitcoin in den nächsten 1-3 Jahren verkaufen möchte, sollte lieber noch warten. Wer mit seinem letzten Notgroschen auf die perfekte Gegenheilt wartet, sollte mit seinem Kauf noch abwarten.
Meine Prognose. Wir bullern uns jetzt langsam wieder leicht nach oben und im Herbst oder nächstes Jahr eskaliert es dann vielleicht nochmal.
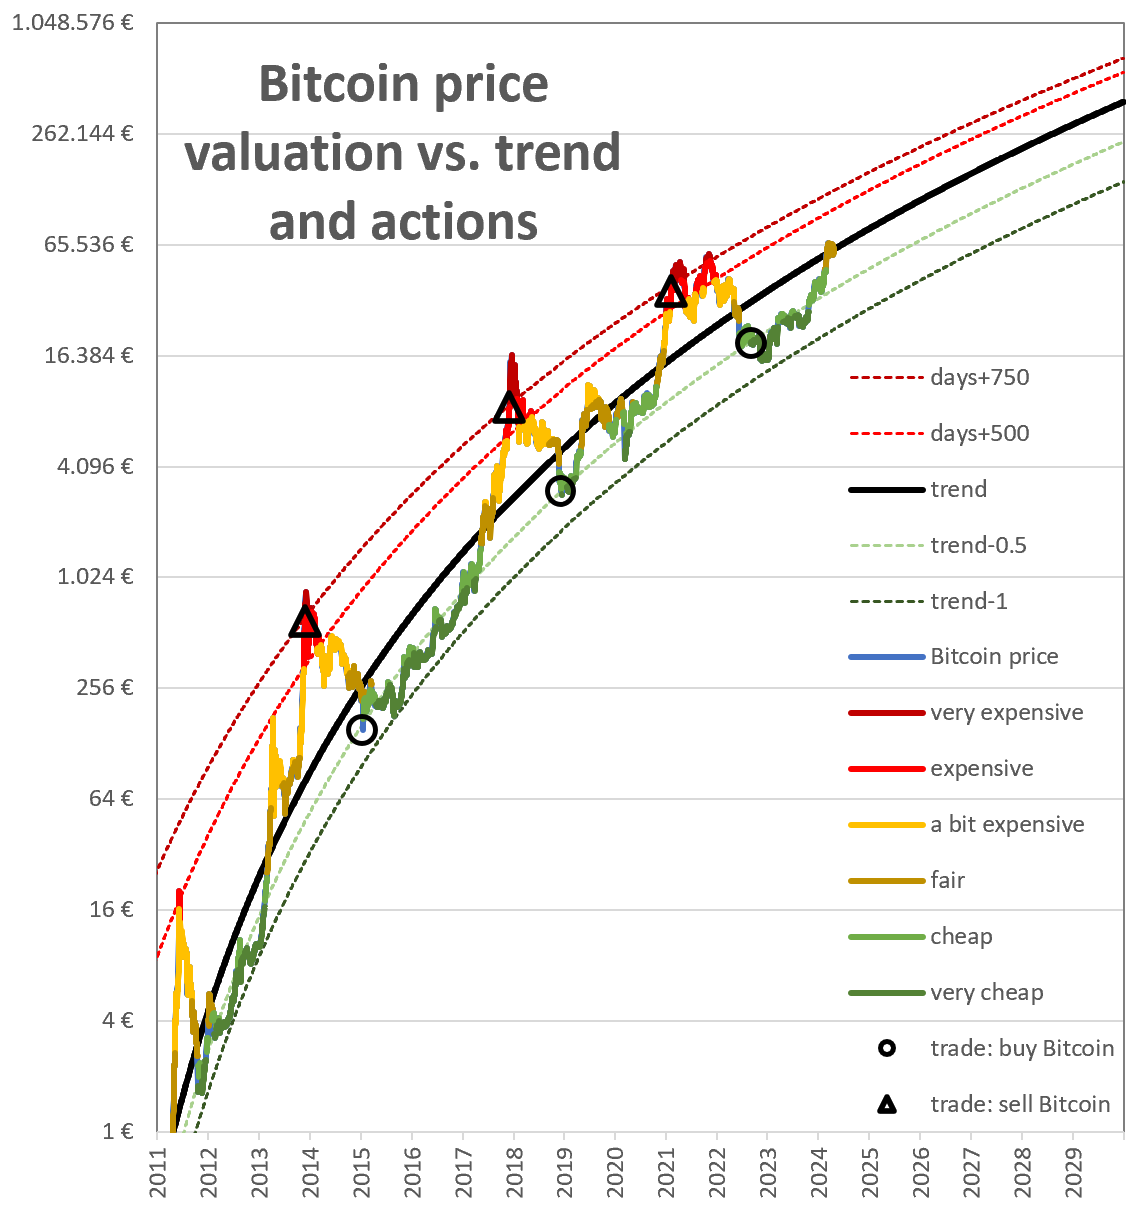
 Entweder haben wir einen kurzen Rücksetzer und dann geht der Bullenmarkt weiter oder wir haben ein Zwischenhoch (gelb markiert). Einen richtigen Bullenmarkt (rot markiert) haben wir in diesem Zyklus noch nicht gesehen, dafür haben wir aber sowieso noch etwas Zeit. Bisherige Übertreibungen nach oben waren stärker ausgeprägt und im größeren Abstand zur vorherigen Übertreibung. Der Bitcoinpreis liegt mittig im Regenbogenchart, Bitcoin sieht aktuell fair bewertete aus: 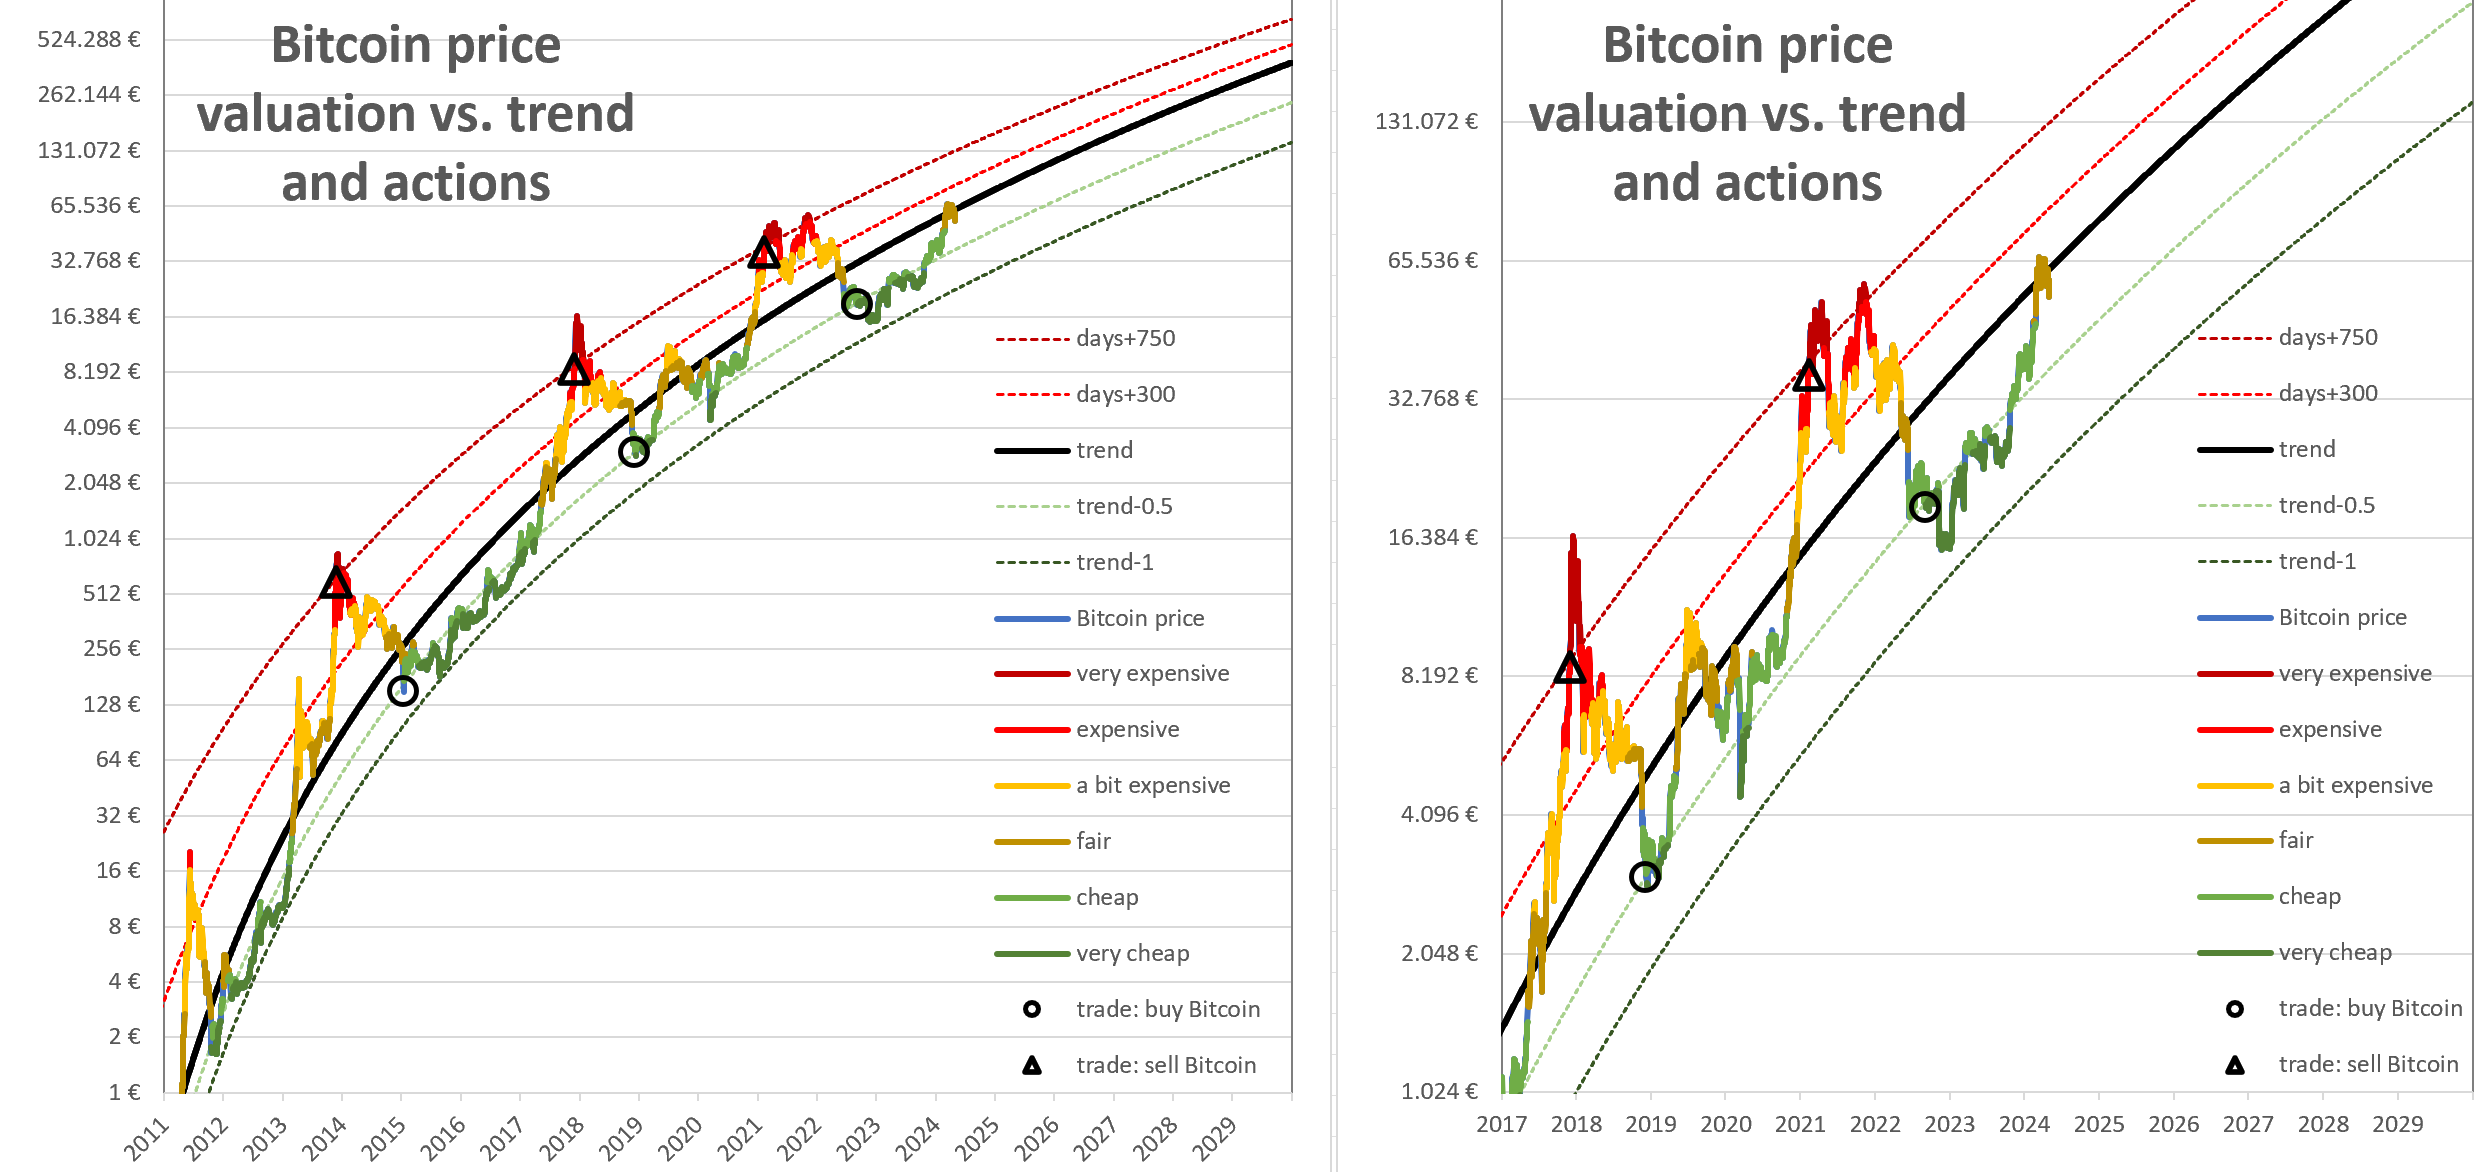  Bewertung und Volatilität von Bitcoin ggü. dem S&P Aktienindex liegt im Rahmen der vergangenen beiden Bärenmärkte.  Die Stimmung an den Kapitalmärkten ist weiter gut. Die Volatilität des S&P ist unterdurchschnittlich. Dies unterstützt den Bitcoinpreis. 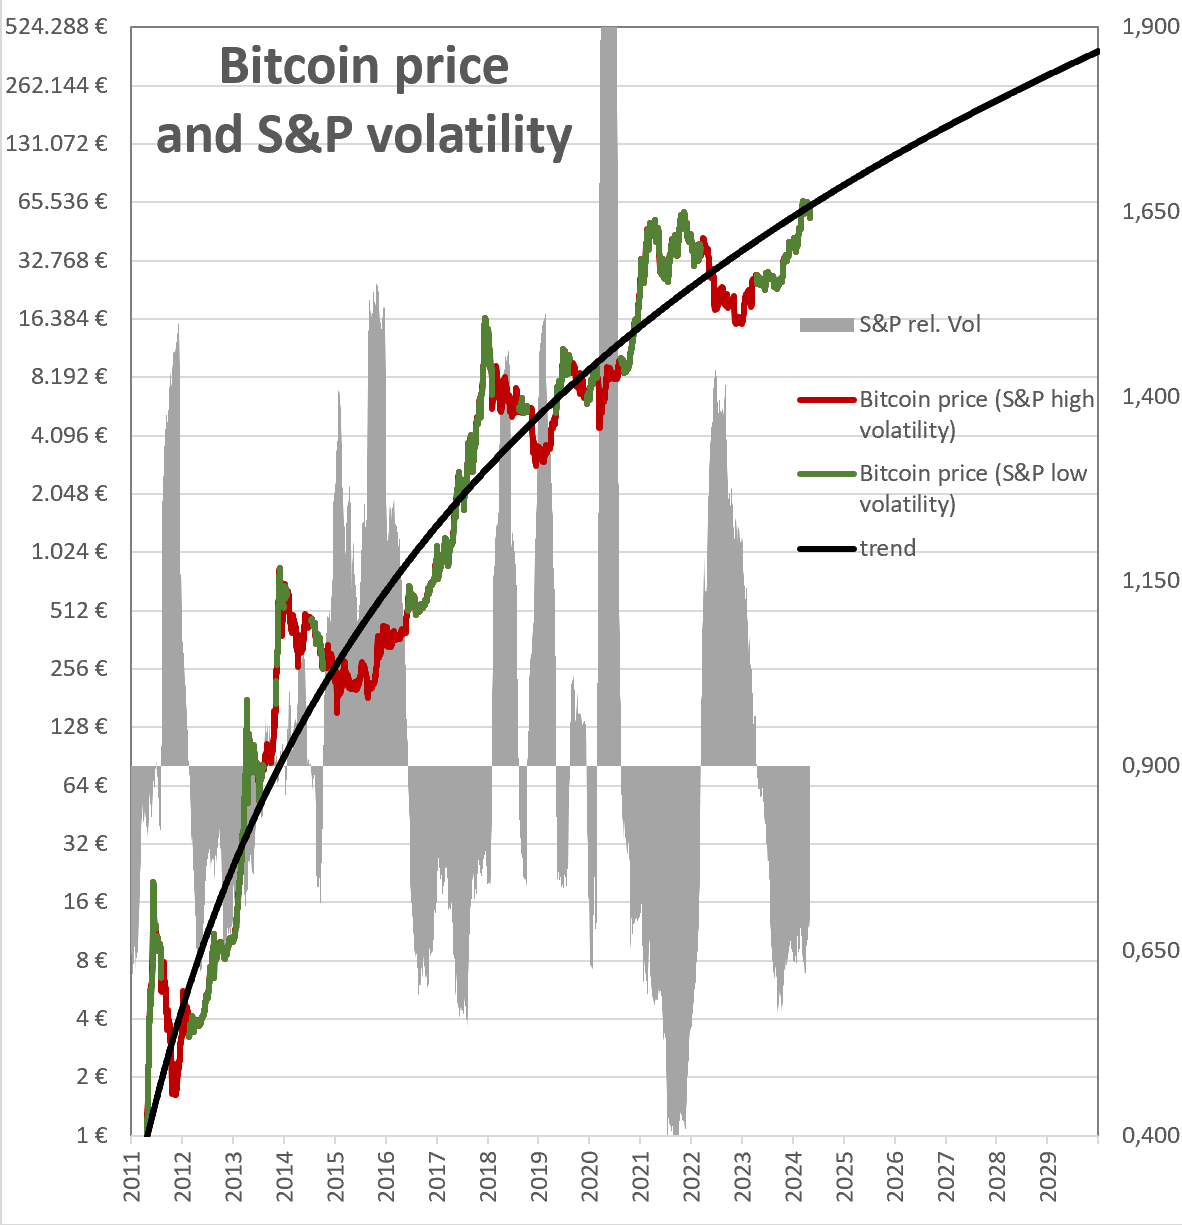
Fazit:Perfekt wäre ein sehr günstiger Bitcoin (e^⁻0,5 bis e^-0,9) mit einer niedrigen Volatilität (unter S&P-Index * 2.5) während der S&P aus einer längeren Zeit überdurchschnittlicher Vola gerade in eine Phase unterdurchschnittlicher Vola eintritt. Die letzte Übertreibung bei Bitcoin ist schon länger her aber das Modell (z.B. 900-1000 Tage) und das Preismodell wurde in diesem Zeitraum nicht gebrochen. Aktuell sind wir in einer guten Situation mit fair bewerteten Bitcoin (e⁻0,14), einer befriedigenden Vola (S&P * 5) und einer schon länger andauernden niedrig-Vola-Phase des S&Ps. Insgesamt kann man Bitcoin aktuell mit gutem Gewissen kaufen.
|
|
|
|
DCA can be used to spread this risk and be sure that you are at least partly invested to profit "somehow".
You are correct. I was conservative with my cut-off points, but a significant change in the Bitcoin price behavior could make me miss the top or the bottom. Therefore I won't trade 100% of my Bitcoin and I will DCA (mainly because of banking restrictions but also to reduce risk).
Adjusting our strategy (sell at trend+750 days, buy at trend*e^-0.5) for bank account limitations.Problem:
Peter has 1 Bitcoin. He feels comfortable trading 0.5 Bitcoin while holding the remaining 0.5 Bitcoin. The optimum strategy would be sell 0.5 Bitcoin at trend+750 days for cash and use this cash to buy back more Bitcoin at trend*e^-0.5. However selling 0.5 Bitcoin at trend+750 days would lead to an cash inflow into his bank account of 65.000 EUR far exceedingd his salary cash inflow of 2k. This will trigger anti money laundering actions from his bank. The bank might file a report to the government, block the cash inflow or require additional information from Peter about the source of the funds. Peter always remained within the law and paid his taxes in full. However he would still like to avoid the hassle of filing a lot of paper works.
He therefore doesn't want his cash inflow from selling Bitcoin to exceed 4k a month (2x his salary). As a result he can't sell his 0.5 Bitcoin for 65.000 EUR at once but would need several months to sell his Bitcoin. However the Bitcoin peak only lasts a short time. So either (i) Peter won't be able to sell his 0.5 Bitcoin in full or (ii) he will have sell his Bitcoin over several months for a lower price above trend or mixture of i and ii.
Solution:
4k a month is 1k a week, which is 3.2% of 0.5 Bitcoin at trend price of 62k. For a 3.2% weekly cash turnover bank account limit the optimal time to start selling is roughly at trend+200 days (currently 76k EUR) and the optimum time to start buying back is at trend*e^-0.3 (currently 46k EUR).
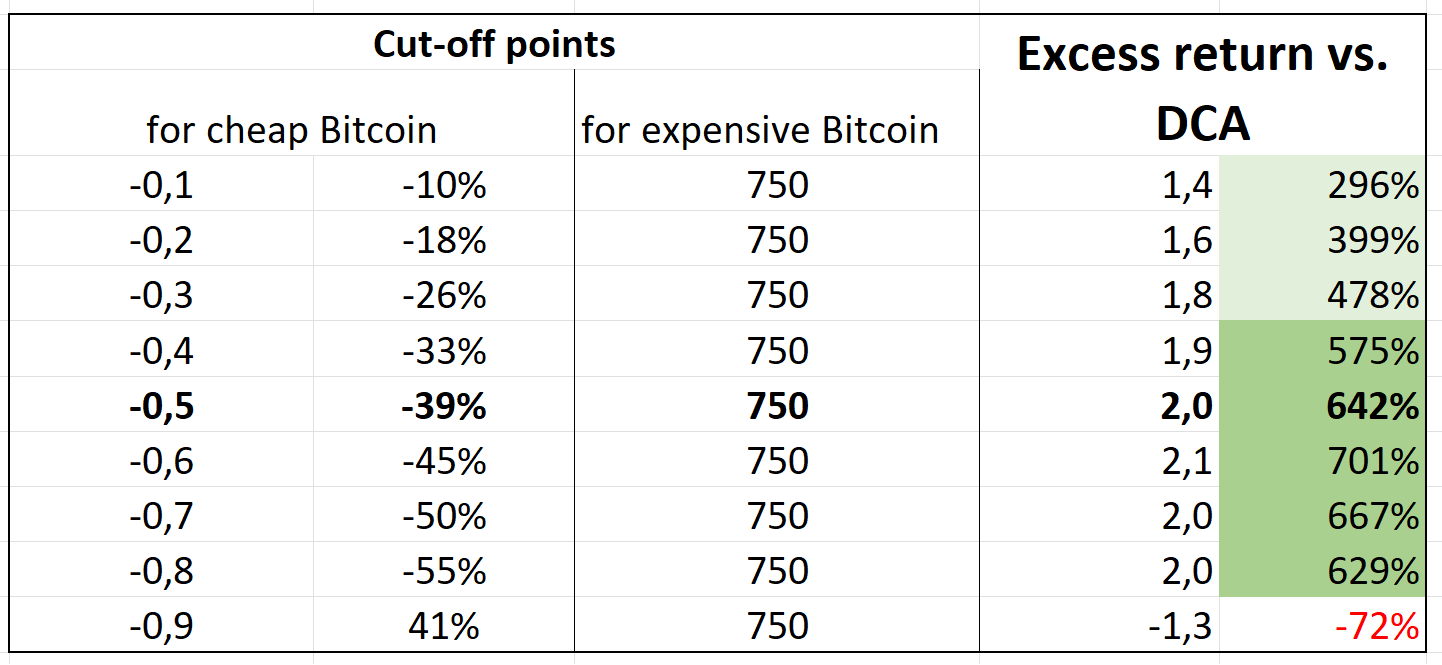
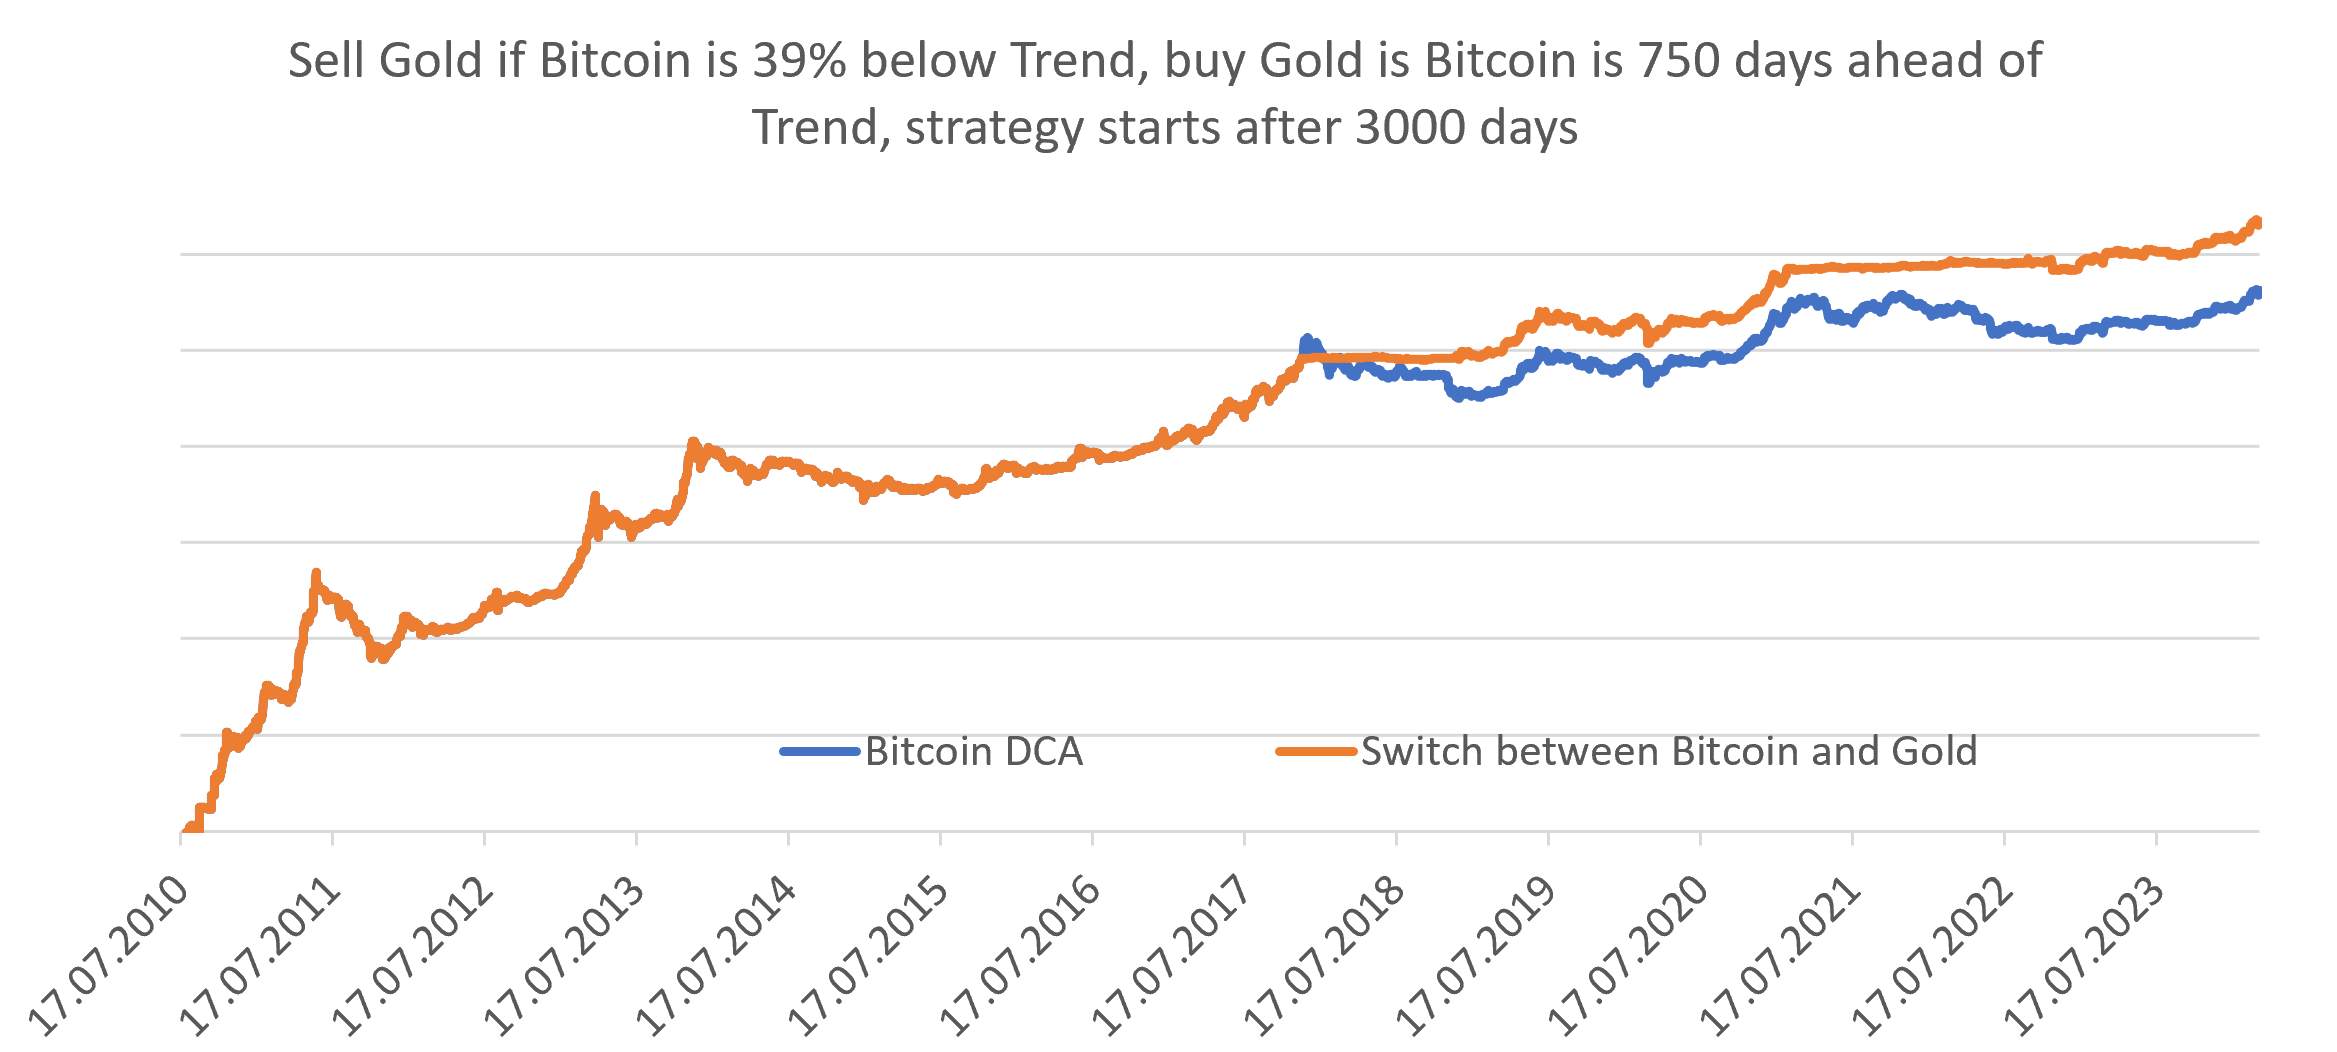
Finding the optimal valuations for buying and selling BitcoinWe have learned that we could outperform buy and hold by buying Bitcoin cheap in the cycle and selling Bitcoin expensive in the cycle. Best time to buy Bitcoin was at trend*e^-0.5. Best time to sell Bitcoin was trend+750 days. How do the two limits (-0.5 and 750) change as a function of how limited our bank account turn over is relative to the value of our Bitcoin we are willing to cycle-trade. We can be sure the limits (-0.5 and 750) will move closer to trend (e.g. -0.3 and +300) especially for severely restricted bank accounts, because we can't buy or sell all Bitcoin at the optimal moment. We have to choose a less optimal moment or not trade at all. BacktestsWe can calculate our out performance for multiple scnearios. For each bank account restriction (buy/sell X% of our tradable Bitcoin per week), we ceck for different buy and sell triggers the outperformance. The goal is to find the combinations of triggers that gives us the optimal outperformance. For the optimal combination (marked in bold) a graphical output of our backtest is shown.  Even if our bank account is severly restrictive (0.1% weekly trading) the optimum limits only go to (-0.25 and +180) 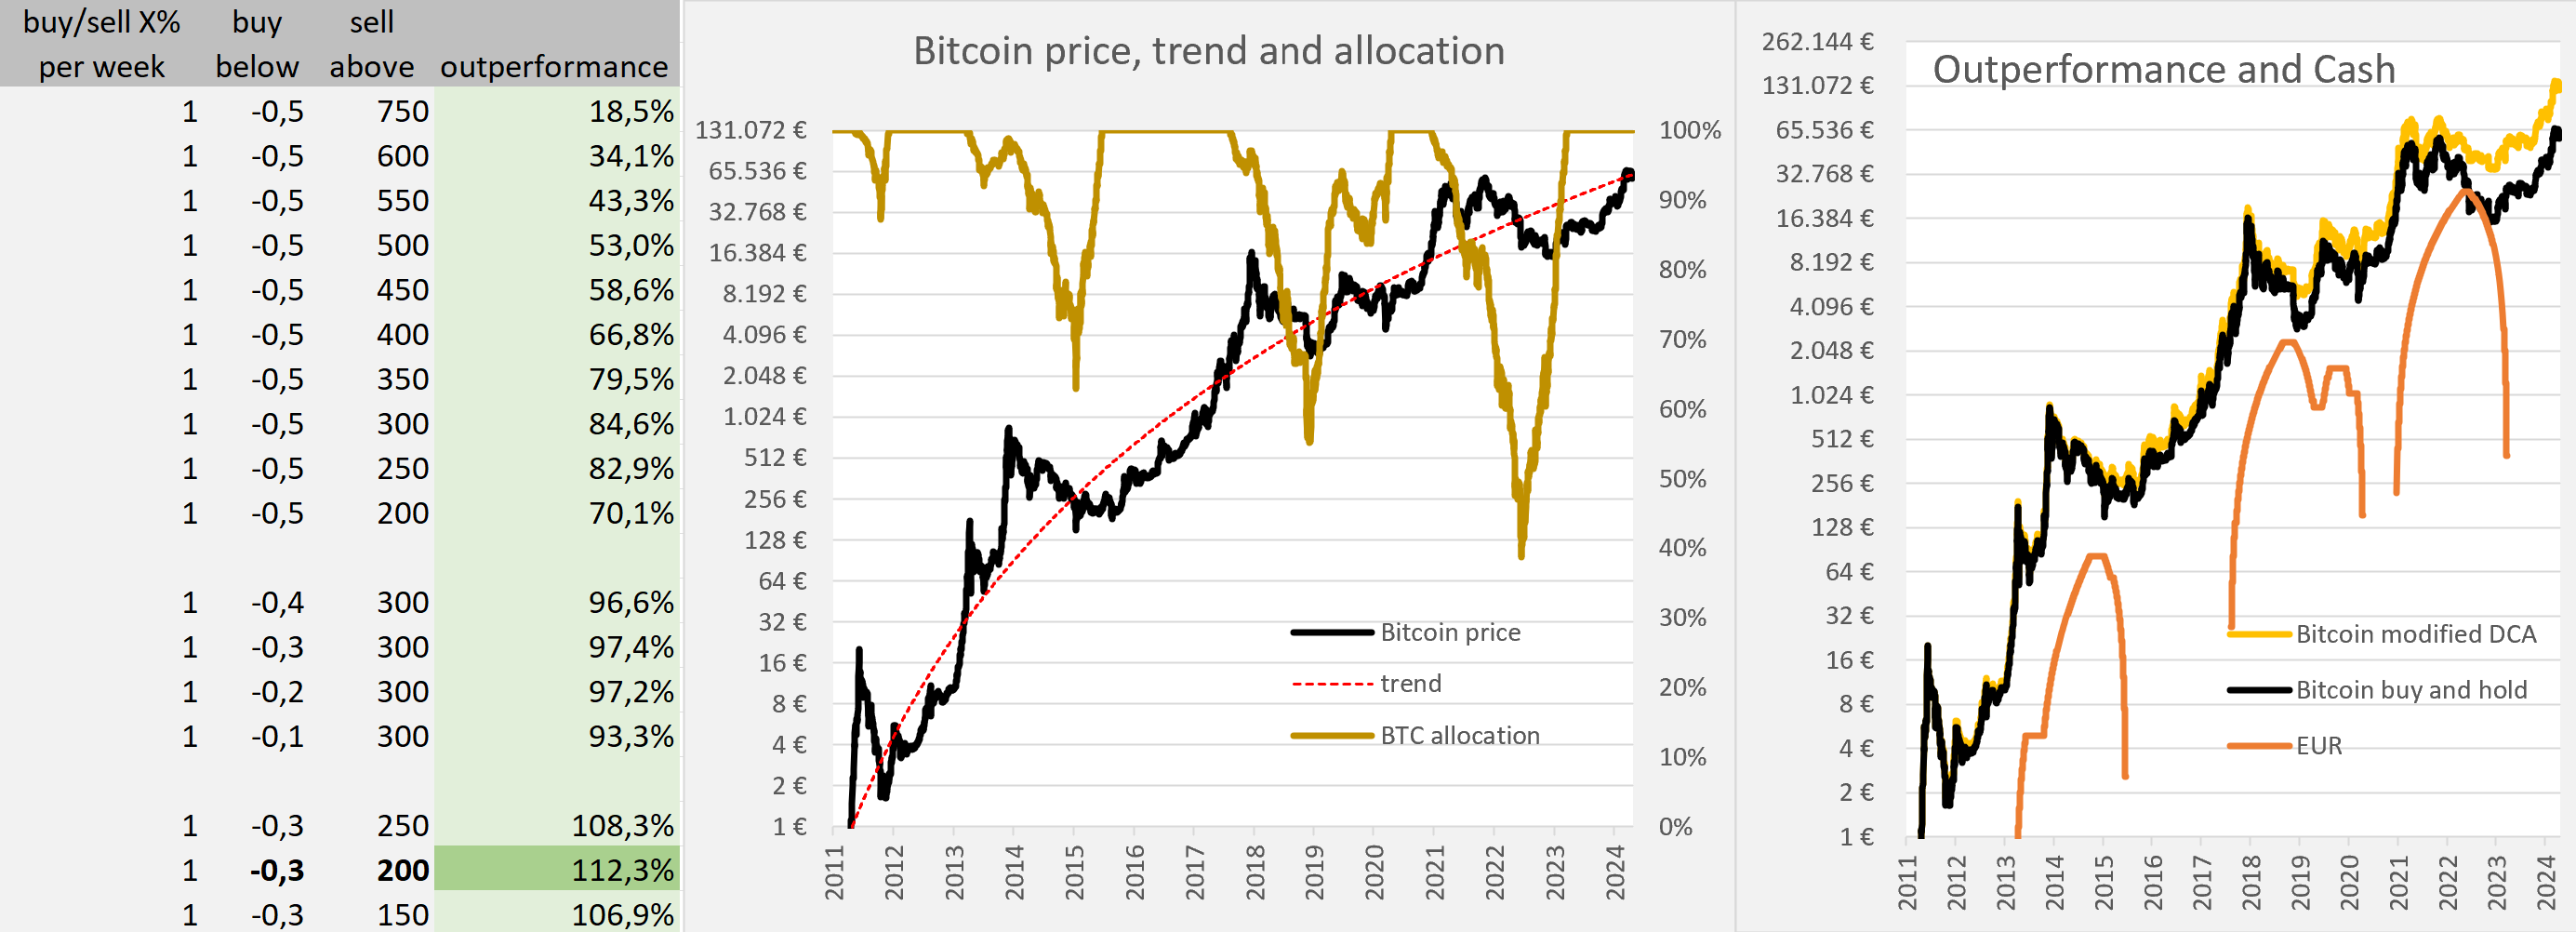 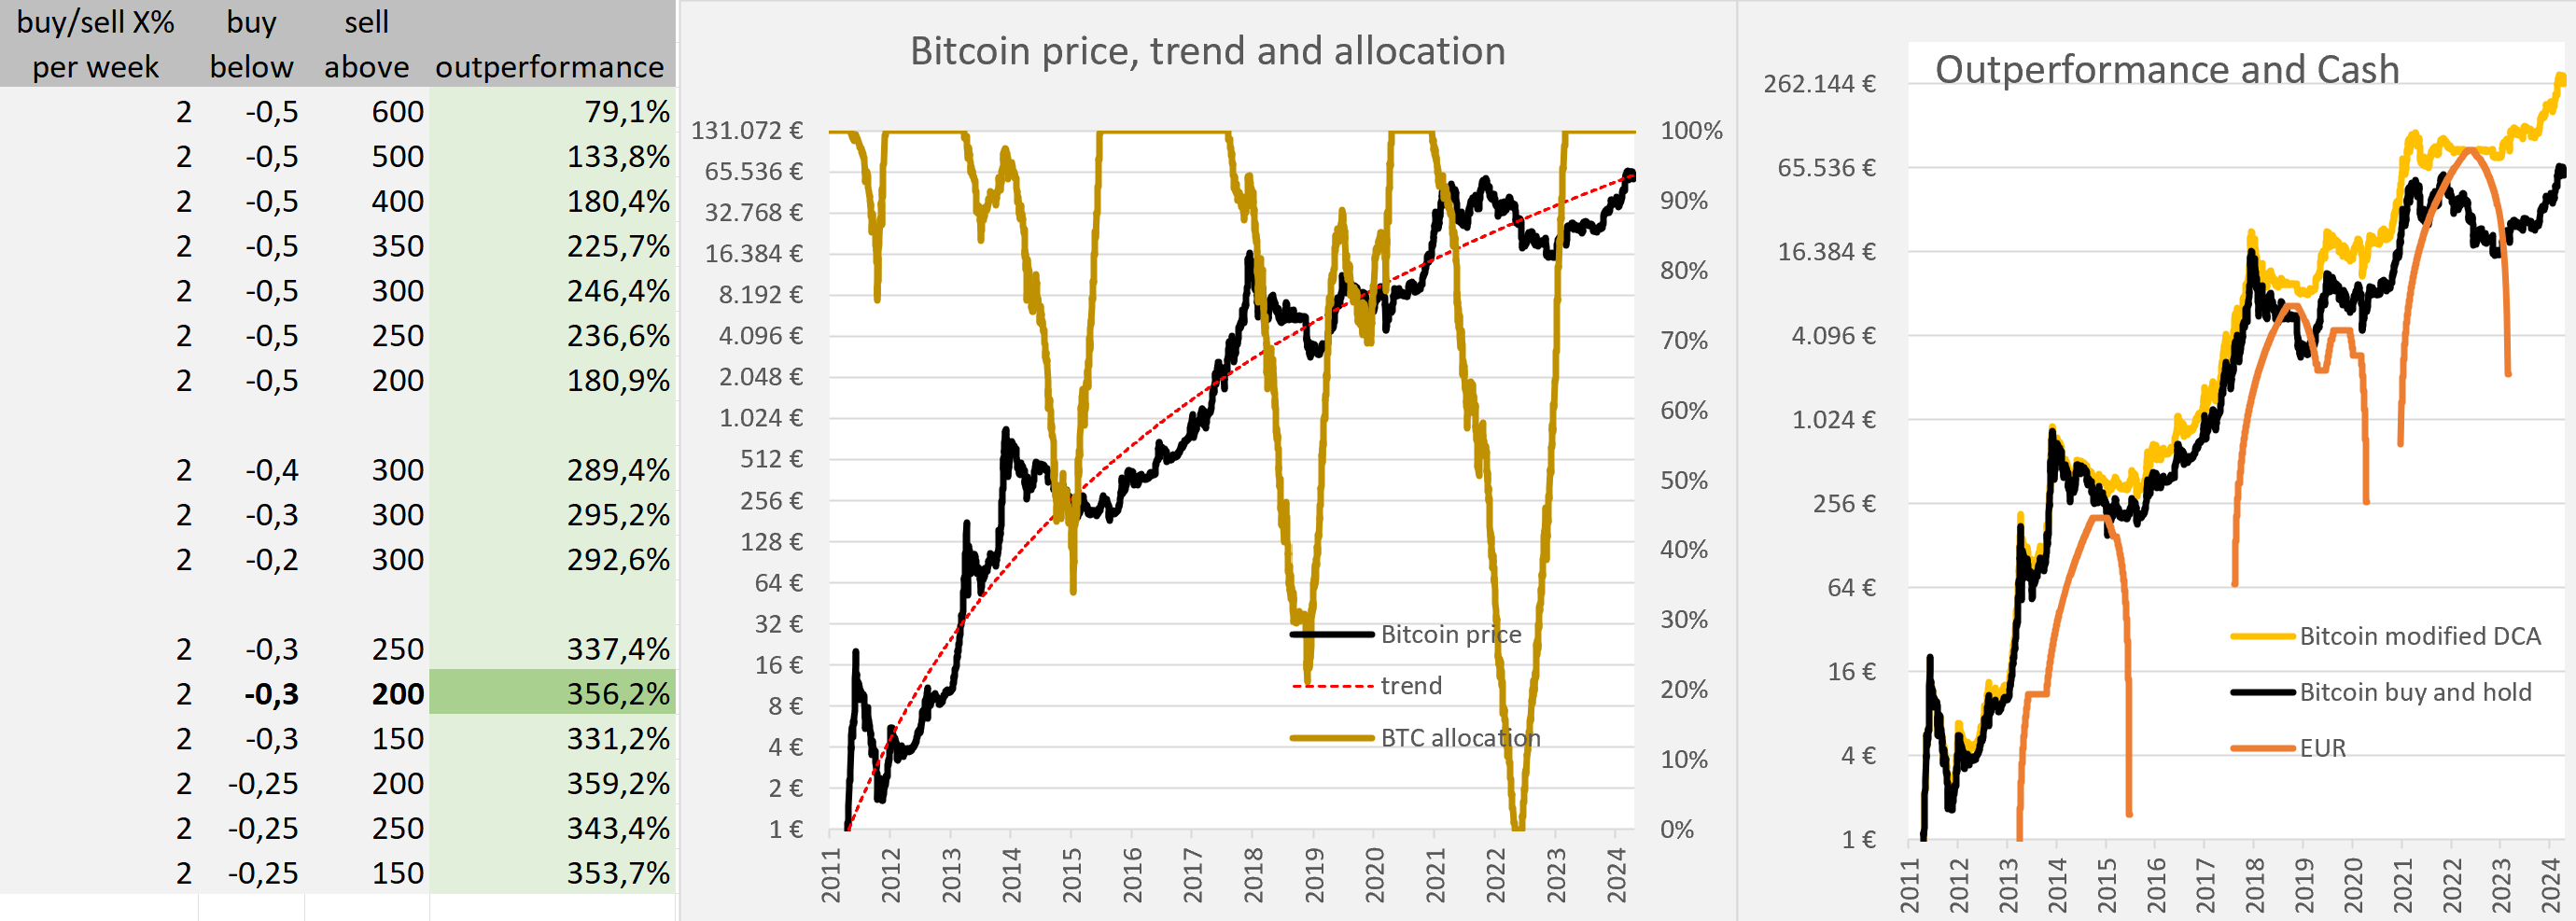 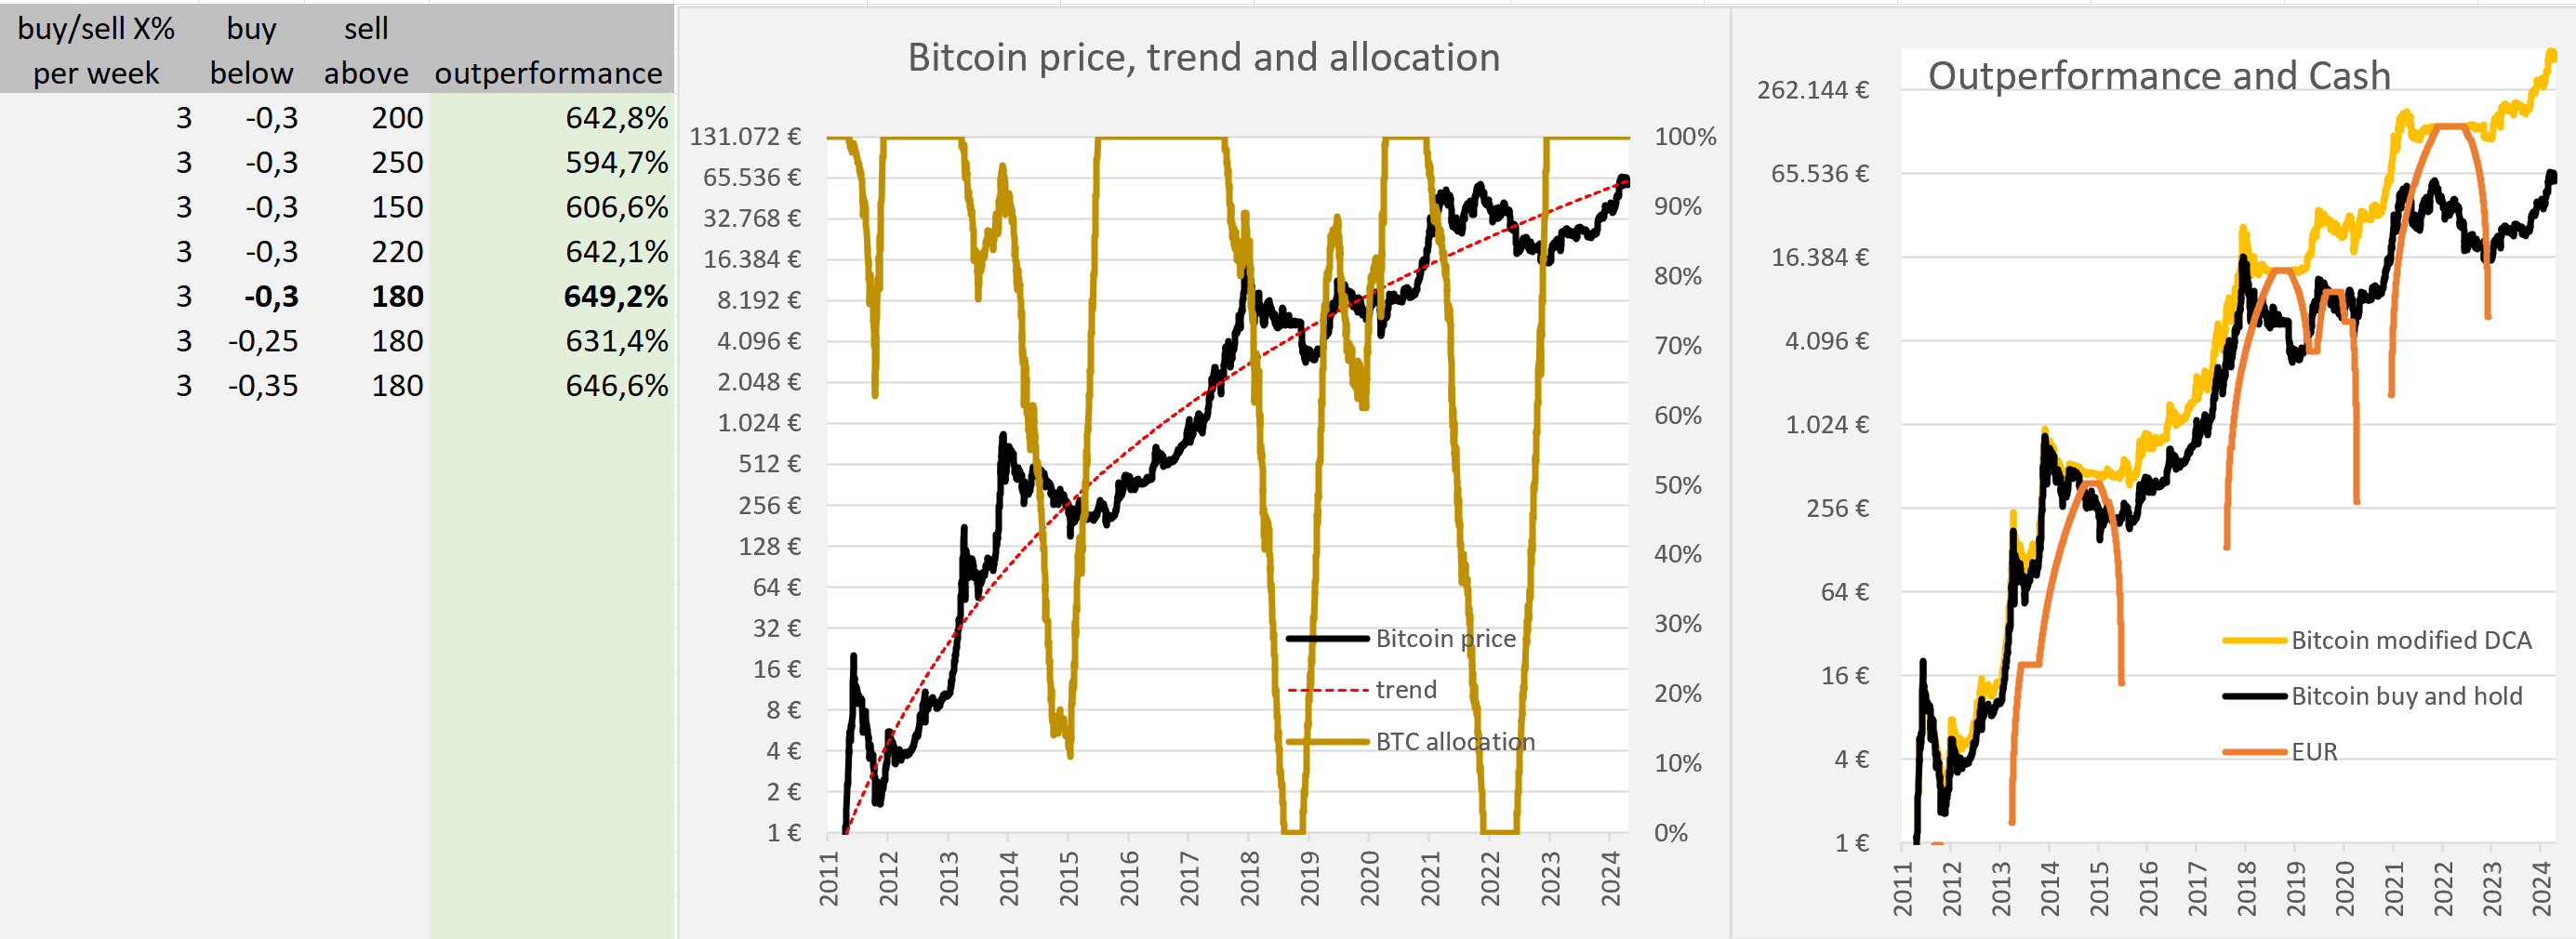 For 1%-3% trading restriction our limits are around (-0.3 and +200).  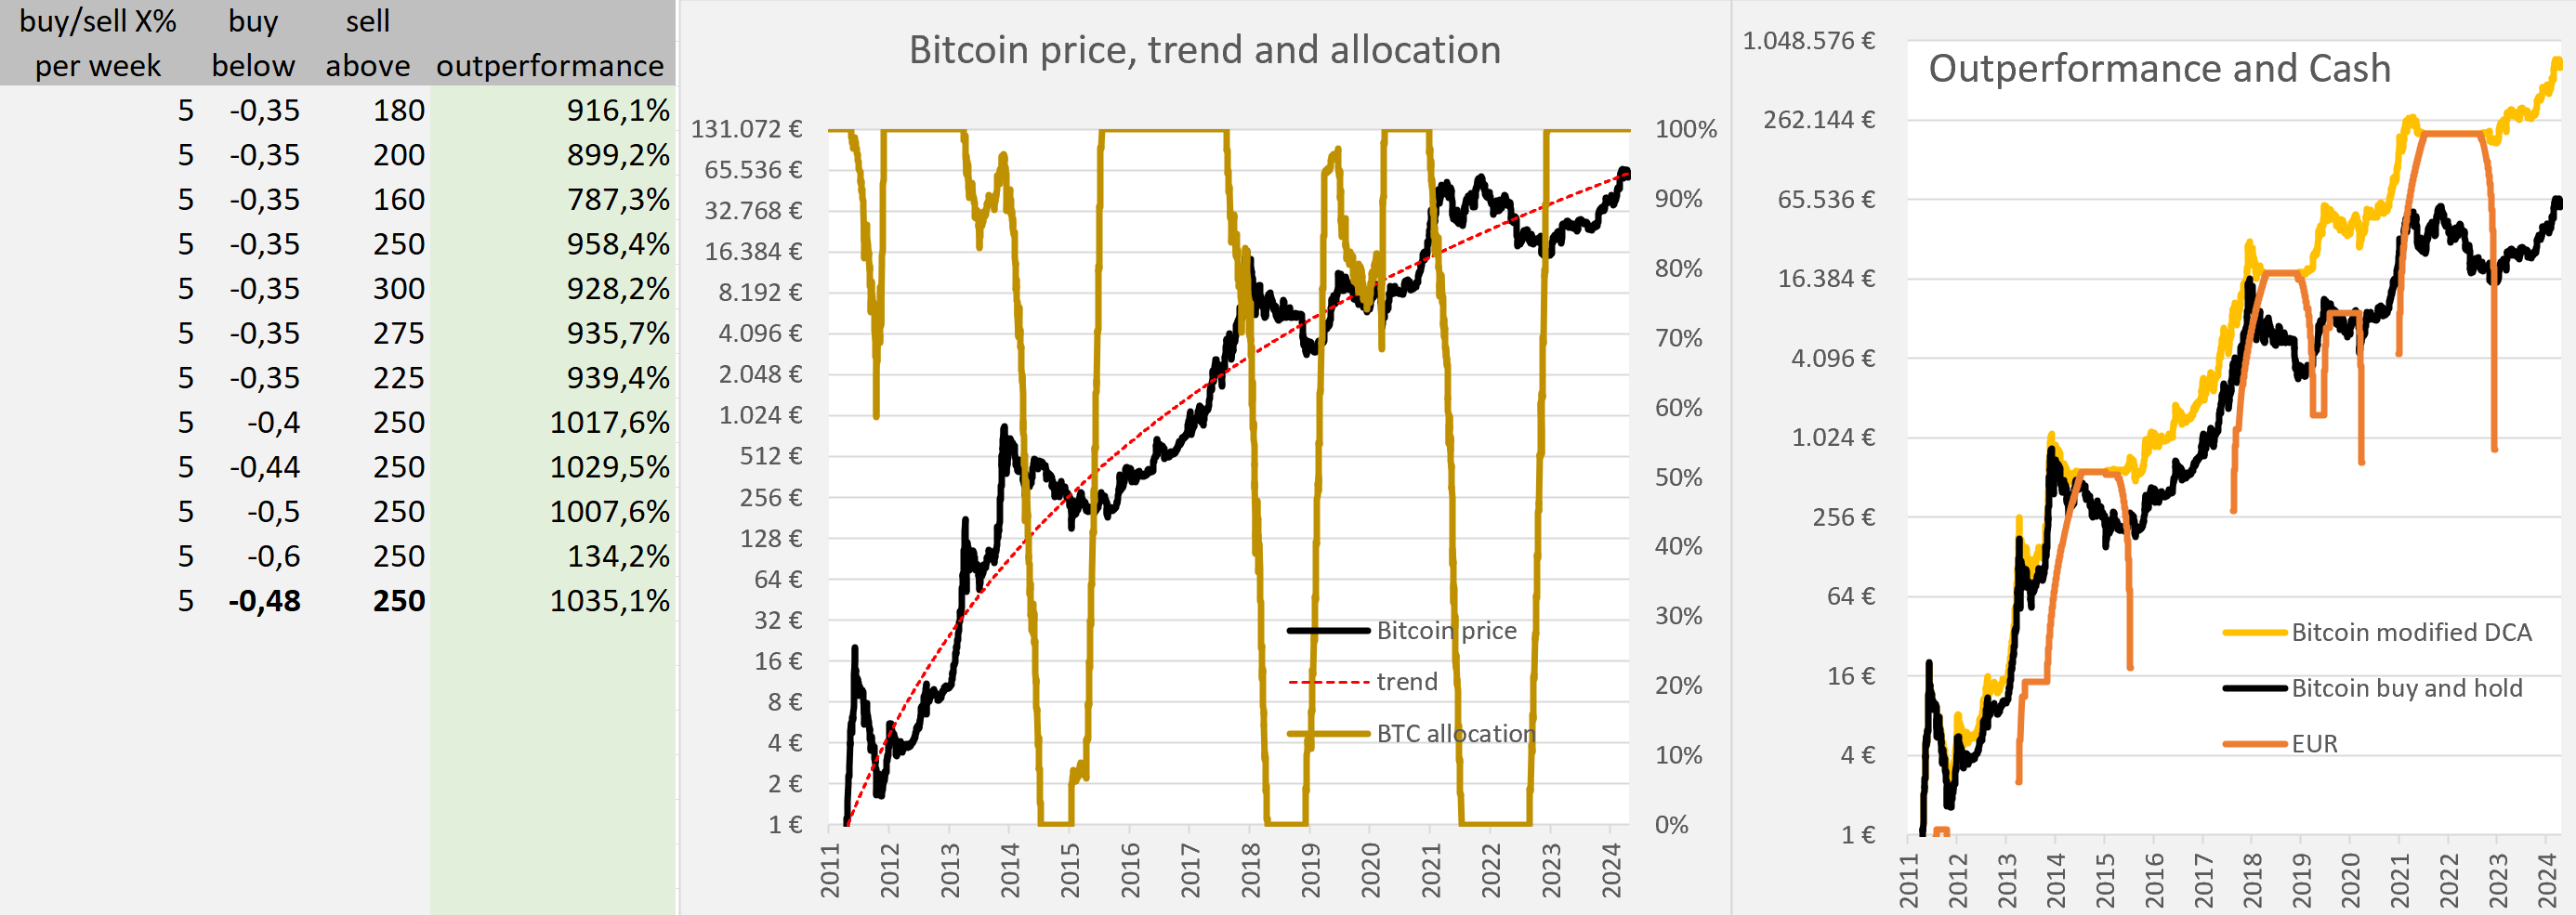 For a restriction of 5% our lower limit (-0.48) is almost at the optimum level without any restrictions (-0.5), but the sell limit is still much lower (250 instead of 750). The reason for this is, that the tops are short, but the bottoms take many days longer. For our trades to complete we therefore need to ease the restriction for selling more than the restriciton for buying. 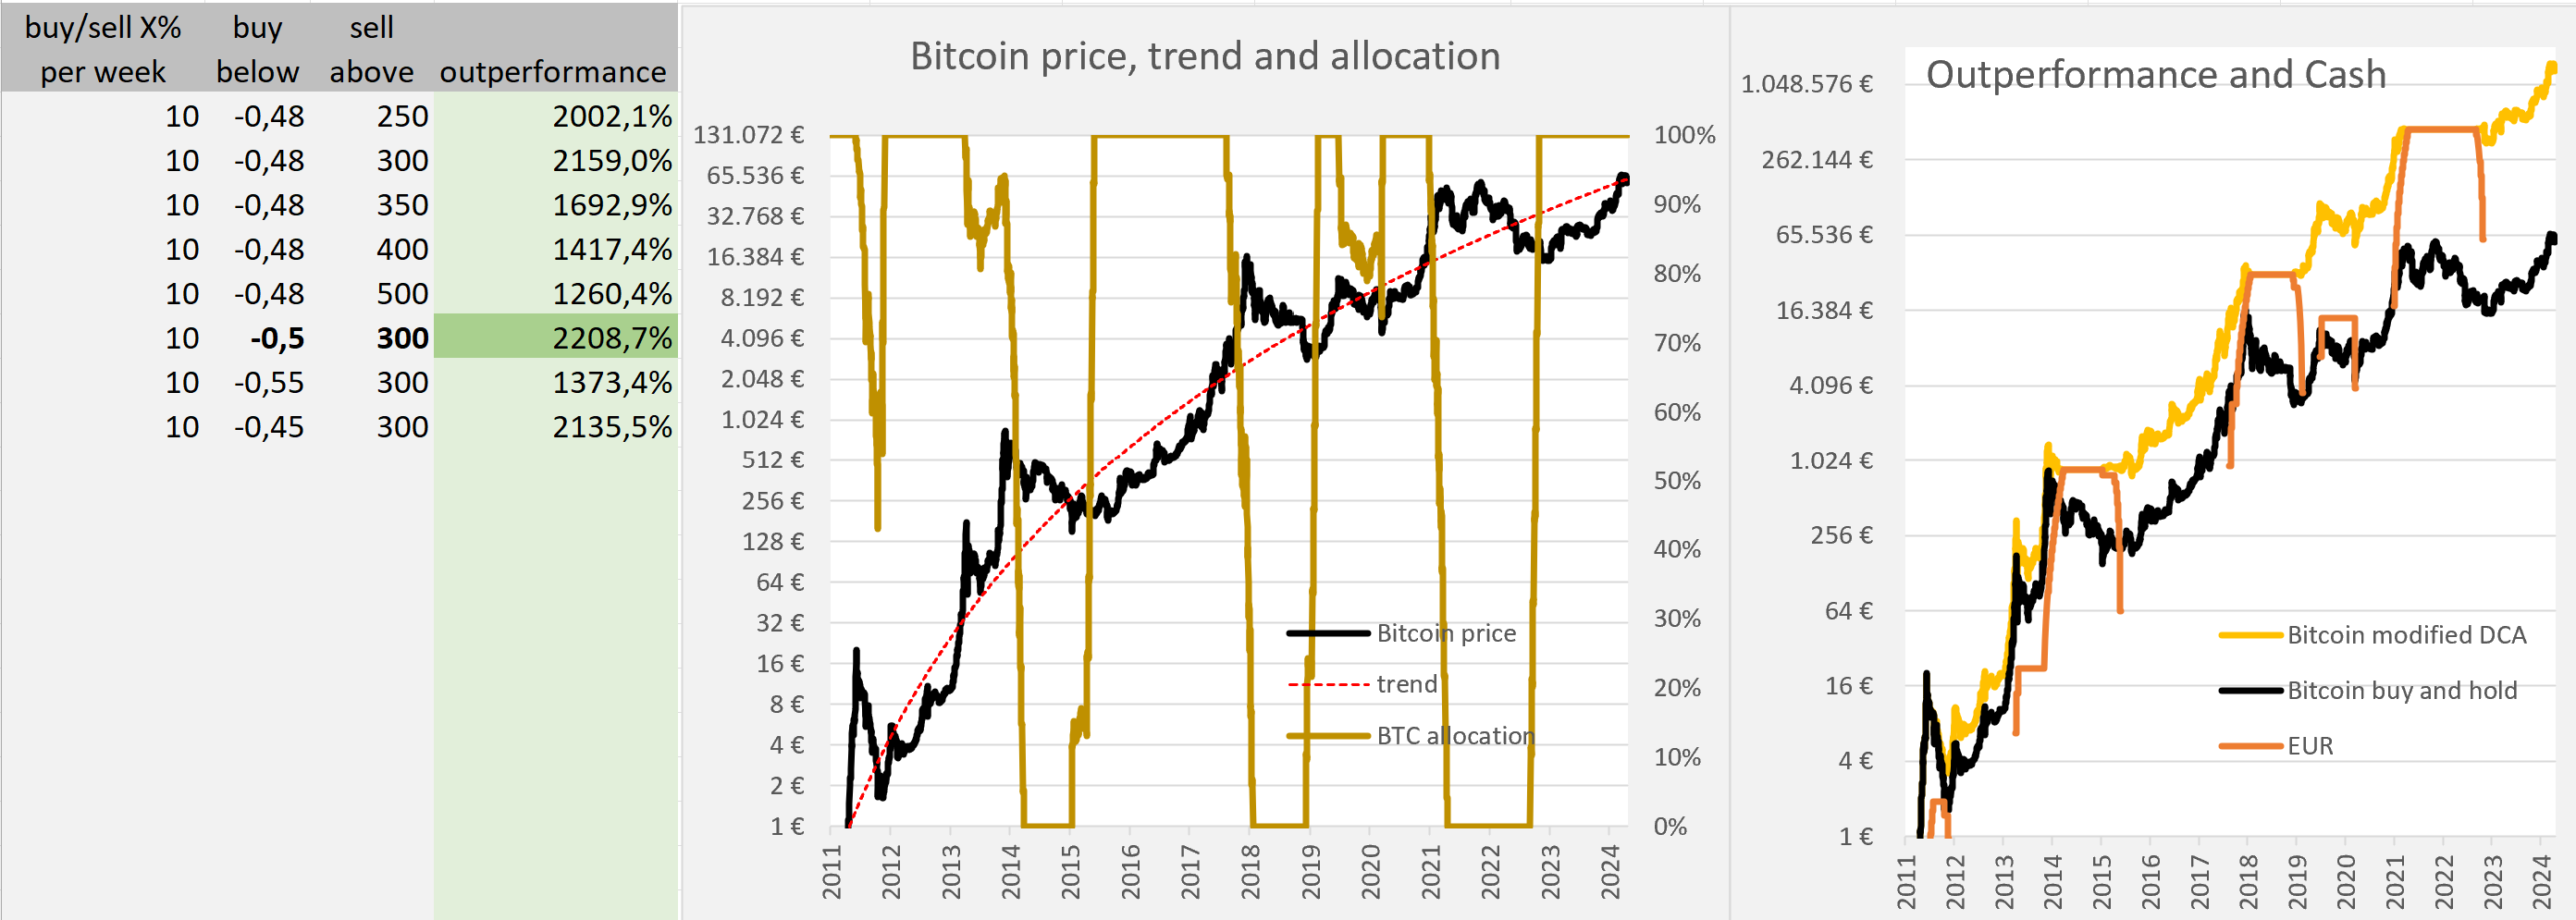 Even if our bank account is not very restrictive and allows us to trade 10% a week our sell trigger has to be eased quite a bit from 750 to 300.
Why not use all your Bitcoin for cycle-timing?Timing the cycle outperforms buy and hold by a wide margin, so why not use sell all our Bitcoin high and buy back low? Safety: Do we feel comfortable owning zero Bitcoin? Selling all your Bitcoin and leaving all that money in a bank may be risiky depending on your juristiction (Libanon, Egypt, Nigeria) and your relationship to the people in power (your are known as a critic of a powerfull corrupt politician in your contry). Privacy: You don't want to be targeted by robbers, who may hurt you and your family members to get you to transfer all your Bitcoin to them. So you don't want to spread the information how much Bitcoin you own around too much. Buying Bitcoin once, especially without KYC, checking your balances with your own node or over TOR, leaves less traces. Buying and selling all your Bitcoin every couple of years on a centralized exchange, leaves a lot of data for hacker and robbers to use. Non-fungibility: Maybe you think some UTXOs could have lower regulatory risk, so you might only sell UTXOs with higher regulatory risk and keep UTXOs with lower regulatory risk. -> We have to earmark which UTXOs and how many Bitcoin are we willing to sell.
Steps to perform for finding the optimal buy and the sell levels: Estimating the maximum fiat turnover: - How many and which bank accounts can you use? - How much turn over each bank account can stomach each month? Estimating maximum Bitcoin trading: - Earmarking UTXOs for selling: which UTXO in which order would I like to sell? - [Bitcoin earmarked for potential selling] * [Bitcoin trend price] [Bank limit in %] = [maximum fiat turnover] / ( [Bitcoin earmarked for potential selling] * [Bitcoin trend price] ) Backtesting the optimal buy and sell limit for your [Bank limit in %] |
|
|
|
S&P volatility is a useful indicator for Bitcoin, but not for tradingRegarding your S&P Volatility analysis i like the idea to use it as a psychological support in times of uncertainty, but i guess i would never use S&P related indicators for BTC trading. The reason is simple, S&P cycles are much longer than BTC cycles and i would not mix them.
I agree, S&P volatility is not very helpful for trading as shown in my backtest. It outperforms buy and hold, but underperforms cycle valuation trading. However I will add the volatility indicator to give me a rule based confirmation that the top or the bottom is in: 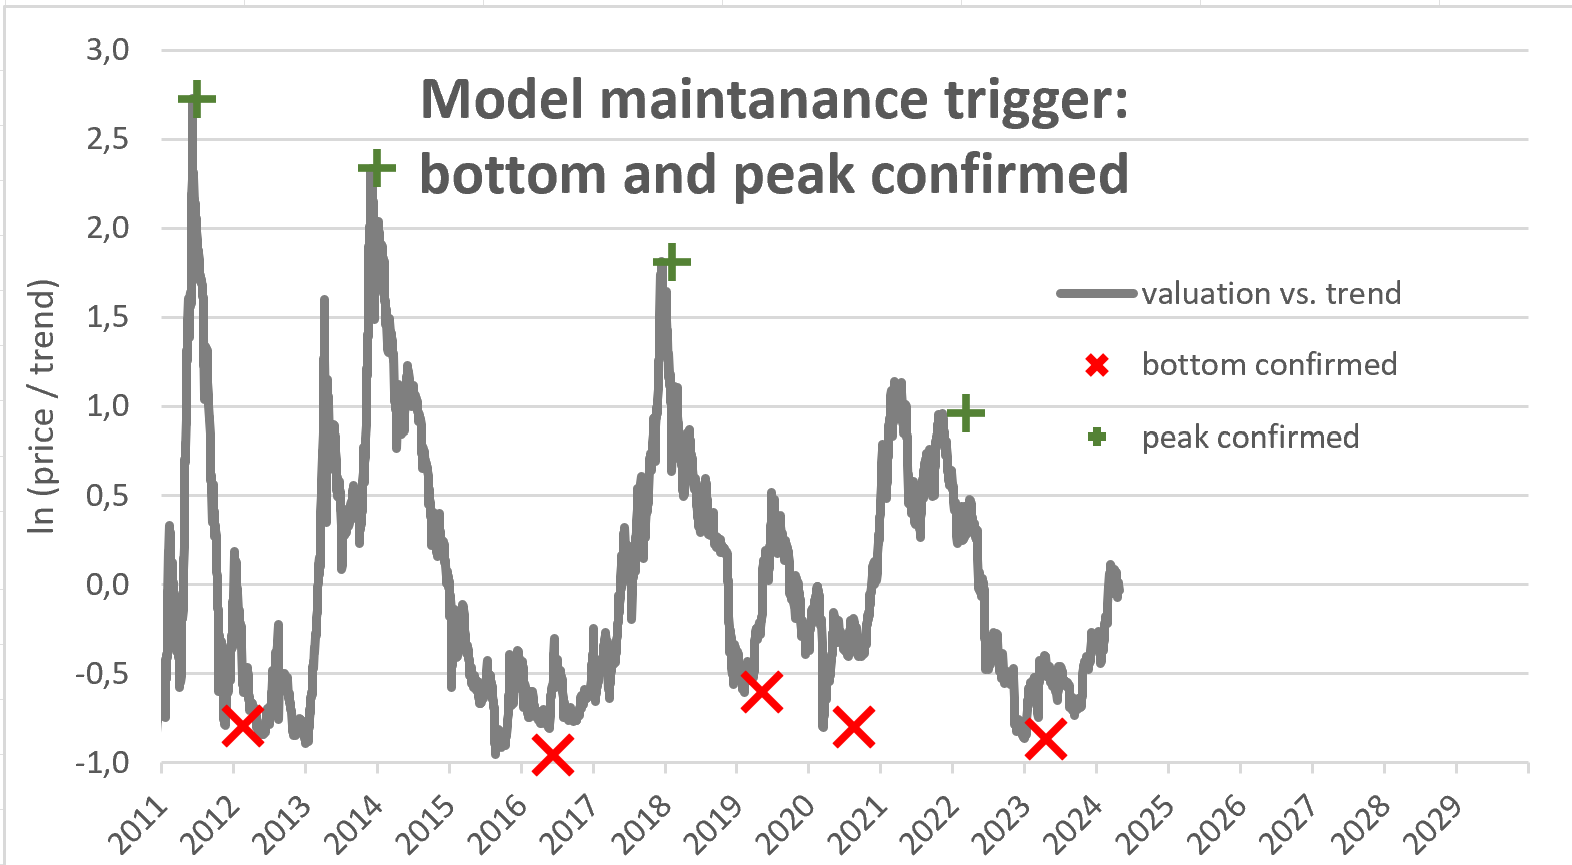 What I like about my bottom / top confirmation indicator: - rule based - no wrong signals up to now - top confirmation is quite close to the real top - bottom confirmation is still reasonable close to the bottom as a model maintenance trigger - very interesting is that during the double tops 2013 and 2022 our indicator only shows us the 2nd top What I dislike about my bottom / top confirmation indicator: - The trigger is not useful for trading since the Bitcoin price has moved quite a bit when my indicator calls the top or bottom.  for trading I will stick to valuation for trading I will stick to valuationRegarding BTC we had some full cycles since 2010 and a lot of data Points relating to all cycle phases.
Regarding S&P we only have one big bull market since 2010 only interupted by some "minor" corrections.
The problem is not the lack of S&P-volatility signals for Bitcoin, we had more than 10 signals since 2015, ... 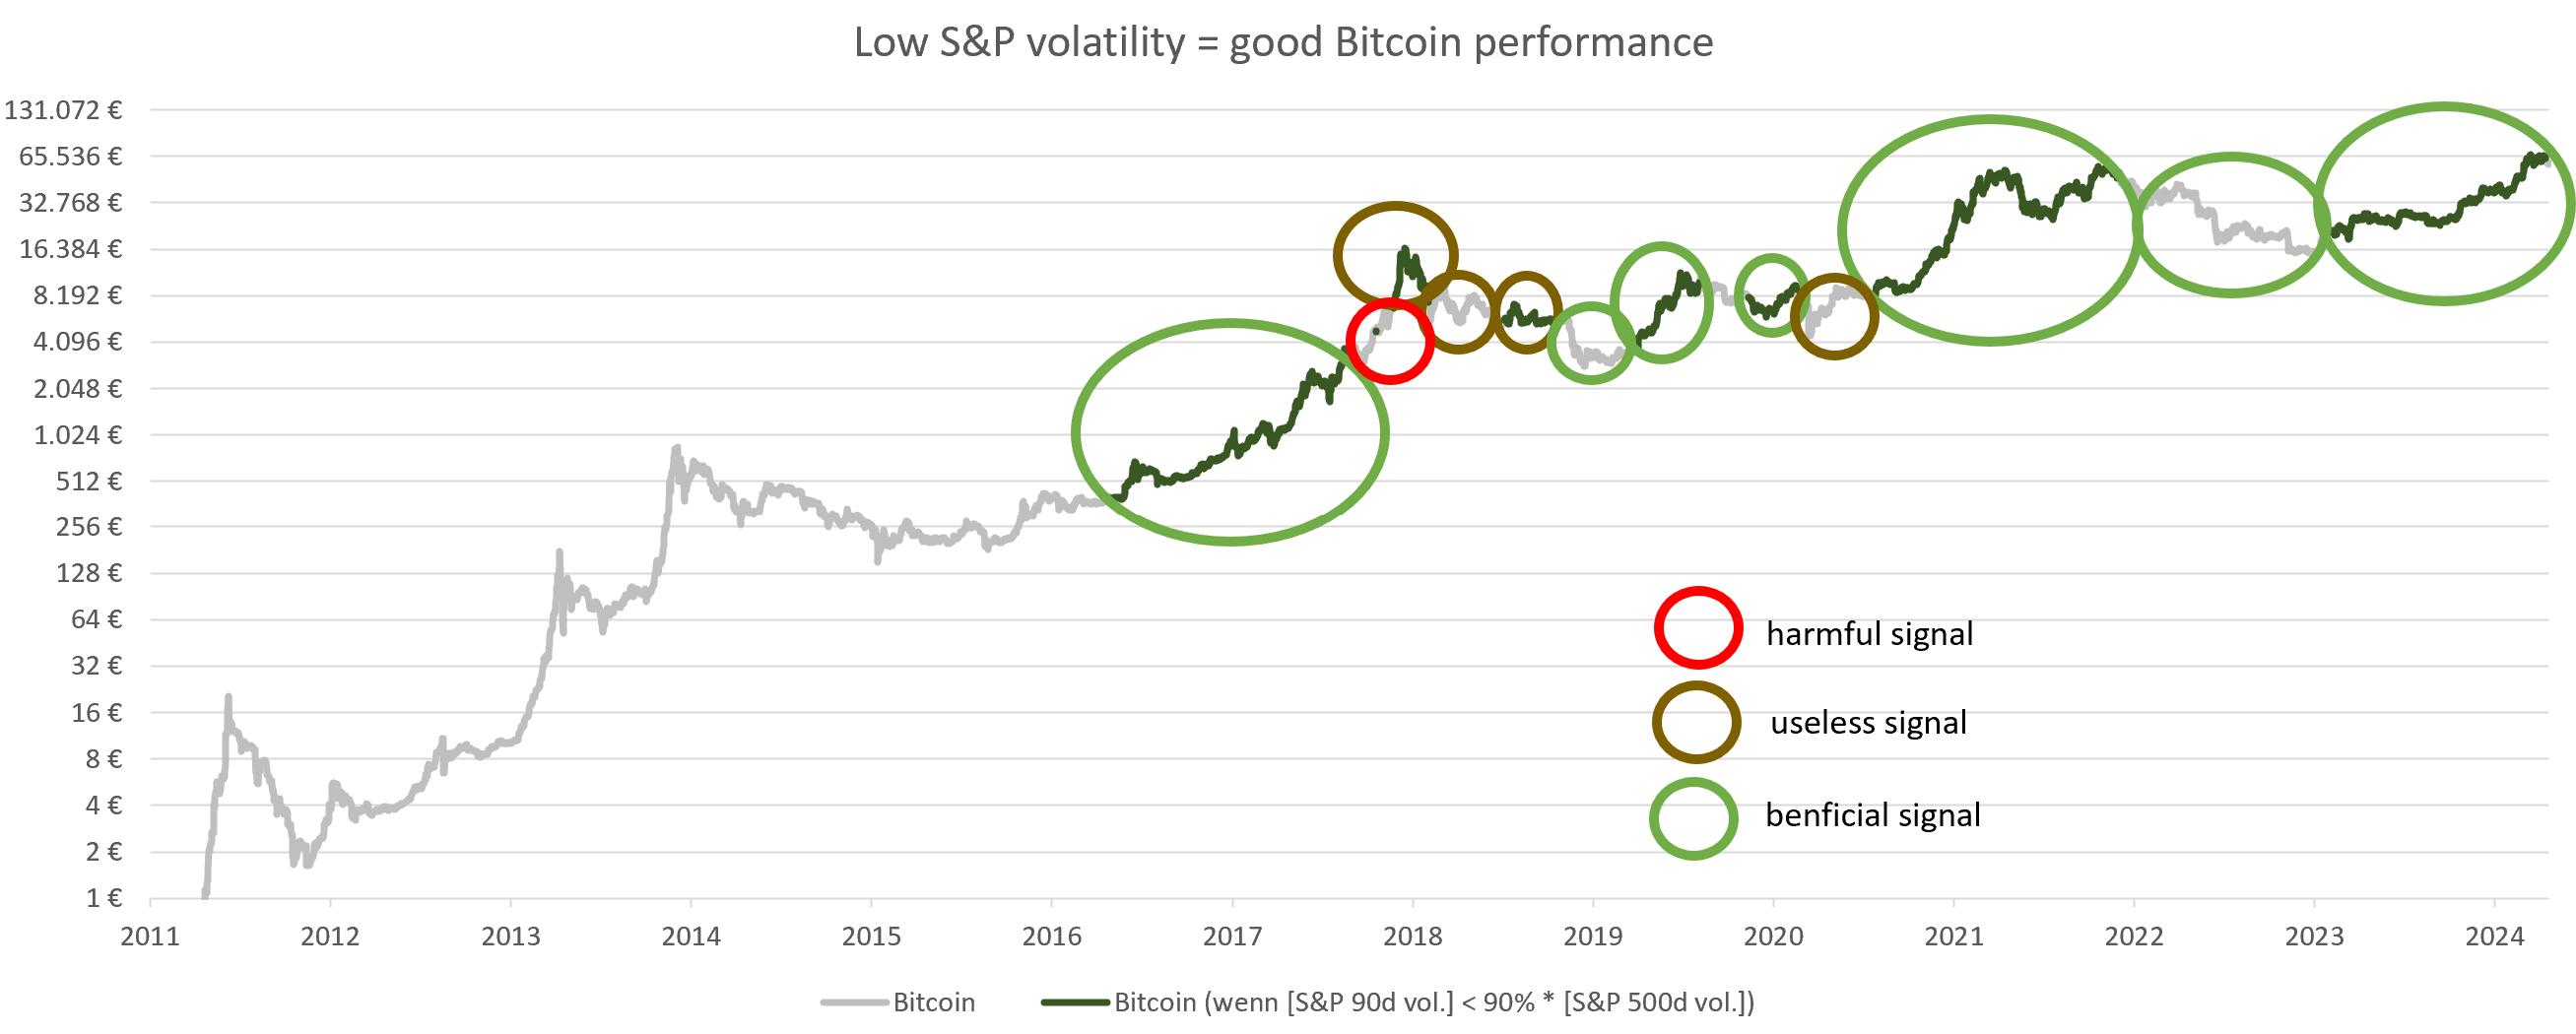 ... the problem might be a possible change in the relationship between S&P volatility and Bitcoin during a long term S&P bear market. One example for a change in relationship would be the gold price. During the bond bull market gold moved inverse to real interest rates, but in the bond bear market during last few years gold decoupled from real interest rates. So relationships can change. I would guess a liquidity or a risk event pushing the S&P volatility above average would definitely be bad for Bitcoin price in the short run. Especially since Bitcoin and legacy financial markets are connected via. ETFs and Futures. The question for me is: Can we improve the cycle based entry points by using DCA as a money management tool (not as an indicator)?
Using time based DCA: Is it better to buy @ Trend price -40% / ln(-0.5) all at once or starting the saving plan for X month from than.
 Is it better to buy @ Trend price -40% (= trend*e^-0.5) all at once. Starting the saving plan for X month from than yields you an underperformance for all X. For X = 12 you get an underperformance of e⁻0.4 = 33% DCA costs performance, but may be necessary to keep your bank happyUsing price based DCA: Is it better to buy @ Trend price -40% / ln(-0.5) all at once or split basket to buy @ -0.5, -0.6, -0.7, -0.8, -0.9 and -1.0 (and eventually miss the dip with some orders and have some FIAT left)?
Missing the dip and being partly invested in cash will yield you a significant underperformance over a whole cycle. We could reduce the underperformance by canceling the -1.0 after a certain time and placing a market order at -0.2 instead. On average you will loose with the -1.0 bet. Not only are you more likely to go from -0.5 to 0.0 than to -1.0, but additionally you have a positive trend. Nevertheless I'm interested in this question as well to place the orders around a peak and a bottom. Not so much in order to get further outperformance, but form an operational stand point to not overburden my bank accounts with inflows triggering AML procedures in the bank. I can prove all my buys and all taxes are paid. However it is still a hassle I would like to avoid. Also some banks might dislike Bitcoin, despite buying Bitcoin is legal. As Bitcoin prices increase, it is possible I can only sell 3% of my Bitcoin peer to peer. A centralized exchange CEX would make additional 10% sales possible. If I sell at the best possible moment, I could only sell 3% (incl. CEX 13%) of my holdings. Spreading it out over 4 months would make it possible trade 12% (incl. CEX 22%).
|
|
|
|
TL;DR: If you have a lump sum to invest into Bitcoin, buying now gives you more Bitcoin than DCA over the next couple of months. However most people should DCA, because it is mentally easier, or it fits better to your liquidity profile (monthly salary) or you enter the bitcoin space during overvaluation.Background: I came to the conclusion that my Bitcoin allocation is too low. As a result I have to sell shares to buy Bitcoin. So my question is, do I go all in now? Or do I cost average into Bitcoin over several months?
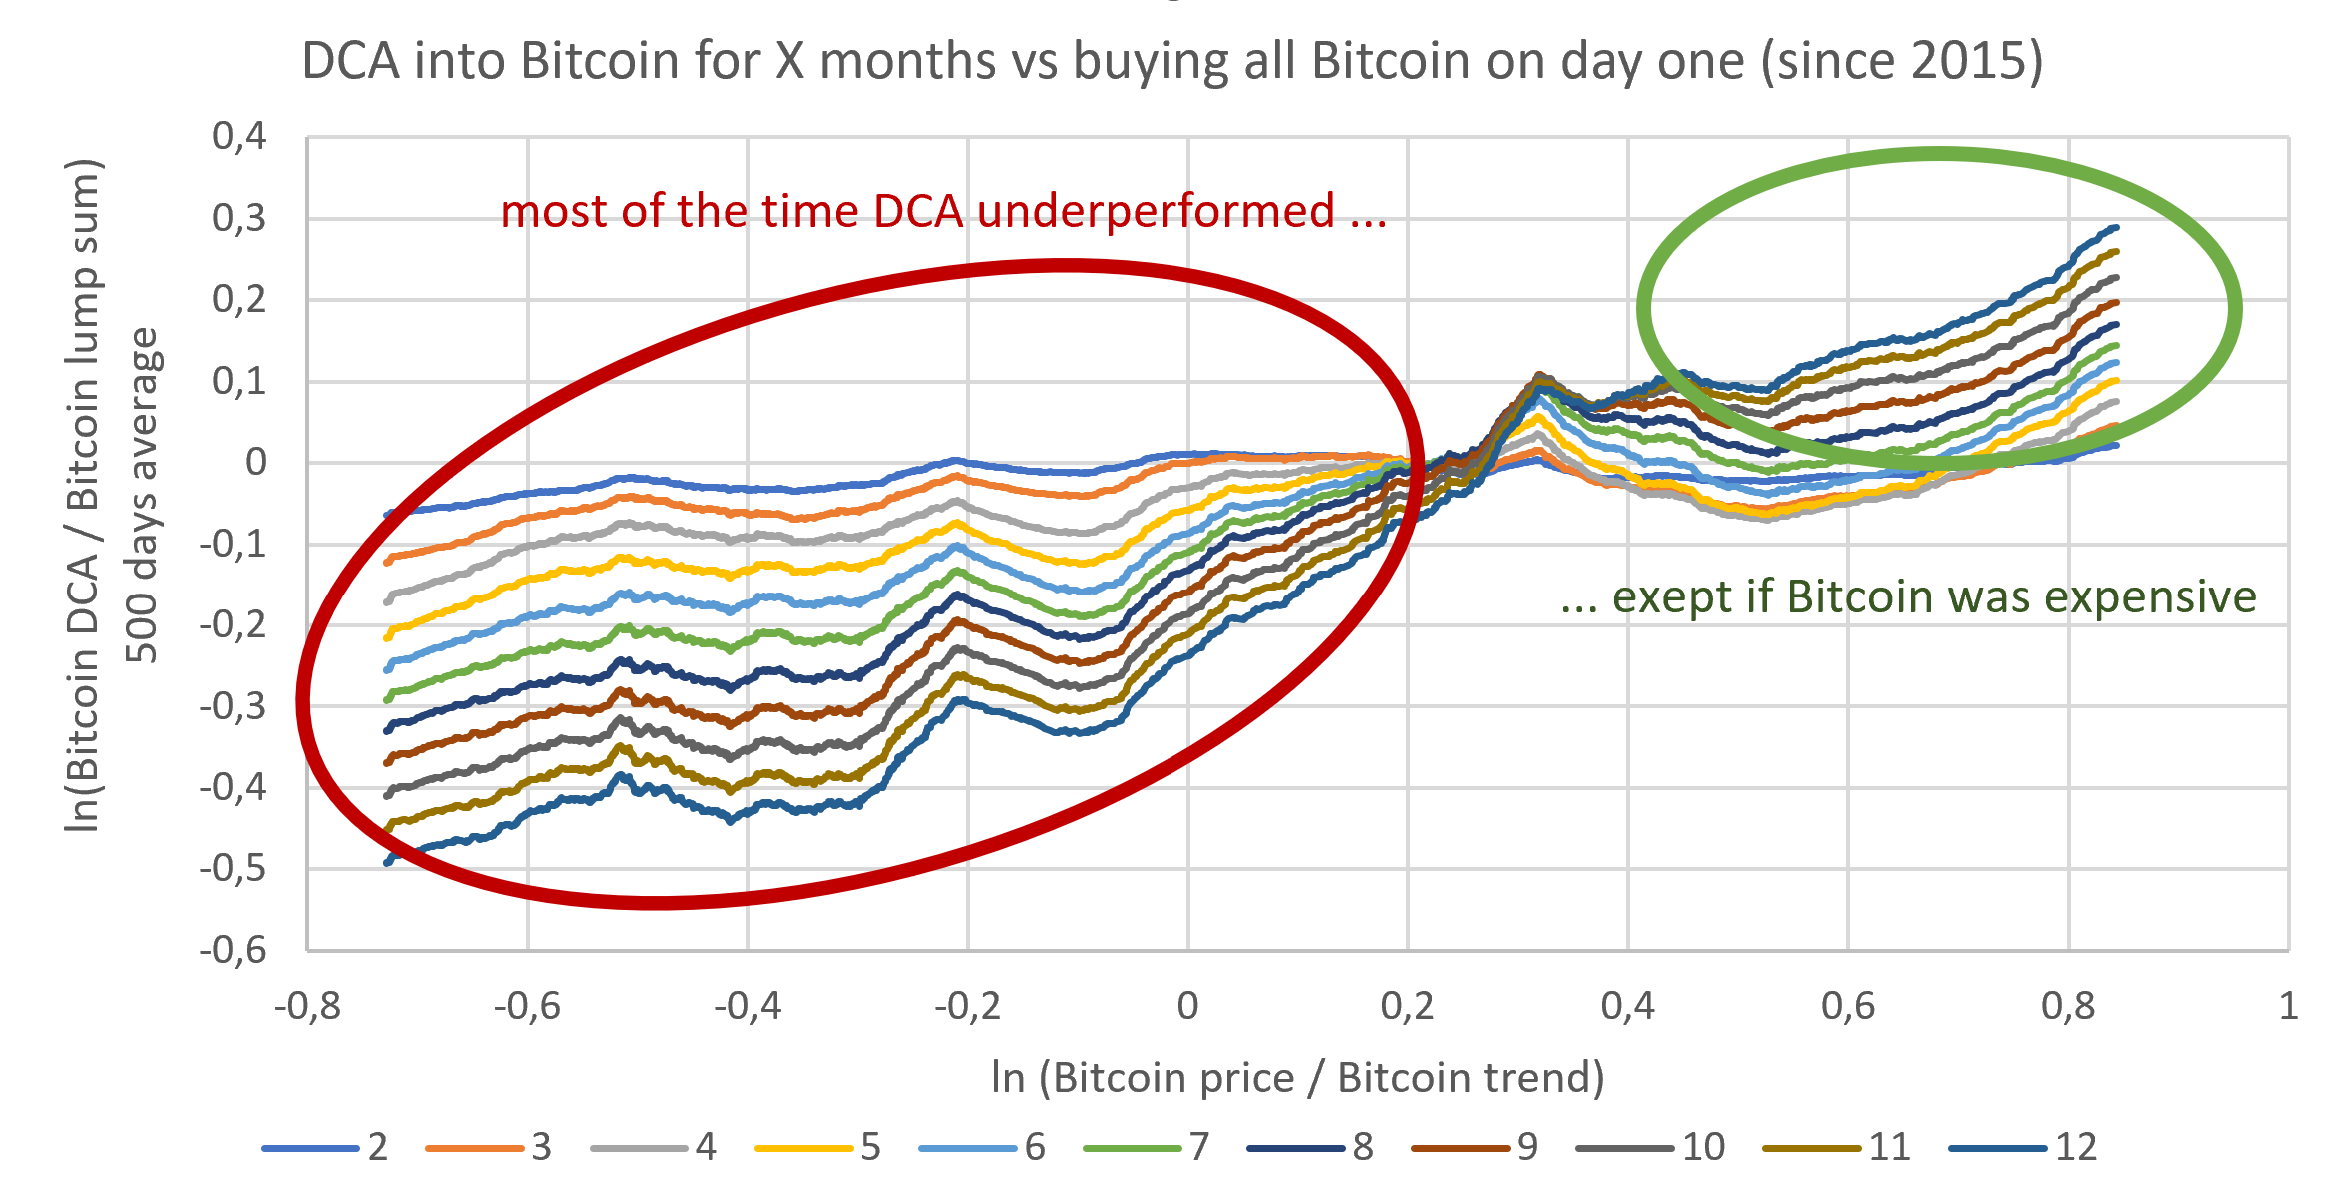
The first and last time I invested significant money (relative to my net worth) into Bitcoin was Nov. 2021 very close to the peak. Now after several years I broke even (not inflation adjusted). This time I want to make a better decision.I compared a lump sum investment vs. a DCA investment spread out over 2 to 12 months for every day since 16.07.2010. 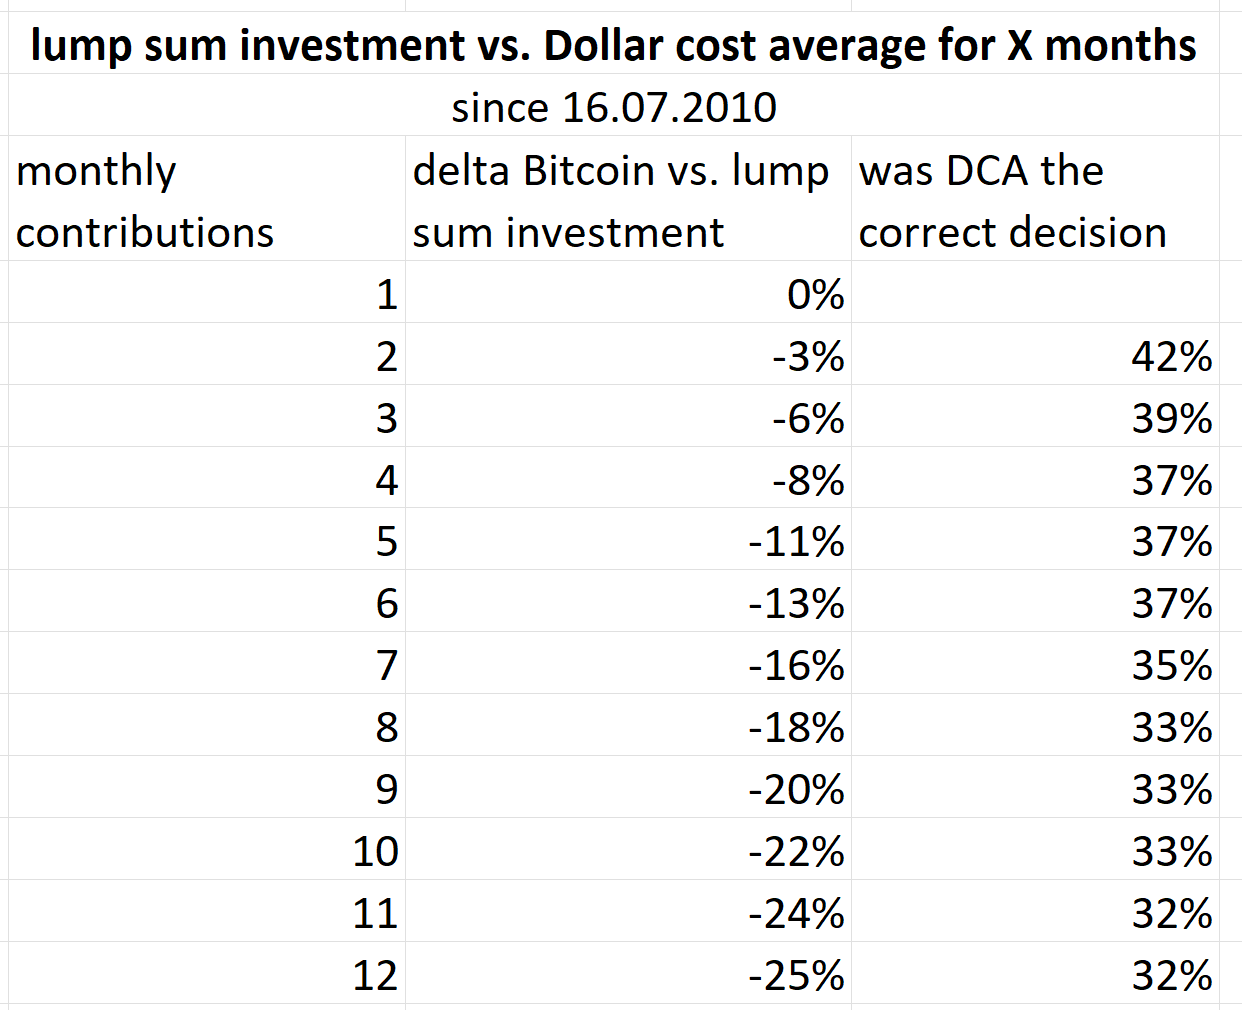 The longer you spread out your Bitcoin investment the less Bitcoin you get. If you split your initinal investment into 2 equal monthly investments, you get 3% less Bitcoin on average. Spreading your investments out over 12 months makes gives you 25% less Bitcoin on average. The decision to DCA into Bitcoin is around 1/3 of the time better than a lump sum investment (32% for 12 months DCA). 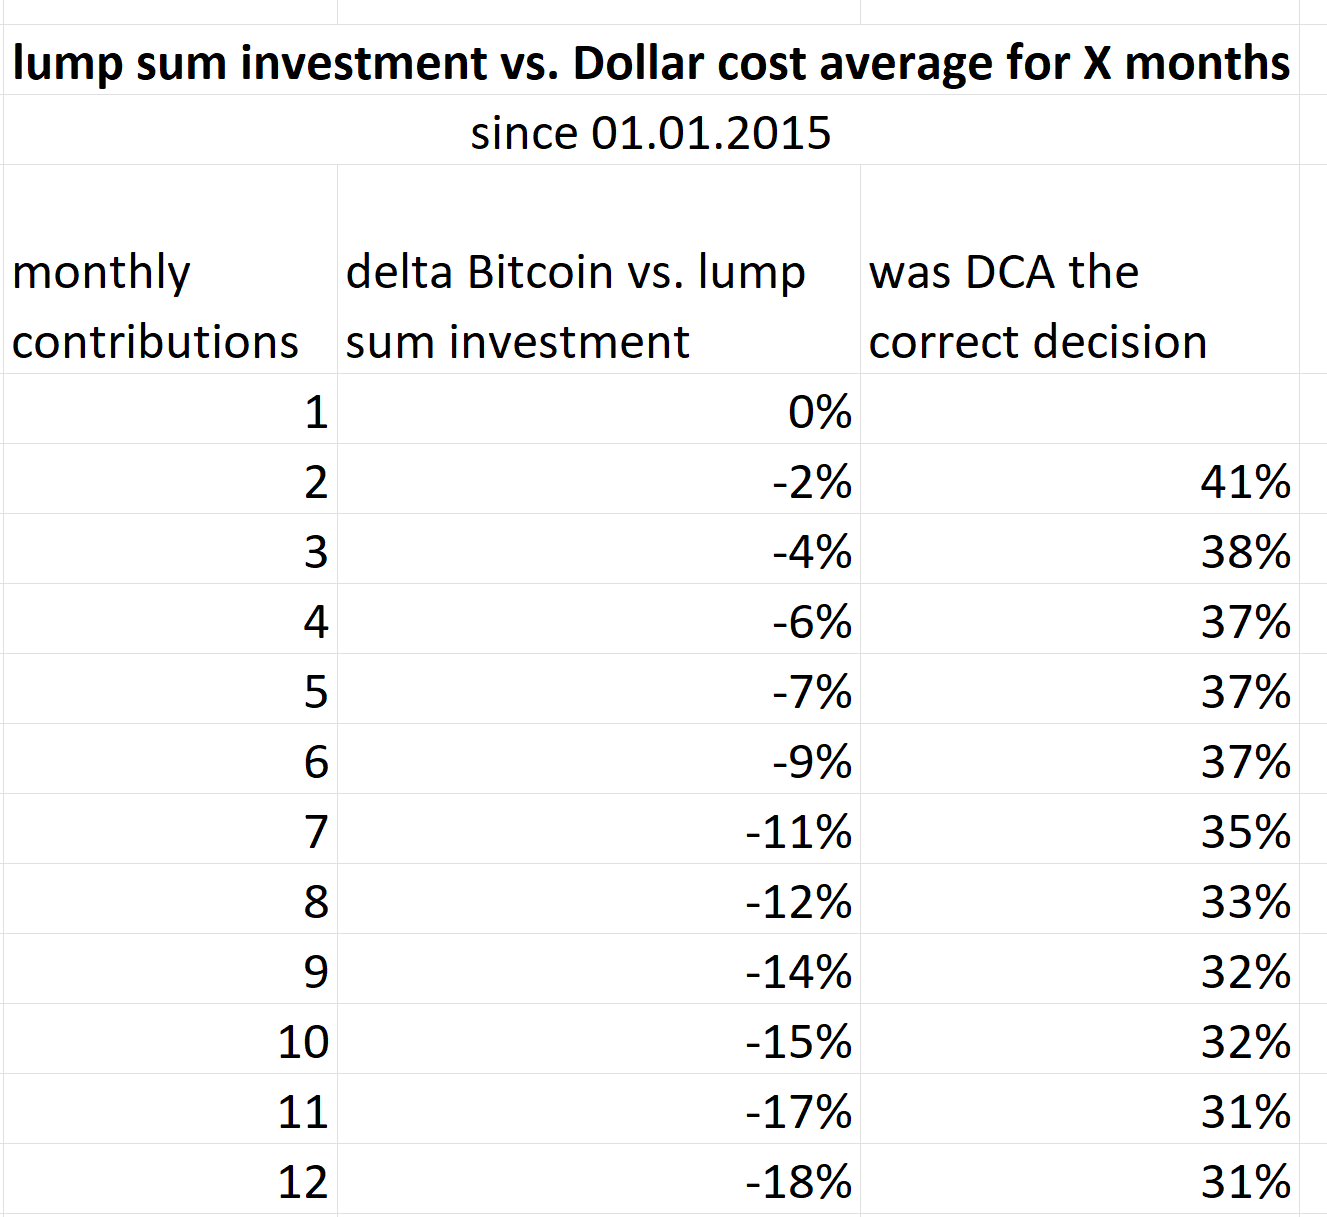 If we only take data from 2015, DCA makes you miss out on less Bitcoin (18% instead of 25% for 12 months), while DCA remains a better decision than lump sum investment 31% of days. This makes sence, since Bitcoin has a positive price trend vs. cash on average. The longer we wait to buy Bitcoin the higher Bitcoin's price trend increased. Waiting to buy Bitcoin is always a very dangerous game. So when does DCA outperform?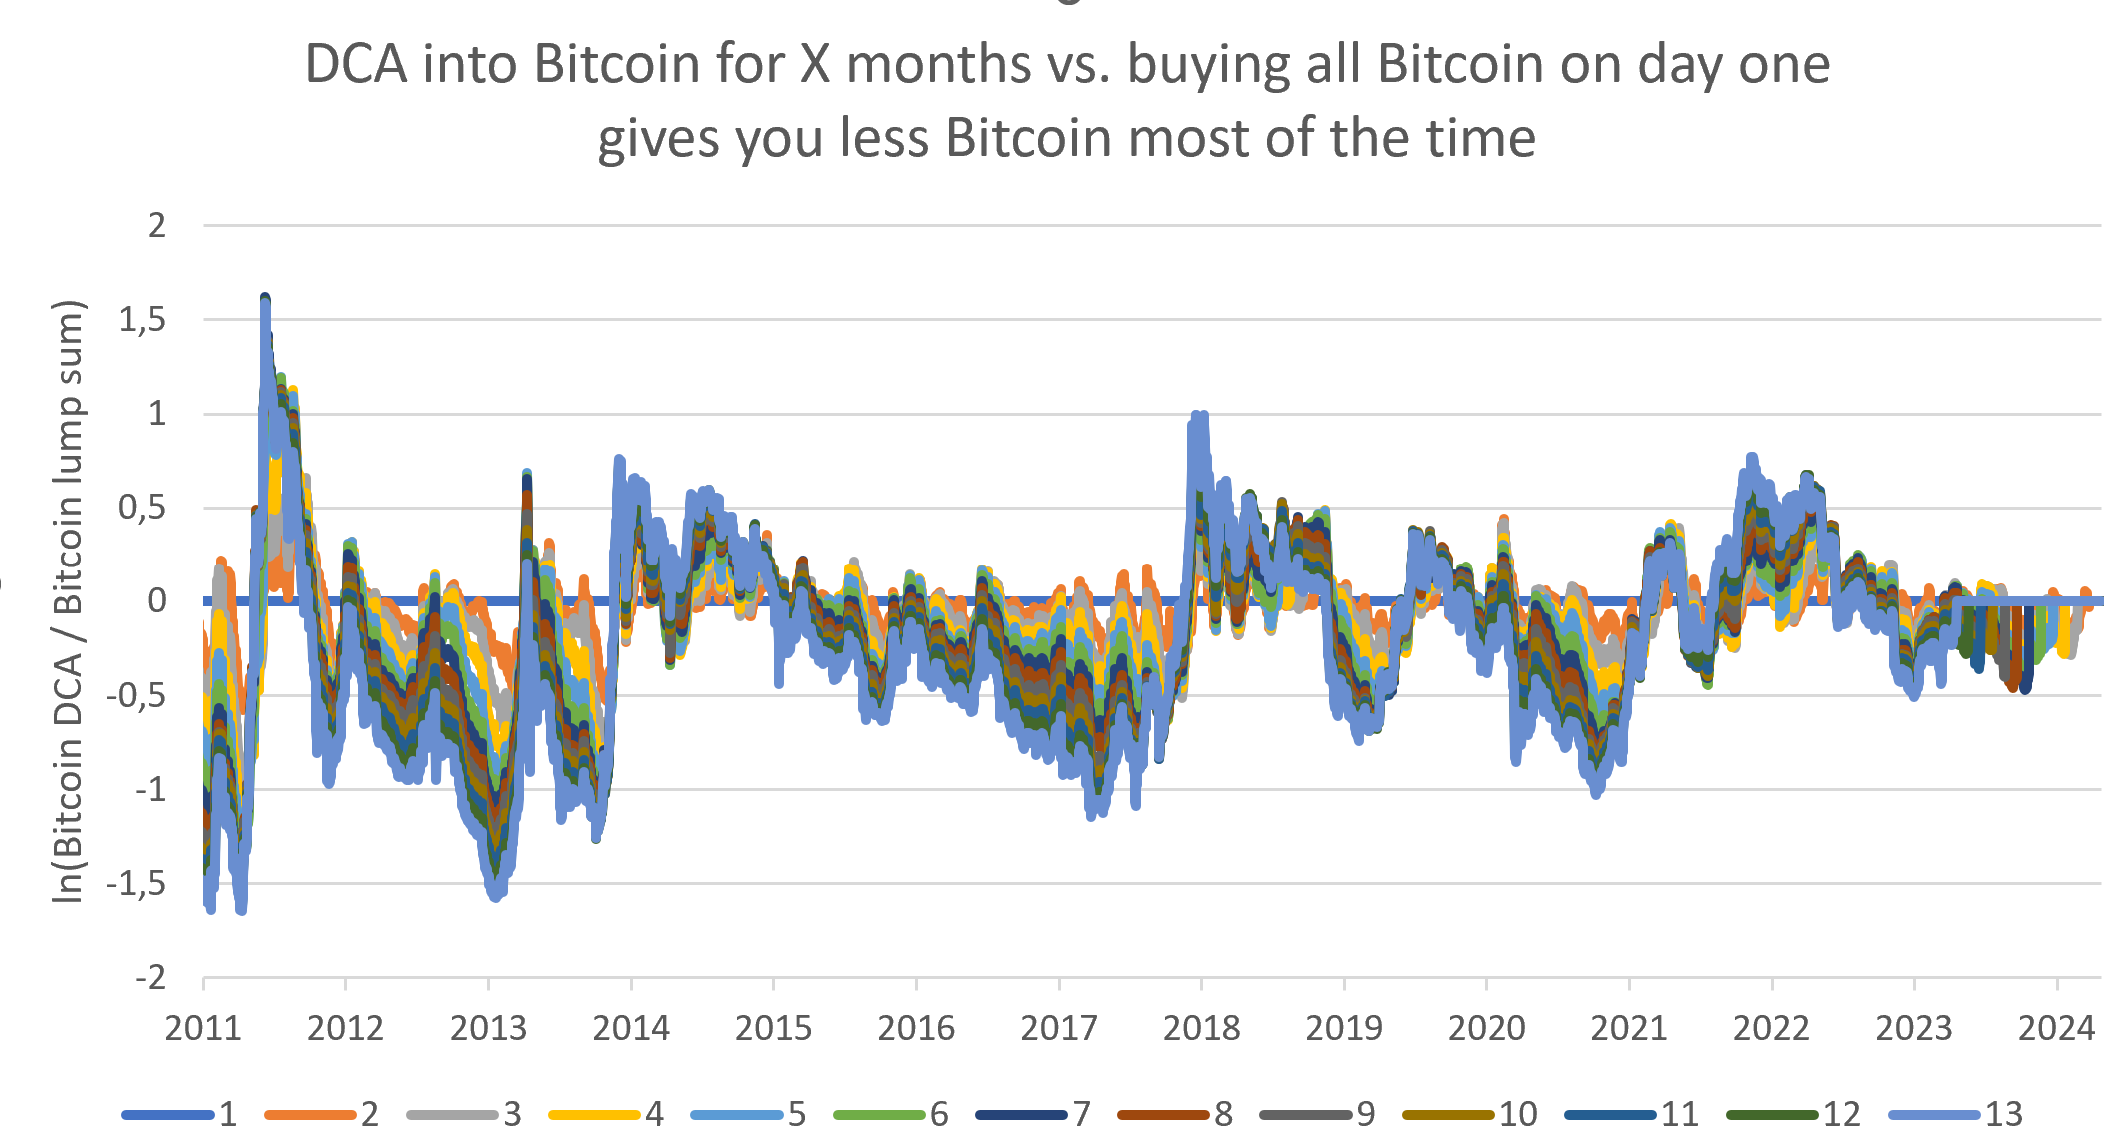 We can see most of the time the curves are blow zero meaning most days DCA underperforms, but we have some time frames DCA looks like a better idea. 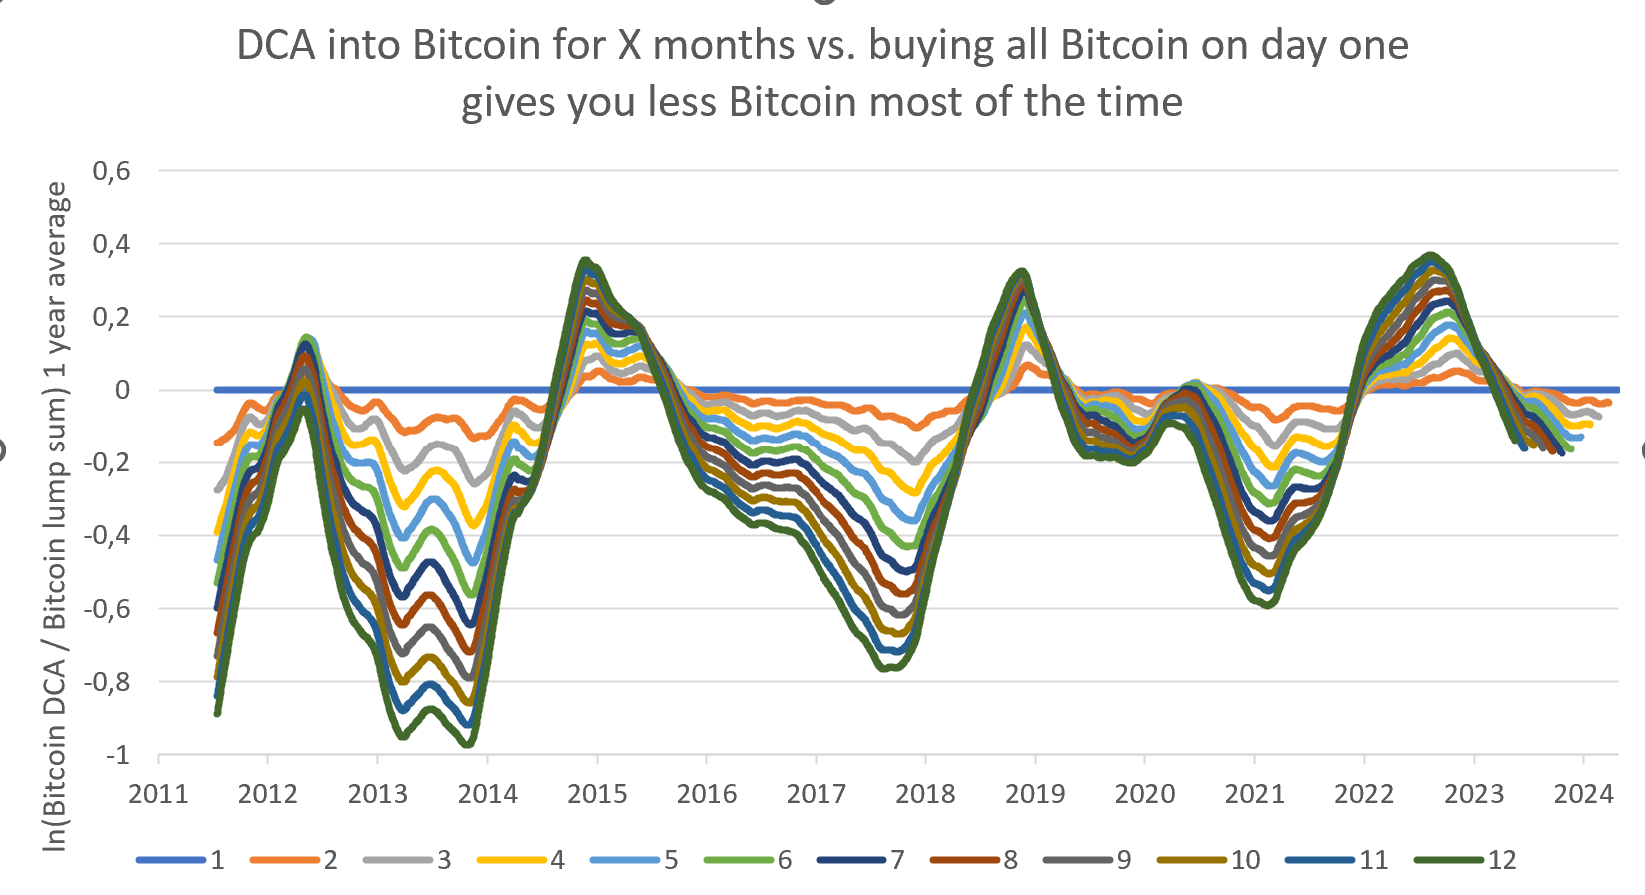 The more wie spread out our investment into Bitcoin, the more extreme our results become (bigger wins and bigger losses). DCA outperforms lump sum investment, when we start close to a peak, but underperforms otherwise. 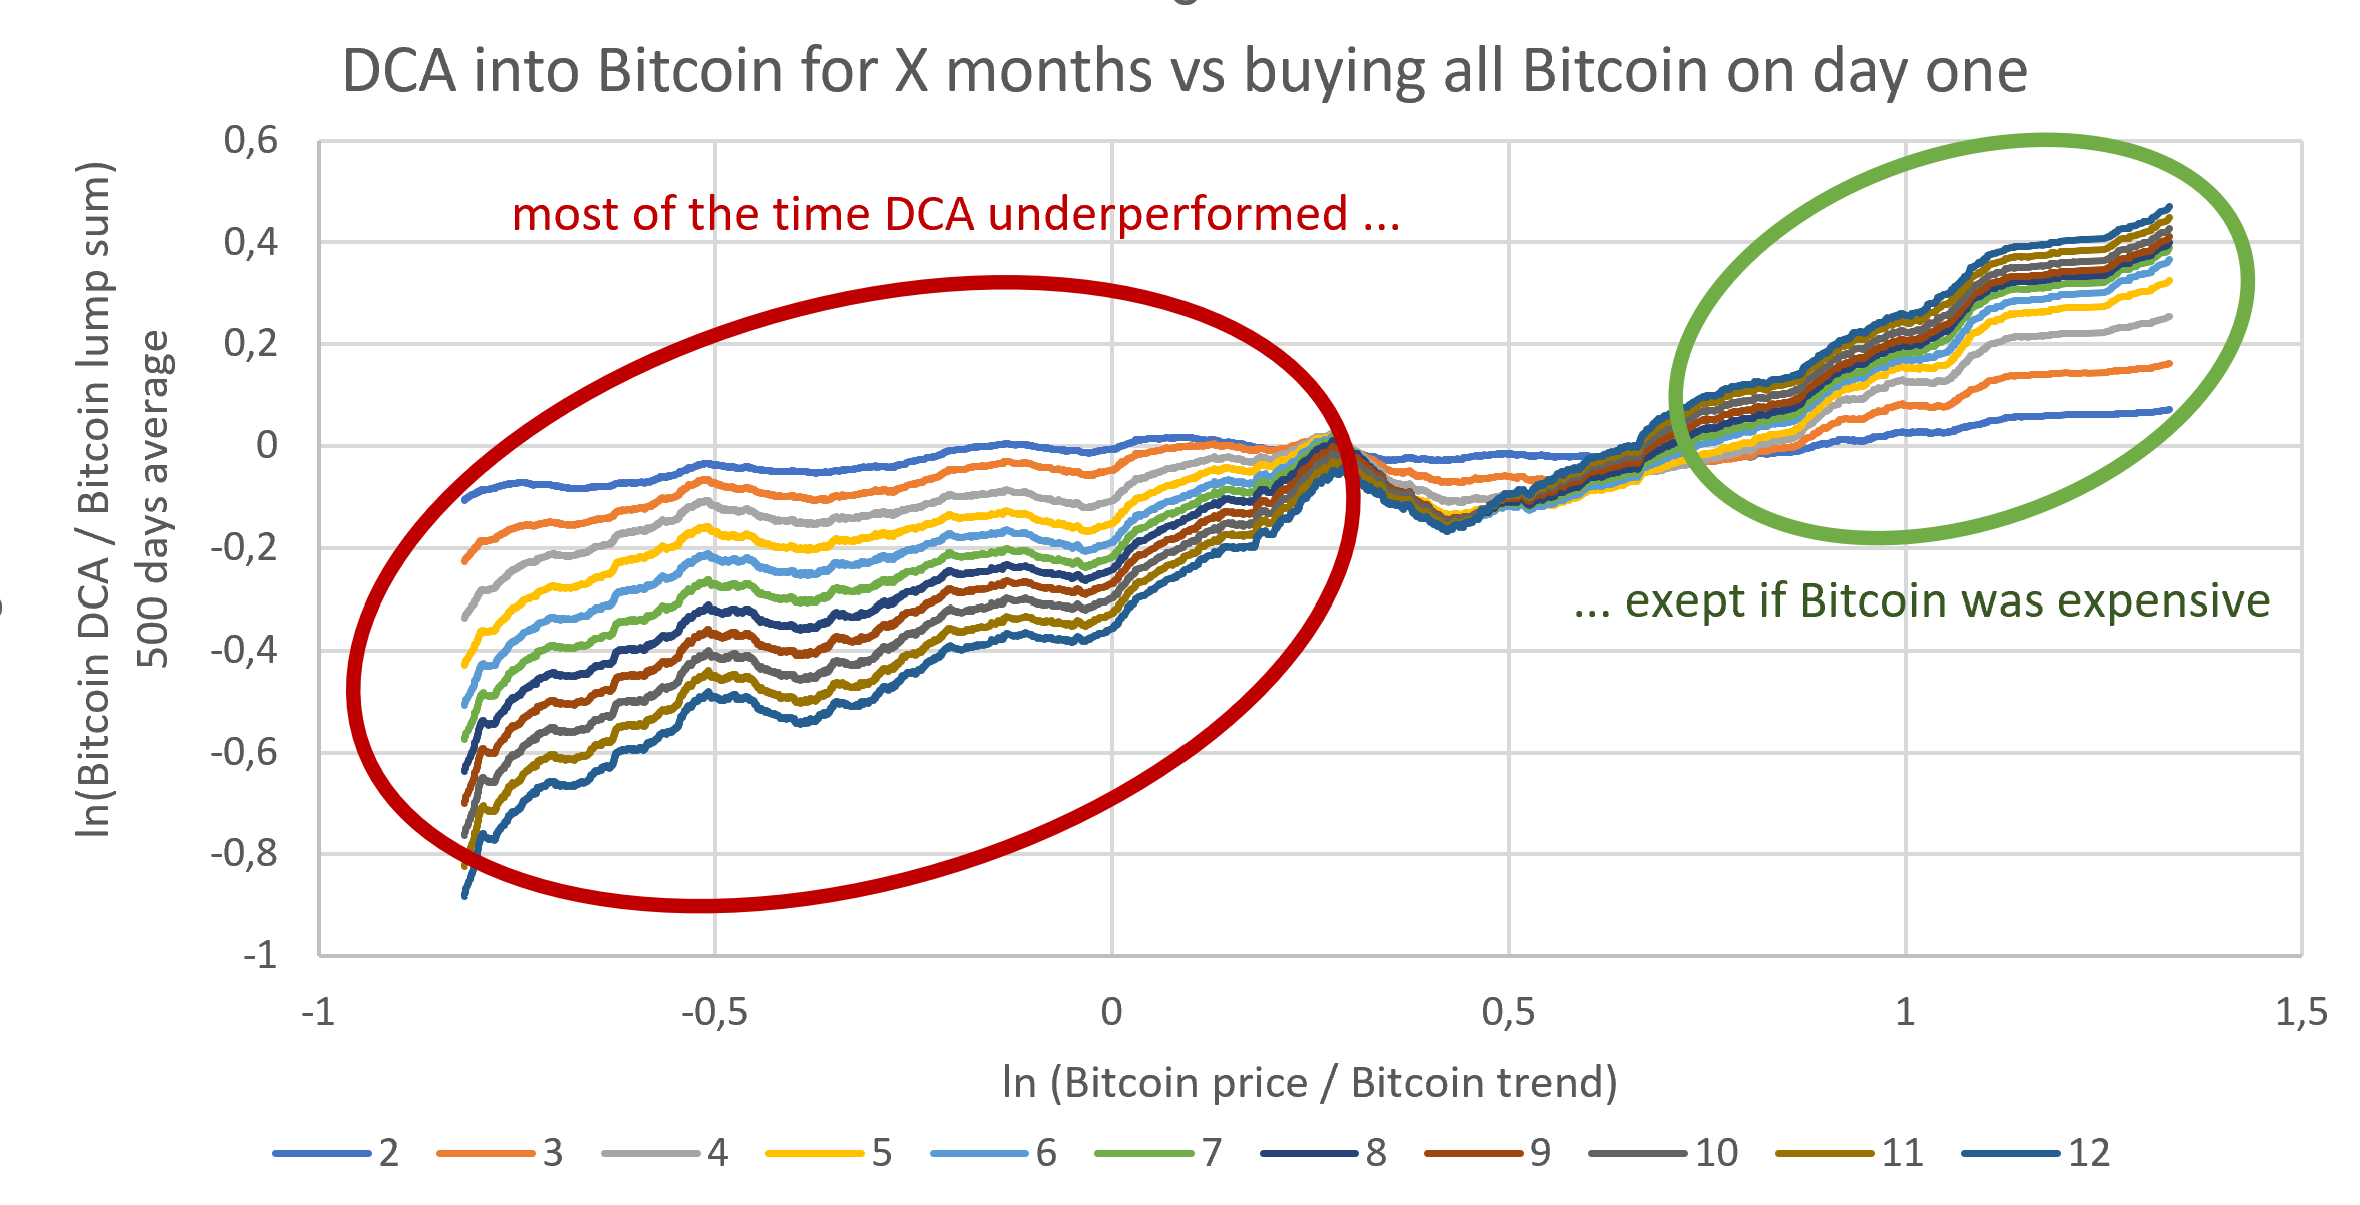 We can plot our DCA outperformance vs. our position in the Bitcoin cycle. For undervaluation and moderate overvaluation it lump sum investment was better than DCA. For significant overvaluation the longer we spread out our Bitcoin buys in time the more successful we were in avoiding buying at the peak. If we only look at data since 2015 the effect is smaller, but the decision is the same. For undervaluation and moderate overvaluation better buy Bitcoin as soon as possible (= lump sum, no DCA). Currently we are at 0 overvaluation.  Since 2015 we can observe 12 month DCA buying 21% less bitcoin than lump sum investments. However on the time frame between 2 and 3 months DCA performed roughly as well as a lump sum investment. Since DCA makes us buy Bitcoin later than buying at the first possibility, I would expect I'm missing out on the Bitcoin price trend with the proportion of cash not invested yet. This expectation is quantified in the column "expected DCA underperformance". We can see, the observed and the expected underperformance roughly match. Since Bitcoin price currently is roughly equal to trend, I would expect to miss out on the Bitcoin price trend growth, if I would DCA instead of investing everything now. However the trend 2024-2025 is lower than the trend 2015-2024. Therefore the expected underperformance would between 2% (2 months) and 16% (12 months) Conclusion: DCA can be useful, if the monthly Bitcoin buys matches your monthly liquidity surplus (salary minus food and rent). However if you already have some liquidity, which has to be invested into Bitcoin to reach optimal Bitcoin allocation, it is most cases optimal to buy Bitcoin as soon as liquidity is available. Spreading your buys out over several months is only optimal, if Bitcoin is significantly above trend. This this case, we should just wait until Bitcoin gets closer to trend again.
|
|
|
|
TL;DR: I present a second strategy to outperform buy and hold. Bitcoin has excellent performance when stocks have low volatility. Bitcoin has poor performance when stocks have high volatility. Only holding Bitcoin during low-volatility-times gives you higher returns with lower drawdowns than buy and hold. However this strategy is still inferior to timing the Bitcoin cycle (buy trend-40%, sell trend+750 days). Combining cycle and volatility information does not improve results vs. only timing the cycle, but can give you additional clarity about our position in the cycle.How would you use our indicator (Bitcoin outperforming during periods of low volatility) to modify buy and hold or DCA?
Above average volatility in the S&P 500 stock index is associated with poor Bitcoin returns in a stable way.evidence #1  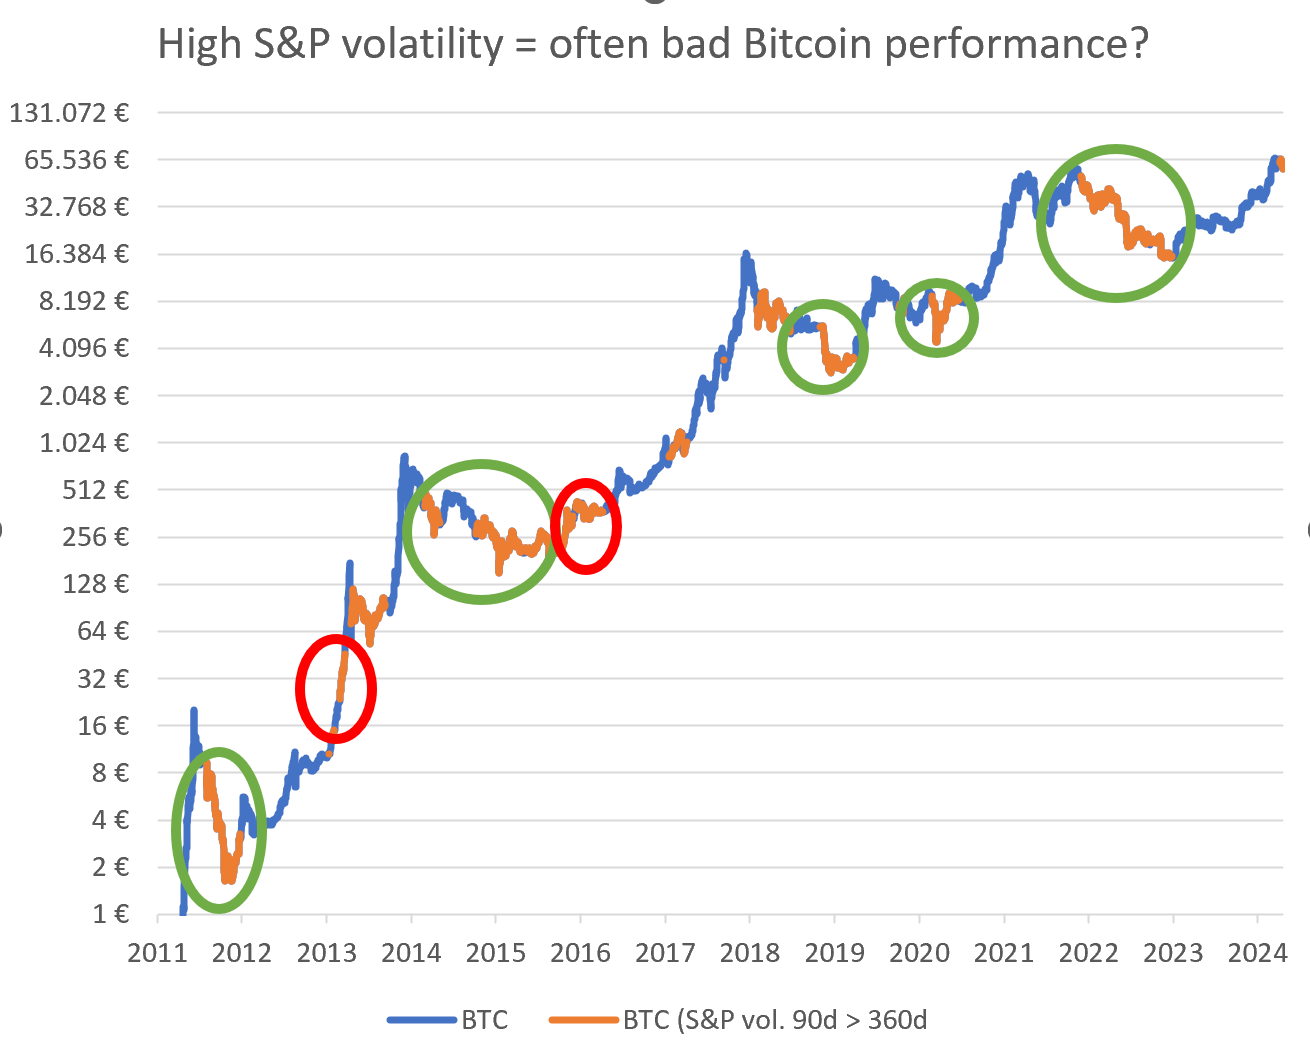  Chart description: Chart description:- blue line = Bitcoin price at low S&P volatility - orange line = Bitcoin price during high S&P volatility - green circle = expected result: high S&P volatility leads to poor bitcoin performance - red circle = unexpected result: good bitcoin performance despite high S&P volatility - yellow circle = no significant bitcoin price movement during high S&P volatility Interpretation: As you can see, most of our cycles are green, so high S&P volatility almost always gives us poor Bitcion returns. There are a few periods where our bitcoin volatility indicator "does not work" and bitcoin performs well despite above average S&P volatility. I like the stability of the results. No matter how we measure short-term (30 days or 90 days) and long-term (360 days or 500 days) volatility, our volatility indicator works reliably. evidence #2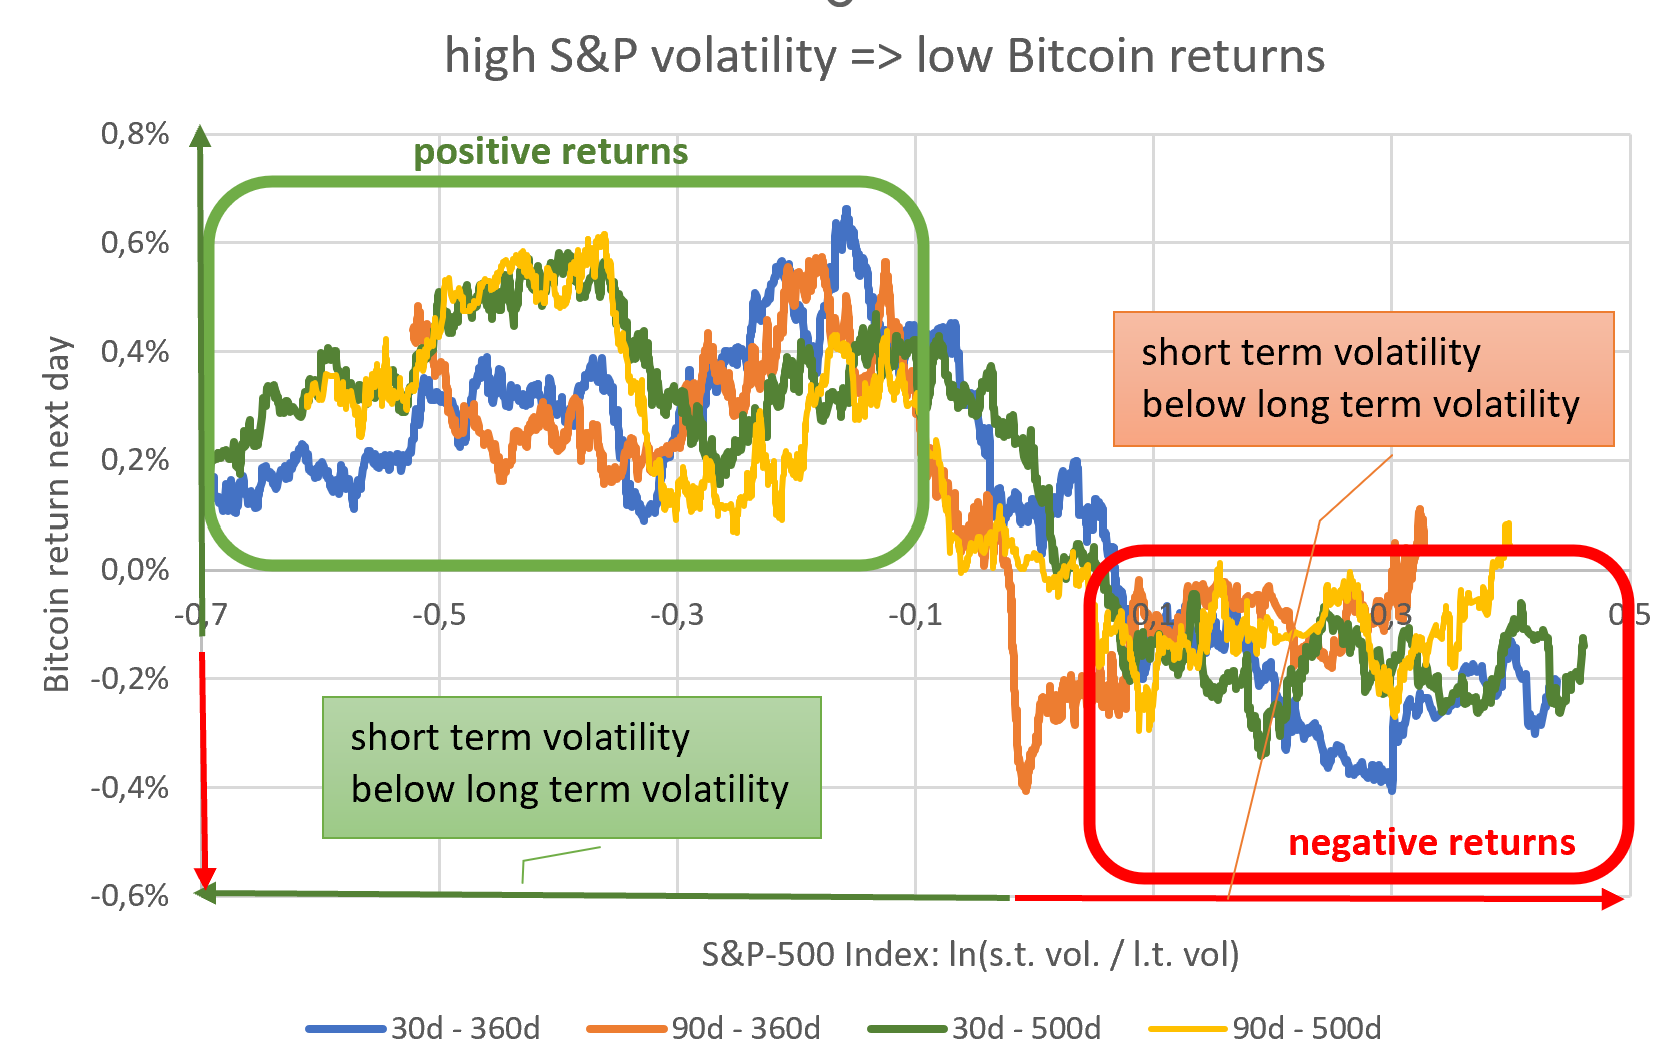 Chart description: Chart description: We can plot the relative short-term to long-term volatility of the S&P on the x-axis. We can then plot the expected daily price return on Bitcoin on the y-axis. To average out the noise, I have calculated 500 day averages of 250 data points with worse higher volatility and 250 data points with lower volatility. Interpretation: High S&P volatility gives you negative bitcoin returns the following day. Low volatility gives you positive bitcoin returns the next day. The positive Bitcoin returns are quite stable between -0.7 (very low volatility) and -0.1 (moderately low volatility). It is also stable no matter how we measure our volatility (30d/90d/360d/500d). Why do we like stable results? Stable results in the past are more likely to be stable in the future and are more likely to provide outperformance than a model based on unstable results. An example of unstable results is plotting bitcoin's next-day price returns against bitcoin's own volatility. 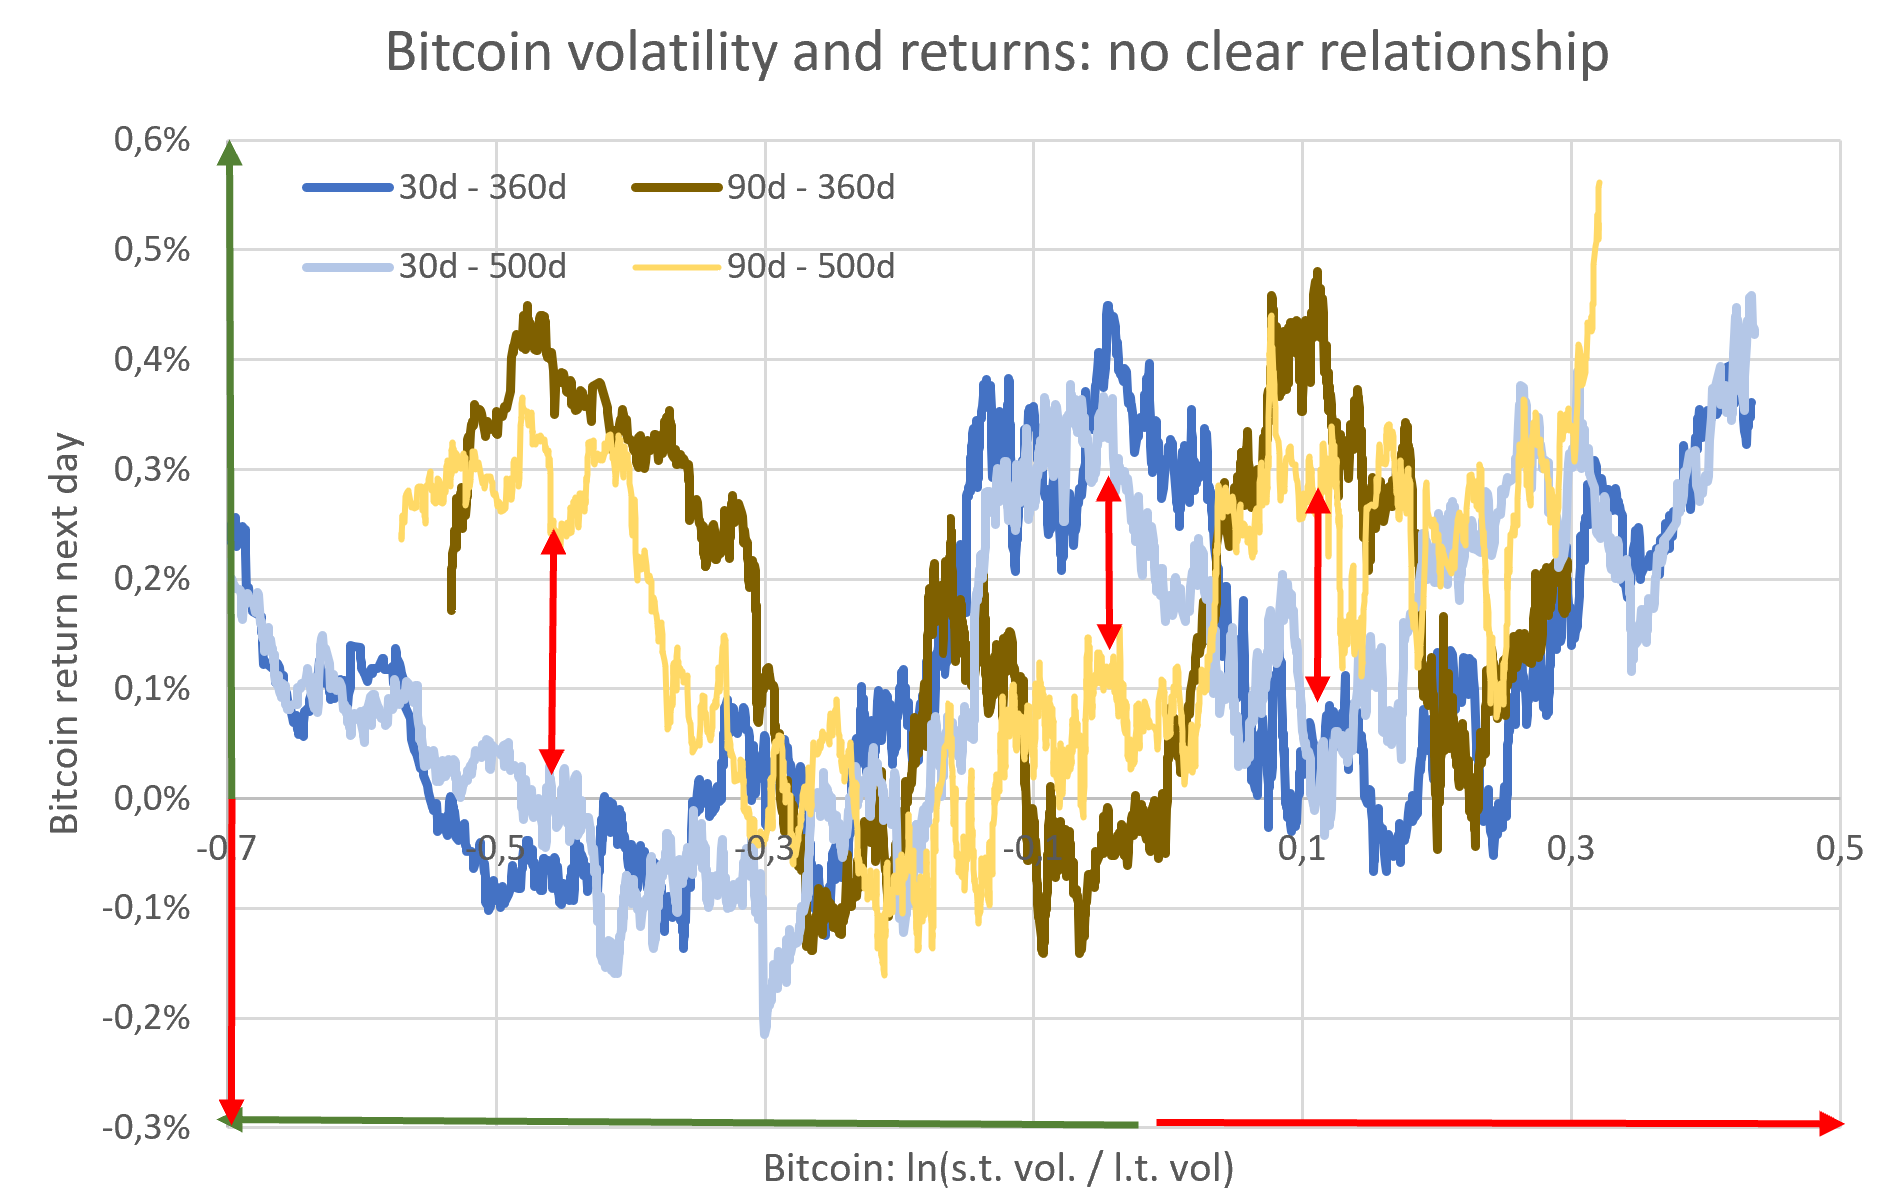 Chart description: Chart description: Same like last chart, except the x-axis representing Bitcoin's own volatility instead of the S&P's volatility. Interpretation: The 30-day results are the opposite of the 90-day results. We also cross the x-axis (which separates positive and negative returns) several times. Both show us low stability when estimating bitcoin retrurns from bitcoin volatility. Estimating bitcoin returns from S&P volatility is much more fruitful than estimating bitcoin returns from bitcoin volatility. Choosing the volatility measure an the cut-off: We have seen that there is little difference in the choice (30 days or 90 days and 360 days and 500 days) to measure our relative S&P volatility. I don't like to trade, so for similar out-performance I prefer the model with the least number of trading signals, which would be 90 days volatility versus 500 days volatility. Because of evidence #2, I use a cut-off point of -0.1. This means that our signal becomes bullish when the S&P 90-day volatility is slightly below the 500-day volatility: Chart description: see evidence #1 Interpretation: We can see that most signals look decent, but we have one very harmful signal (red cycle) in recent years. At the end of 2018, we had a period of very positive bitcoin performance despite high S&P volatility. evidence #3How good is our volatility signal?  Chart description: Chart description: I draw a line starting on the first day after the low volatility period begins. Each line is described with its first day. The line stops at the end of the low volatility period. The x-axis represents the number of days in low volatility market conditions. The y-axis show how much Bitcoin price increased sind day 0. Green lines represent very good Bitcoin performances. Yellow lines represent ok performances. The black line represents the average of all other lines. Interpretation: For most of the low volatility periods we can see very decent returns for the bitcoin price. The worst period gives us a return of around 0, while the best period gives us a return of around 2 (=638%). Periods of high volatility generally show poor returns, with some exceptions showing positive returns. I can conclude that trading bitcoin according to the S&P volatility looks very promising. However, some risk remains. We are quite safe buying bitcoin when stocks enter a period of low volatility. 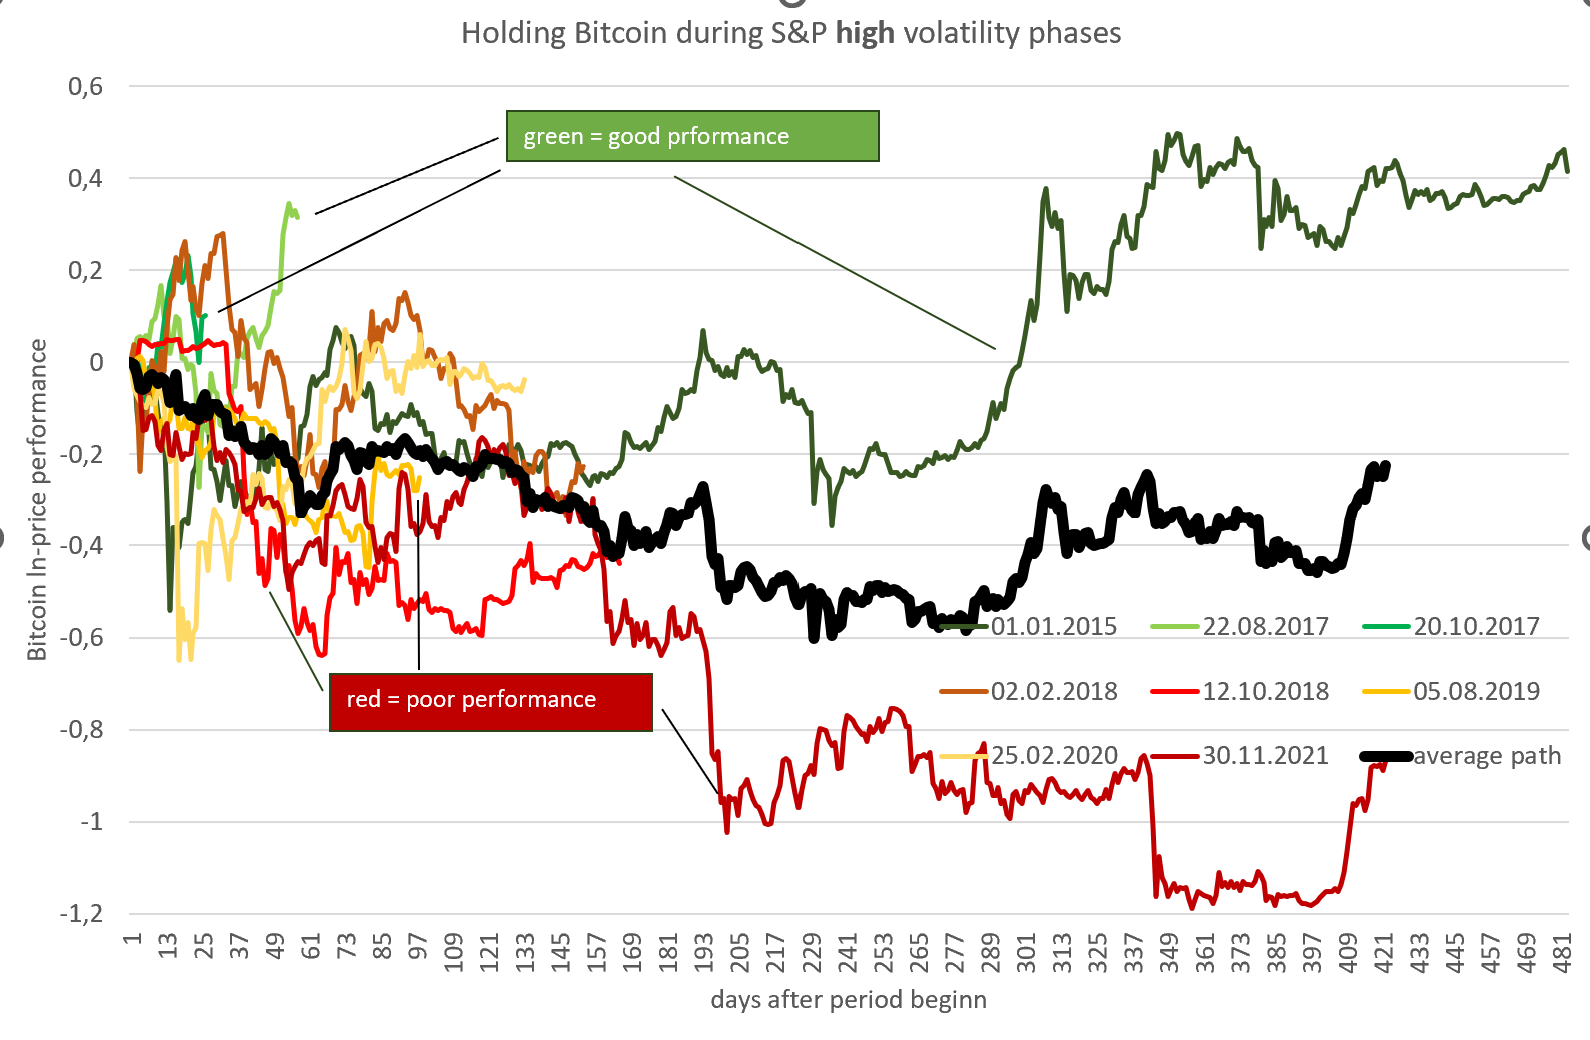 Chart description: Chart description: Same like above, but we are looking at the performance for the high volatility periods. Interpretation: Selling bitcoin when we enter a high volatility period for stocks is a bit riskier than buying at the beginning of low volatility periods. Sometimes the price of bitcoin still performs well and we have to buy back more expensive. Now we have established 3 pieces of evidence to show that Bitcoin performs much better during periods of low S&P volatility than during periods of high S&P volatility. However our volatility signal is not perfect.
How damaging are our few bad signals? Let's do a backtest.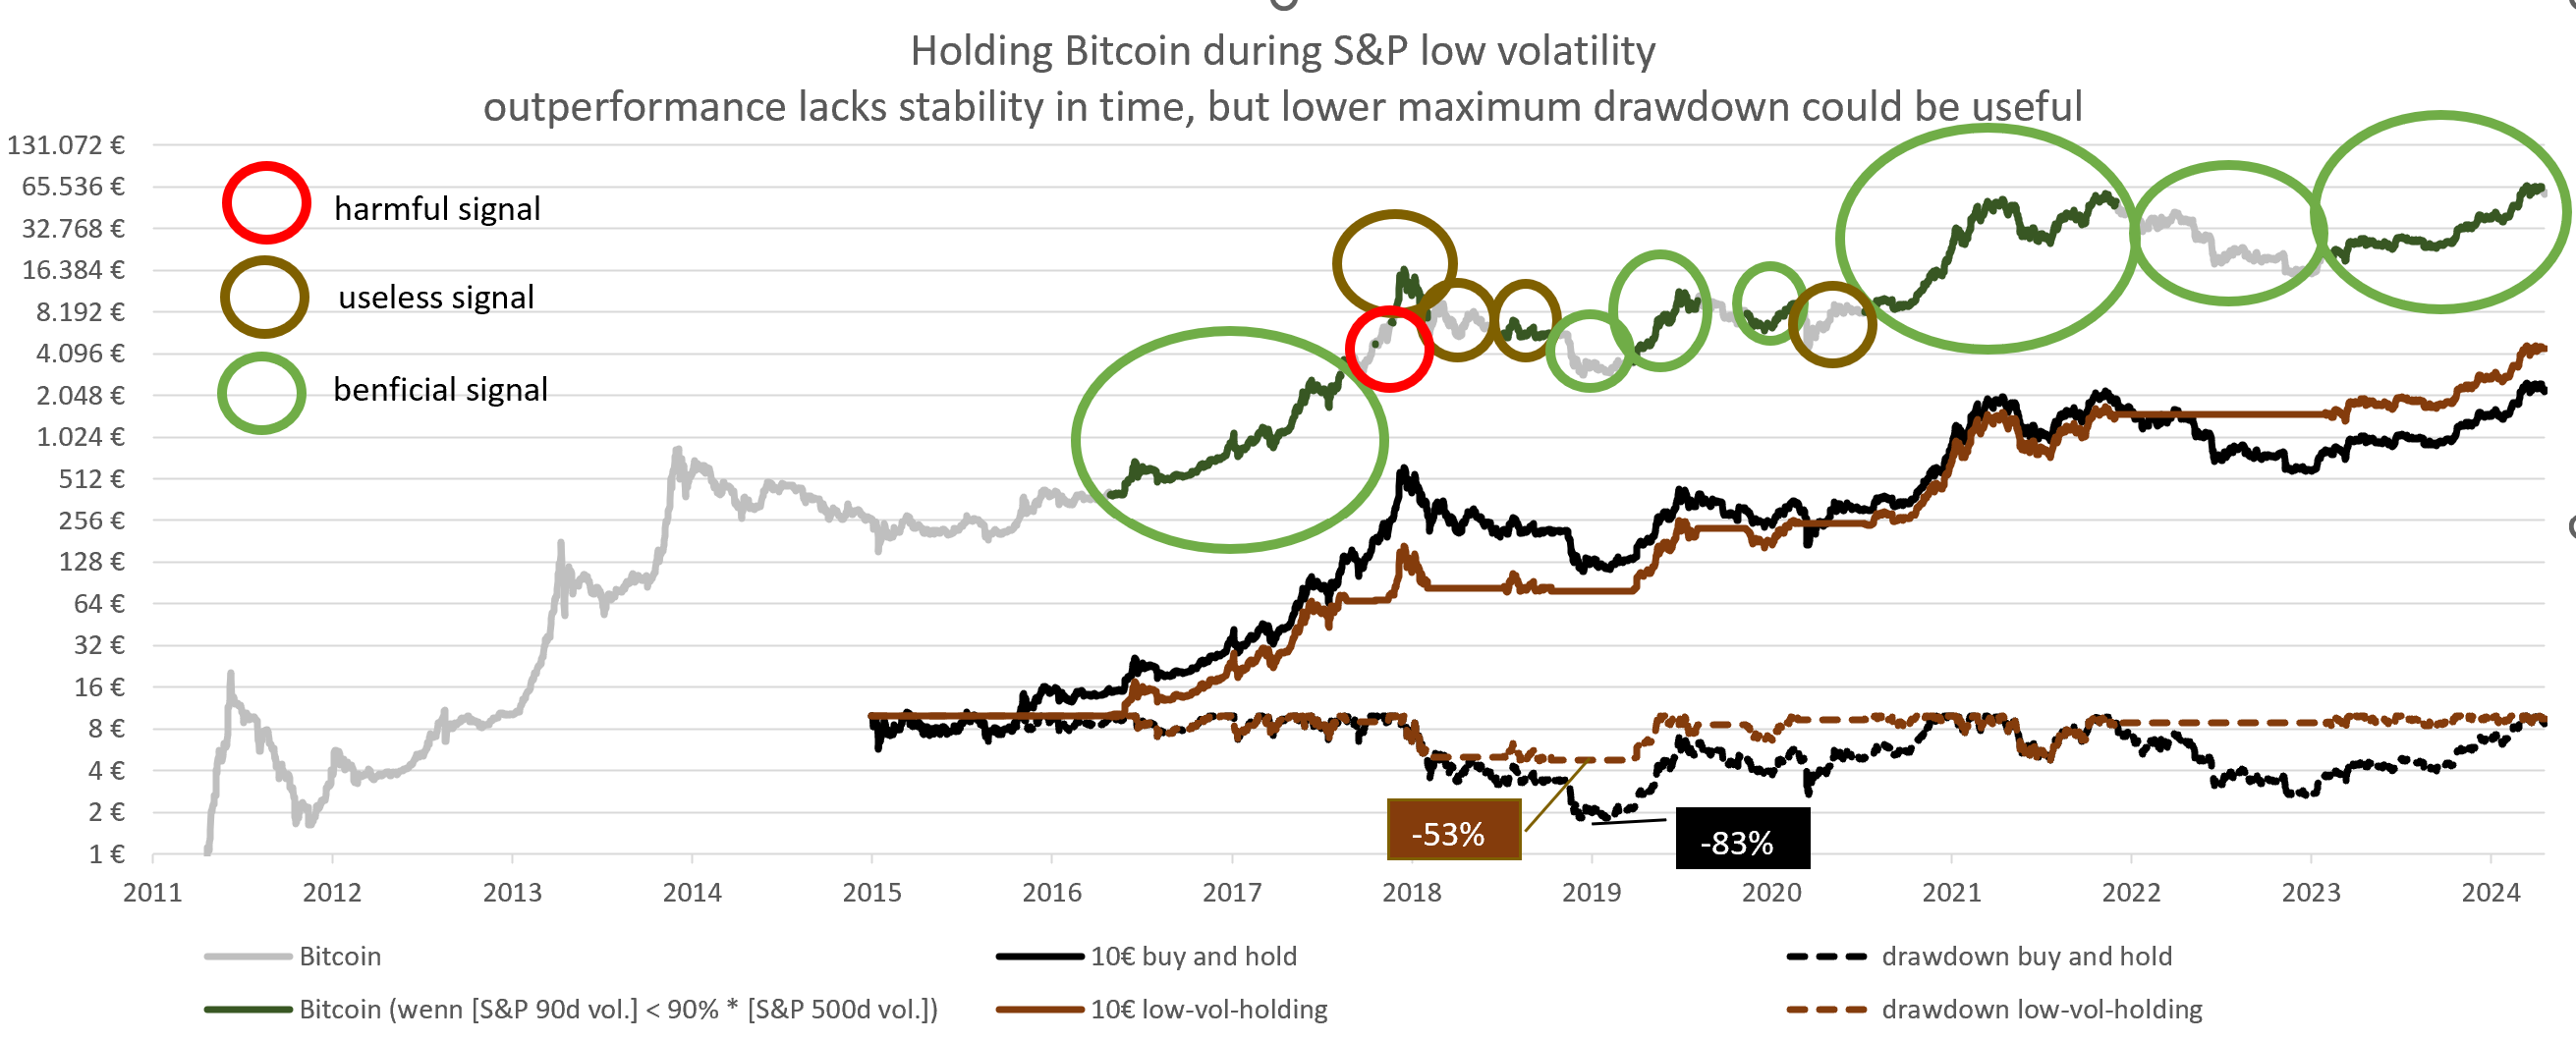 Chart description: Chart description: We compare two strategies: 1. (black line): We buy 10 of Bitcoin on 01/01/2005 and hold it until today. 2. (brown line): We start with 10. We hold bitcoin during periods of low volatility and cash during periods of high volatility. Interpretation: We can see that we start with some underperformance (brown line is blowing black line) which turns into outperformance later on. Perhaps Bitcoin is now trading with a higher correlation to traditional financial markets than in the past. I would say that the observed outperformance of our strategy alone is a bit weak, as we can also observe historical periods of underperformance. Together with the significantly lower drawdown of our strategy (-53% vs. -83% for buy and hold), the strategy is still okay. If you dislike drawdowns, the significant reduction in maximum drawdown could make this strategy still interesting despite the mixed outperformance track record. Comparison with cycle timing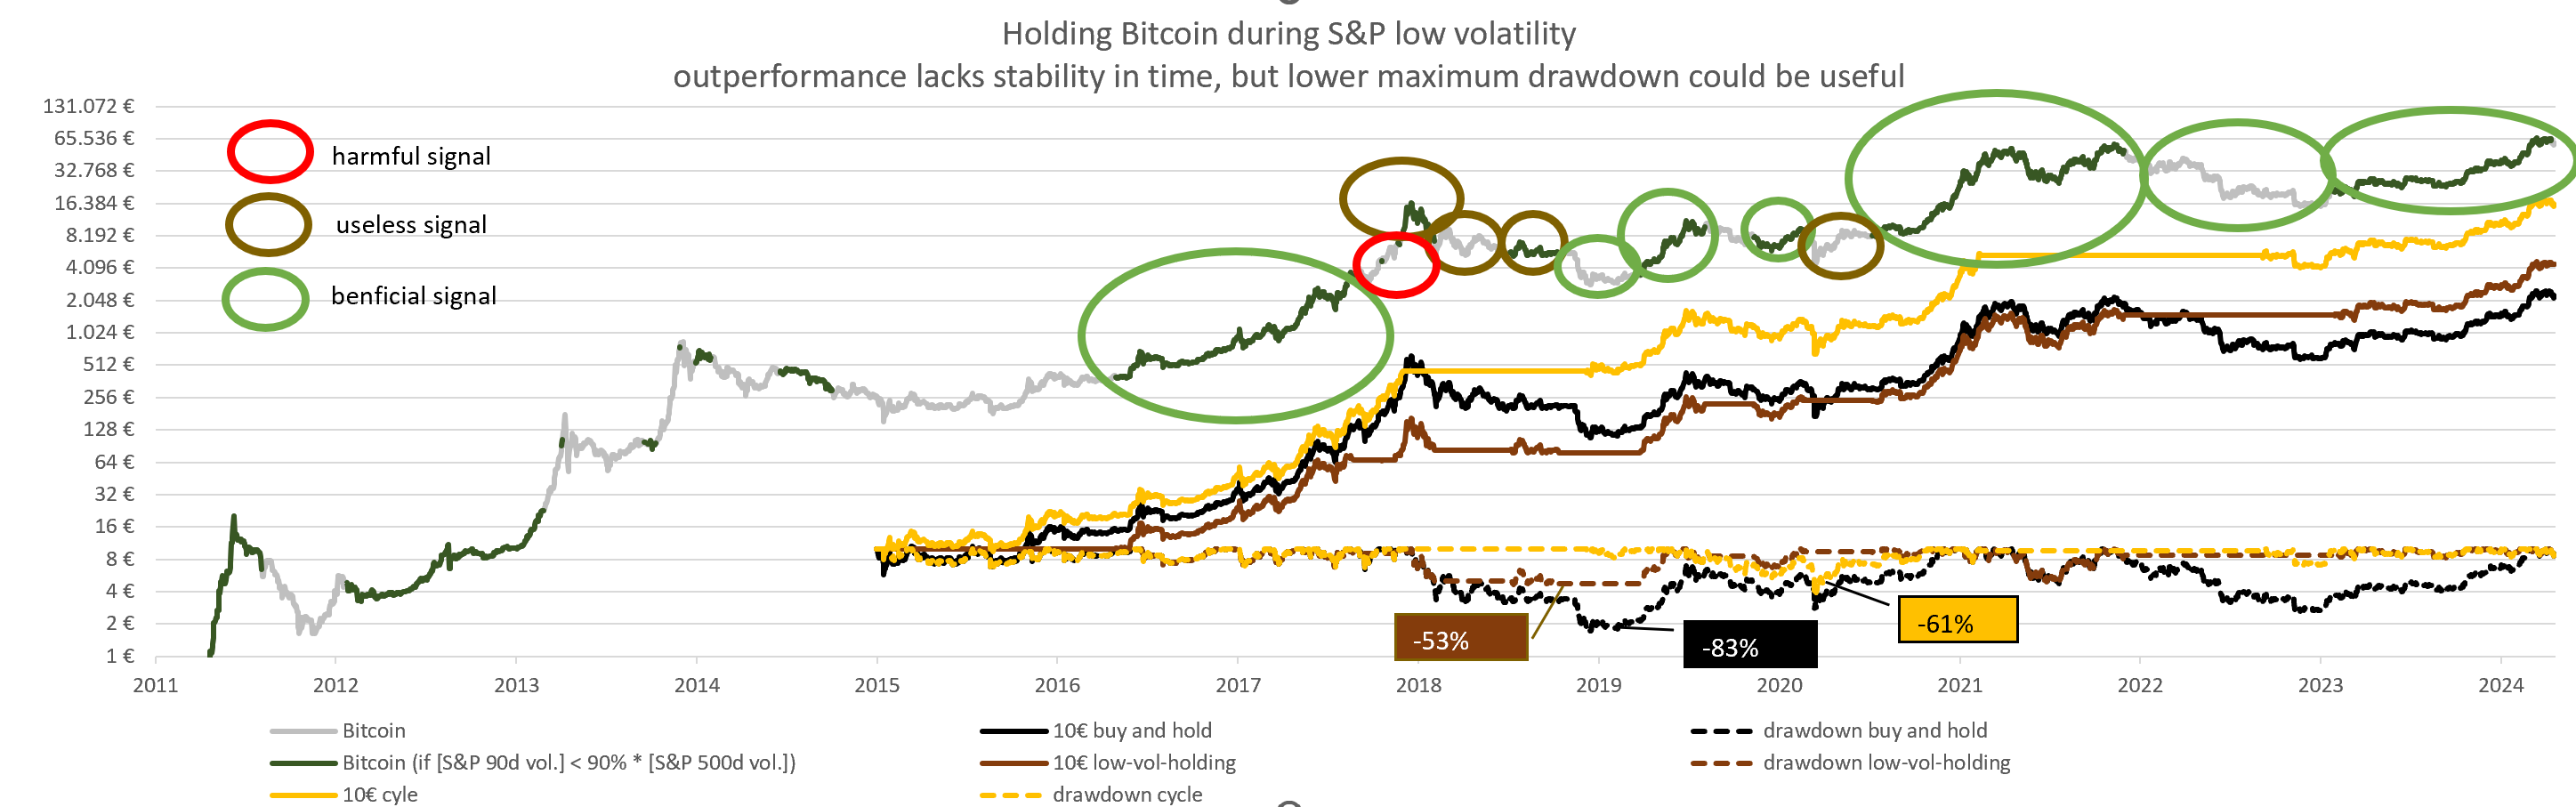 Chart description: Chart description: We add one more strategy (yellow line): Buy Bitcoin at trend*e⁻0.5 and sell Bitcoin at trend+750 days. Interpretation: When we back-test our valuation trigger for trading Bitcoin in the OP, we get even better results (yellow line). We can see significant outperformance, hardly any underperformance and only a slightly worse drawdown. 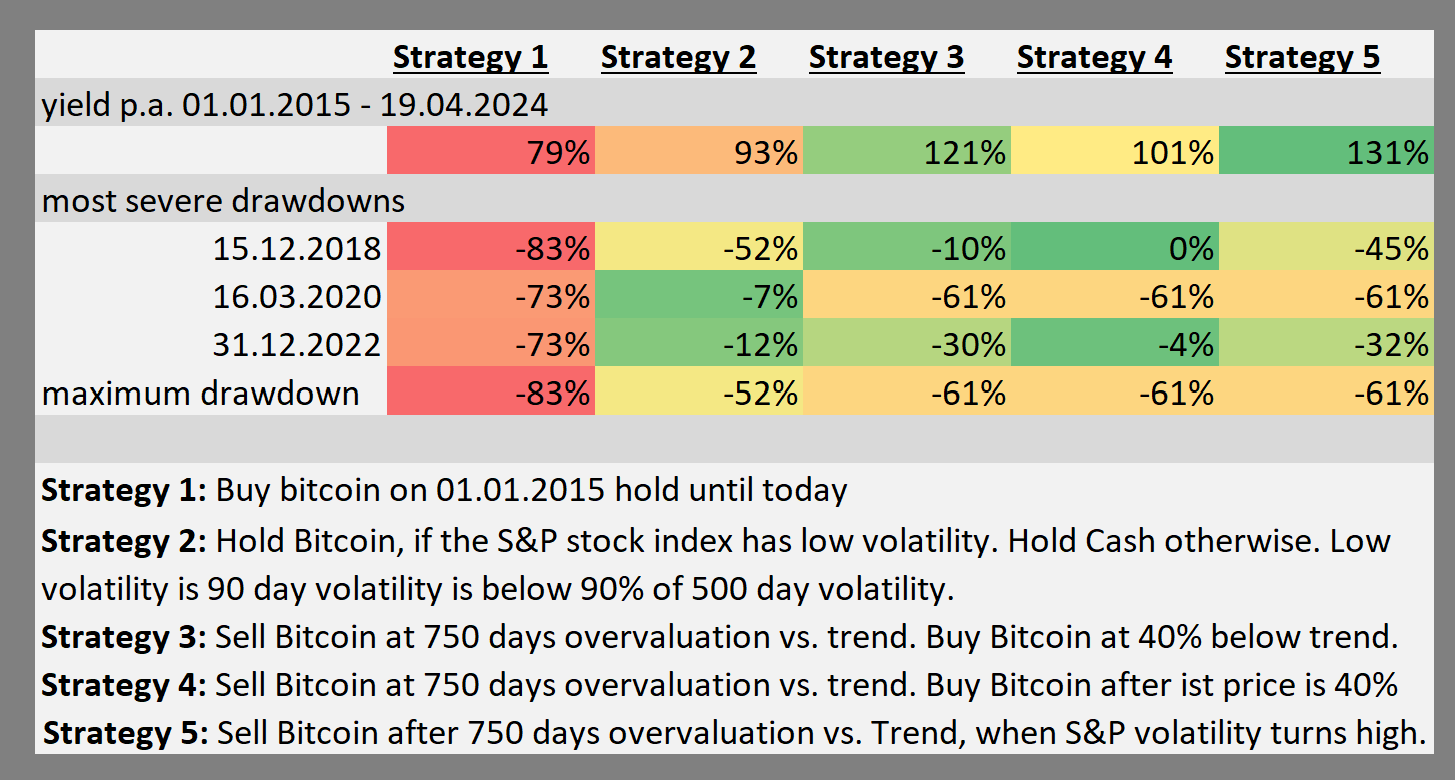 Results: Results: Both strategies, trading by volatility (strategy 2) and trading by valuation (strategy 3), outperform buy and hold (strategy 1) before tax with higher average returns and lower drawdowns. However, strategy 3, as explained in the OP, performs much better. Can combine two good strategies (2 and 3) to get an even better trading strategy?We know that buying Bitcoin cheap gives us outperformance (strategy 3). We also know that Buying bitcoin during a period of low volatility gives us outperformance (strategy 2). 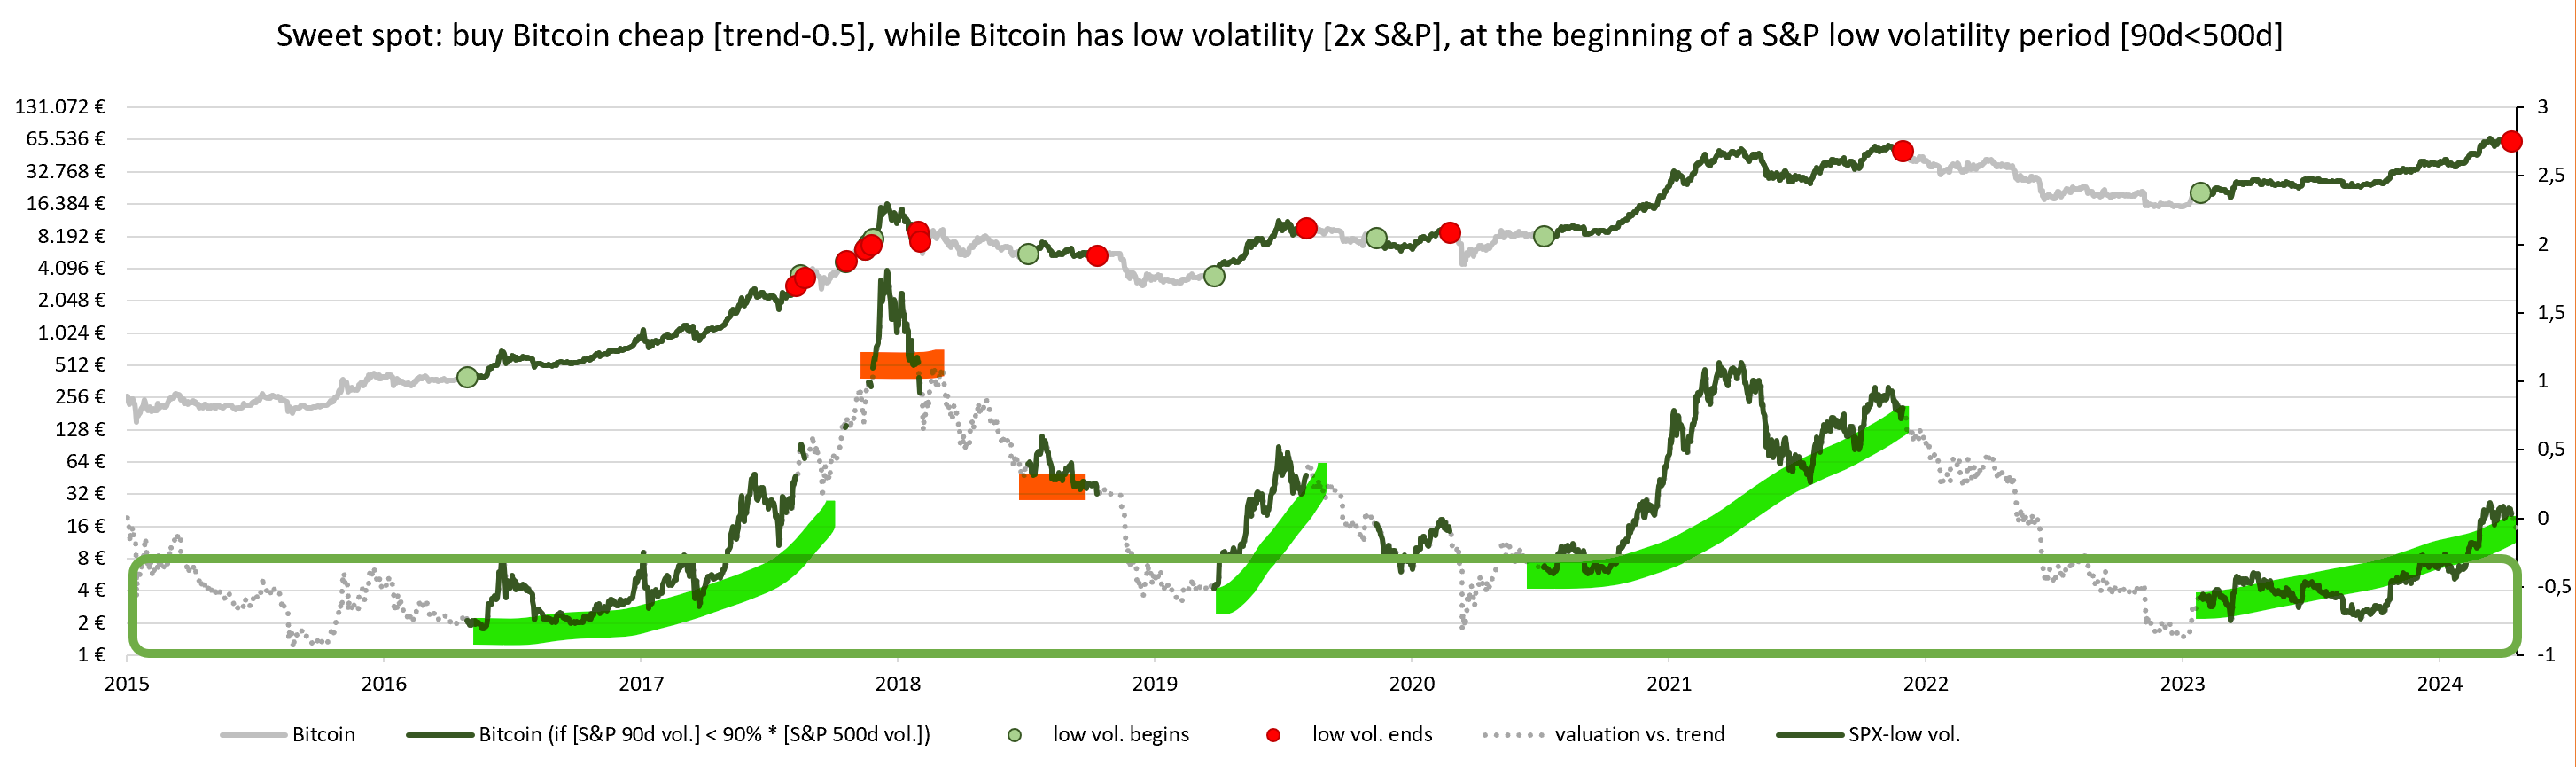 Buying bitcoin cheap (green box) and entering a period of low volatility (green line) could be an excellent investment, as all green lines end up much higher than they started (marked in green), while the less useful green lines (marked in red) are not included. This idea sounds good, but waiting for (a) valuation and (b) volatility to turn favorable (strategy 4) gives us a lower return (101% p.a.) than only waiting for (a) valuation to turn favorable (121%). We are missing out on returns by sitting in cash while waiting for volatility to come down. While waiting for volatility to come down may not be a good quantitative strategy, it could still be useful from a psychological perspective. If you didn't buy enough Bitcoin during the bear market, because you were scared, but the volatility didn't turn favorable, it could give you the confirmation to buy. At this point, we are still very early in the bear market. The second combination possibility would be strategy 5: 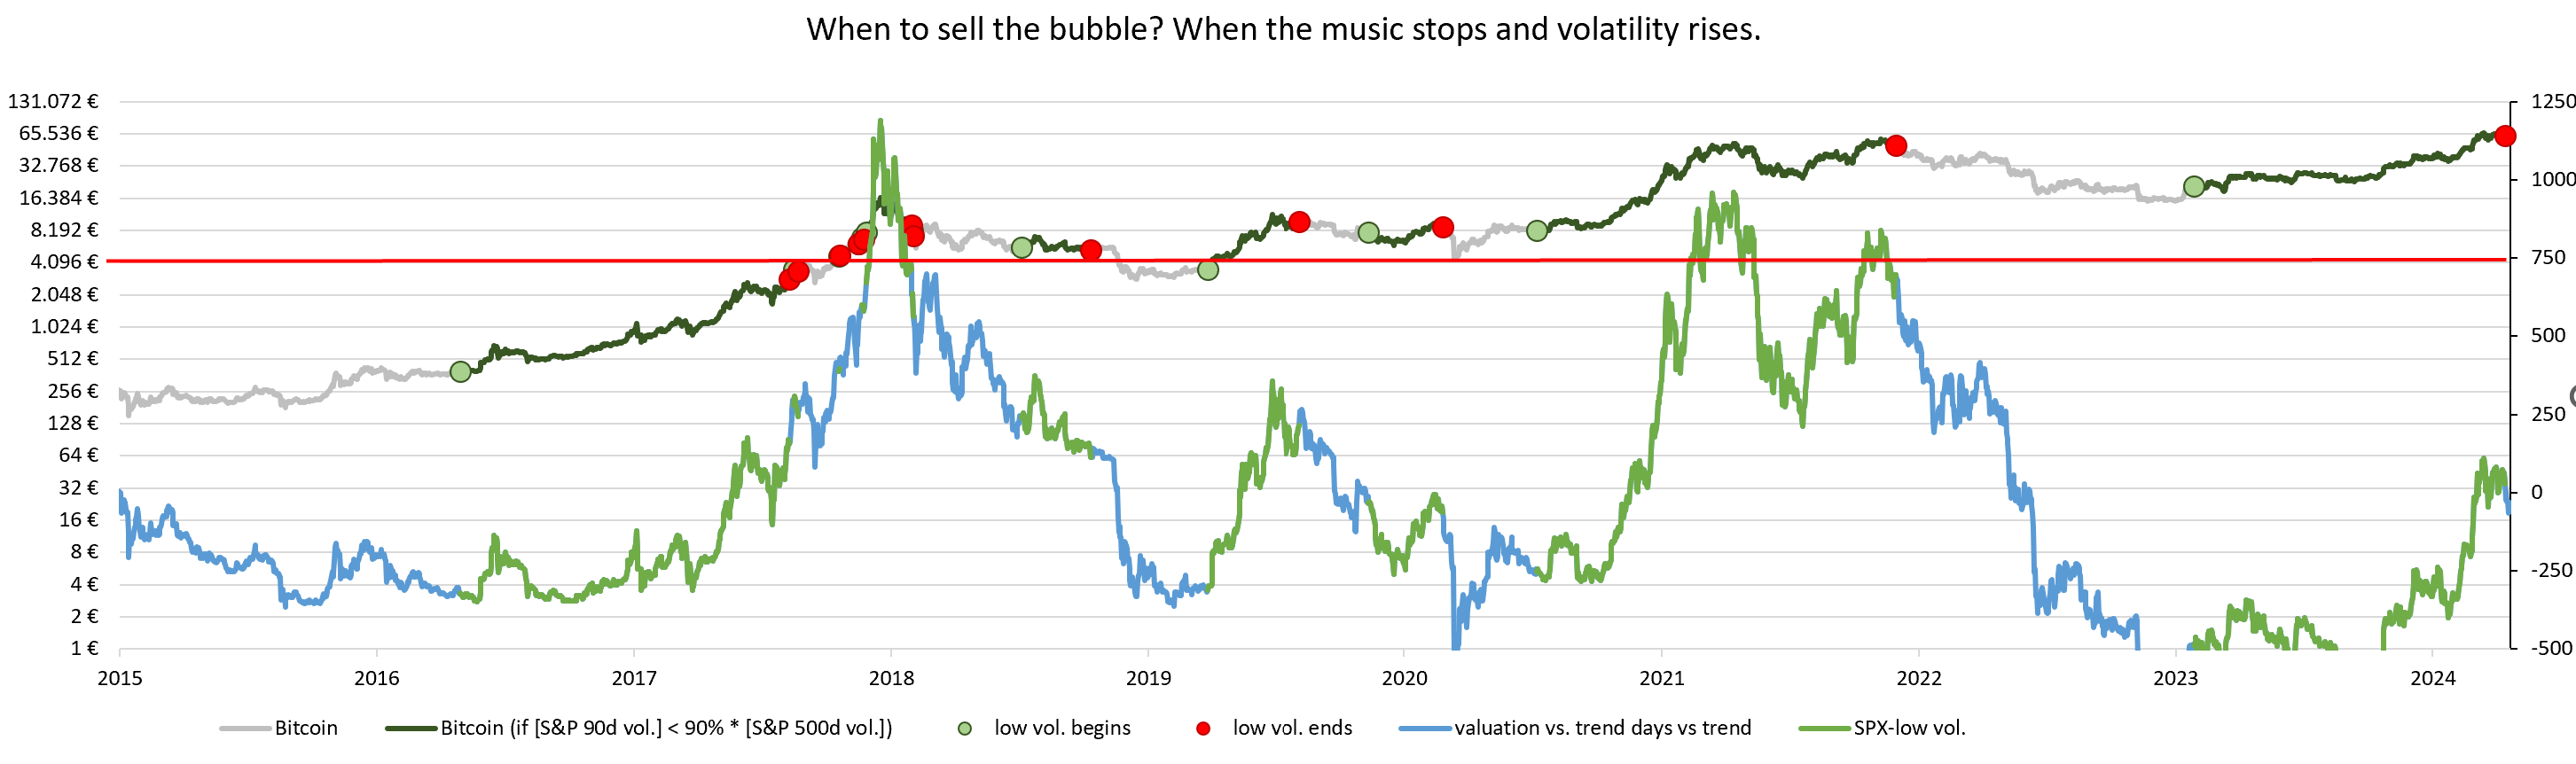 Strategy 3: We are selling at an overvaluation (Bitcoin price = Bitcoin price trend + 750 days). However, the historical top was around +1000 days or even +1250 days. I still use the 750 days cut-off point in my strategy 3 because we only know the exact top in hindsight. I want to allow for some margin of error to not miss the top in case the next top is lower. Strategy 5 modifies strategy 3: We could wait for bitcoin to reach trend + 750 days overvaluation and only sell when the volatility trigger turns red (= entering a period of high volatility). This strategy 5 gives us an even better return (131% p.a.) than pure cycle timing (121%) with similar drawdowns. However, despite the higher average return, I still prefer pure cycle timing (strategy 3) because we sell a bit before the peak rather than a bit after the peak. Since in real life we will need some time to sell, I would rather start too early than too late. Valuation leads to action, volatility is confirmationWe buy when Bitcoin is 40% below trend. Entering the next period of low volatility in equities is likely to mark the end of the bottom. We sell when Bitcoin price is 750 days ahead of trend. The subsequent entry of a period of high volatility marks the end of the top.
Let me give you an idea for such a DCA savings plan for accumulation between trend line (0.0) and bottom line (-1.0) with a stack of 5 limit orders (simplified regarding of the previous bear market):
I also thought about how to use our position in the cycle to modify my DCA strategy. Background: I changed my model for calculation the optimal allocation into Bitcoin from adjusted risk parity (=old model) to maximum allocation after taking into account liquidity constraints (= new model). As a result I have to sell a lot of stocks (e.g. 15.000 ) to buy more Bitcoin. However I'm already exposed to Bitcoin since end of 2021. I create 3 baskets:- very cheap basket (trend * e^-0.5): 5.000 - cheap basket (below trend): 5.000 - ok basket (trend to trend + 150 days): 5.000 Investment decision triggers:❶ If Bitcoin price is below trend*e^-0.5, I will invest all my remaining funds into Bitcoin. This would be 15.000 as of today. ❷ If Bitcoin price is above trend*e^-0.5, but below trend, I will invest 1000 from cheap basket and 1000 from ok basket every month. ❸ If Bitcoin price is above trend, but below trend +150 days, I will invest 1000 from ok basket every month. ❹ If Bitcoin price is above trend + 150 days, but below trend + 750 days, I will DCA surplusses into Bitcoin, but not sell any extra shares. ❺ If Bitcoin price reaches trend +750 days, I will sell Bitcoin. I will sell 3x my monthly net salary each month until we fall below trend + 750 days. All the selling will go 50% to the very cheap basket and 50% to the cheap basket. ❻ On the way down from trend + 750 days to trend I will put my DCA into my 3 baskets and only buy Bitcoin, when Basket rules allow for it. Model maintenance triggers:My DCA management can be easily implemented in excel and does not cause much of a headache or costs a lot of time. However I'm very dependent on my model to continue to describe the Bitcoin price behavior. Therefore I have to check, if my model is still correct. We assume Bitcoin price is moving around a upwards trend. 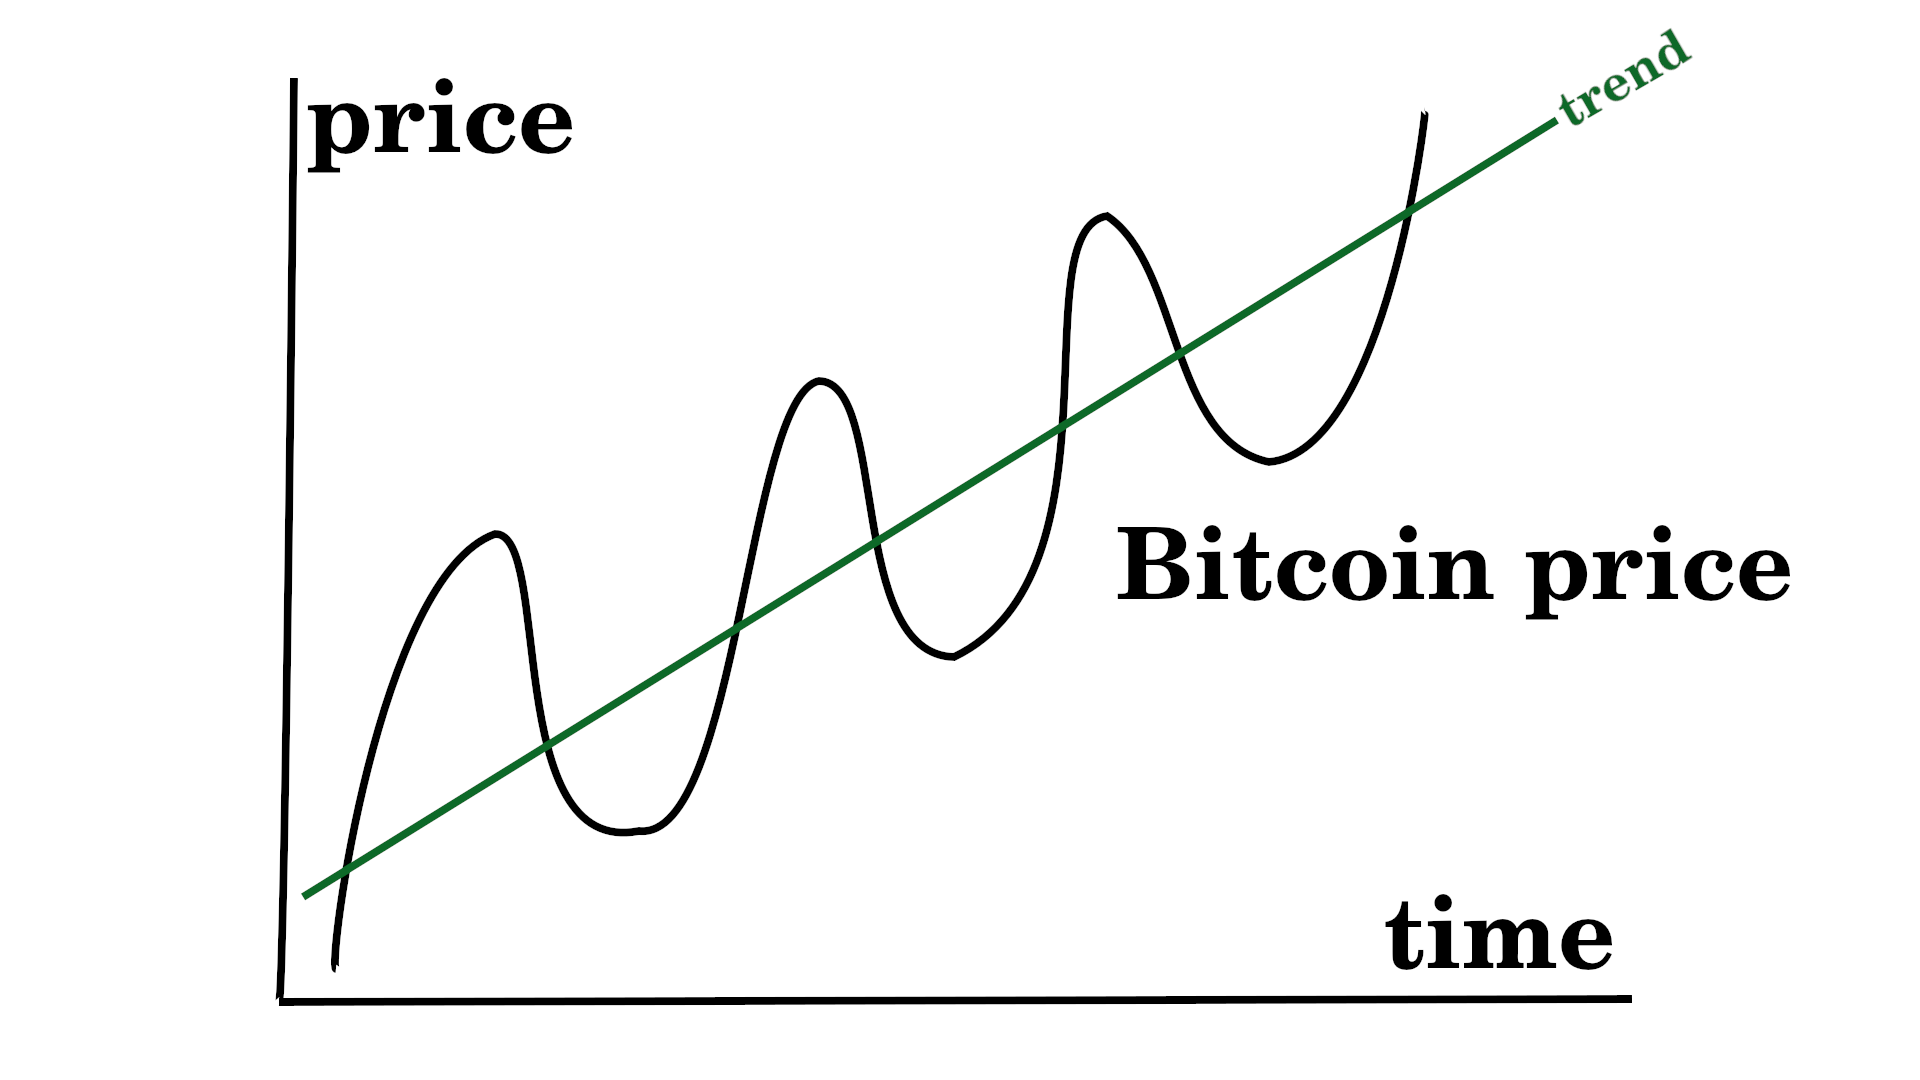 Sometimes Bitcoin price is supported by the macroeconomic environment  ❶ Maintenance trigger "new top found": in theory the trigger looks like this: 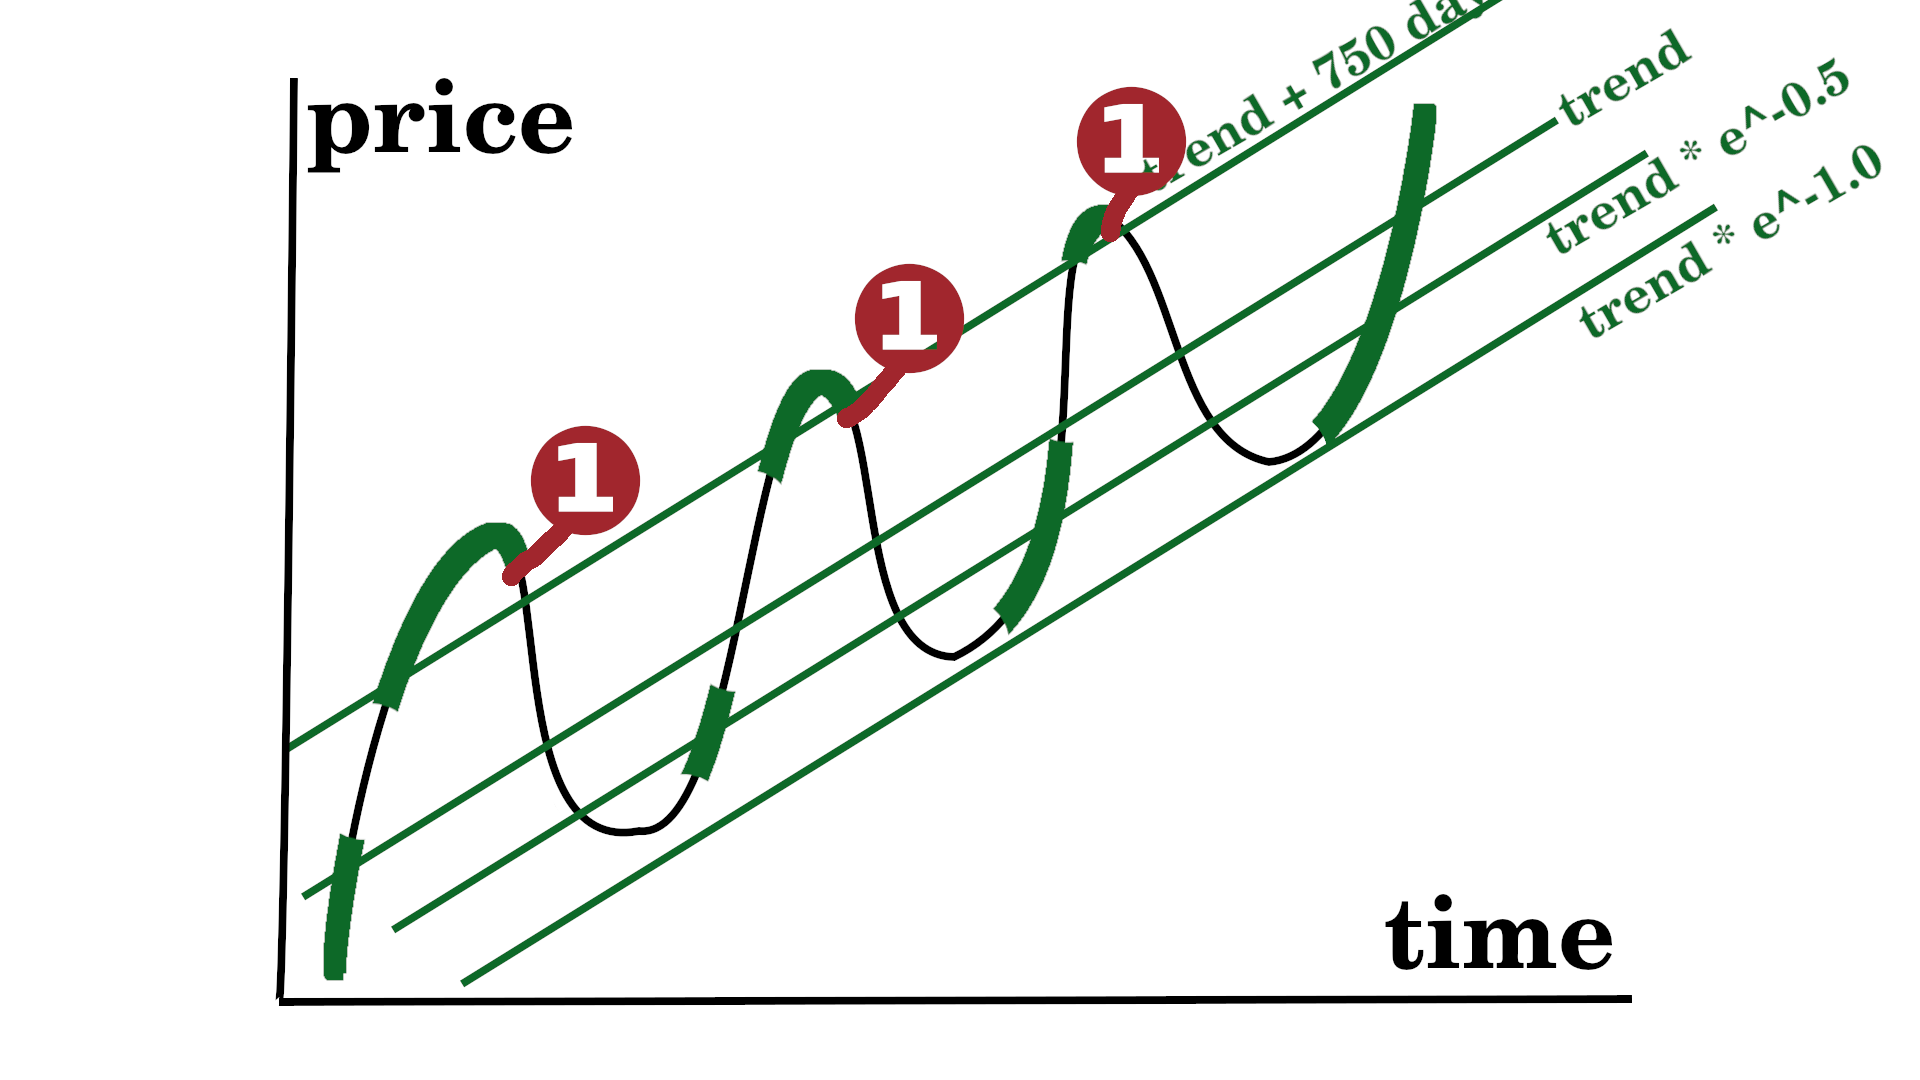 1st trigger: Bitcoin price = trend +750 days 2nd trigger: [Bitcoin price 10% below all time high] and [S&P 90d volatility > S&P 500d volatility] or [Bitcoin price 50% below all time high] I will then check, if the slope is still slightly below 6. 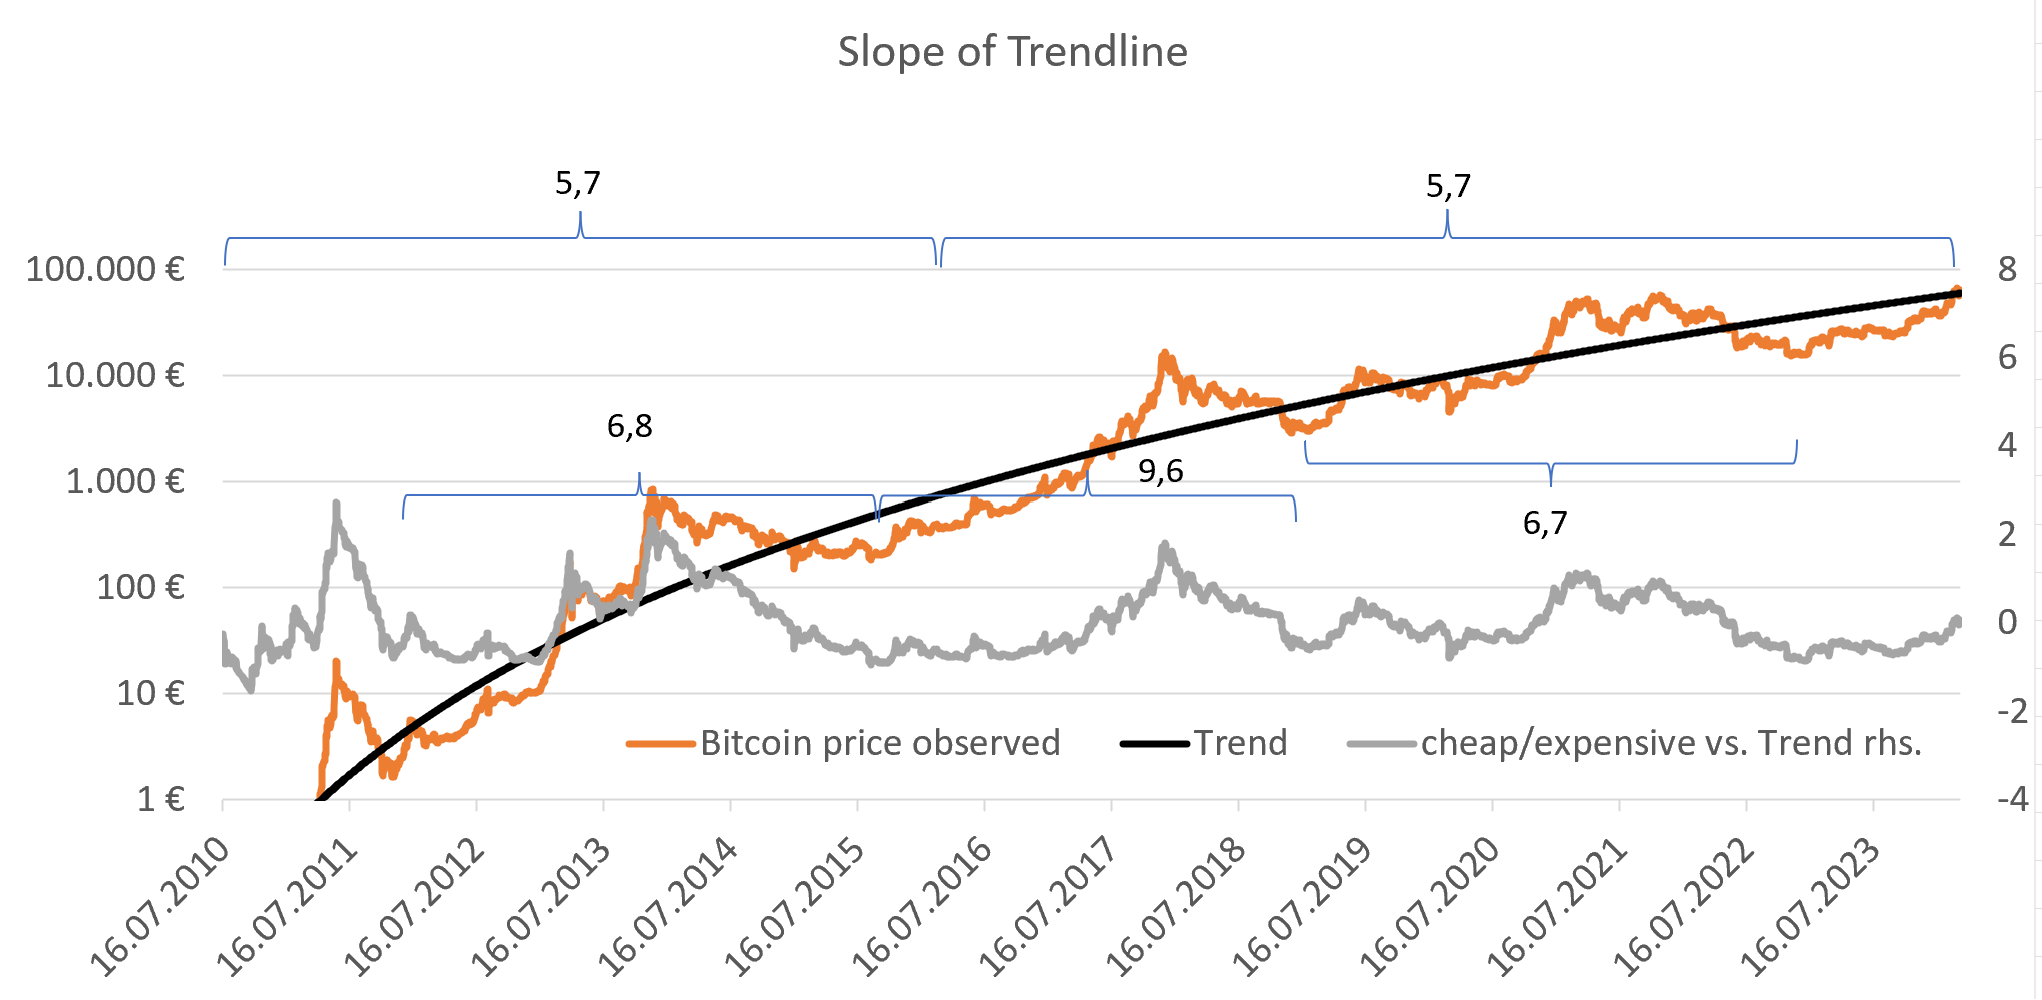 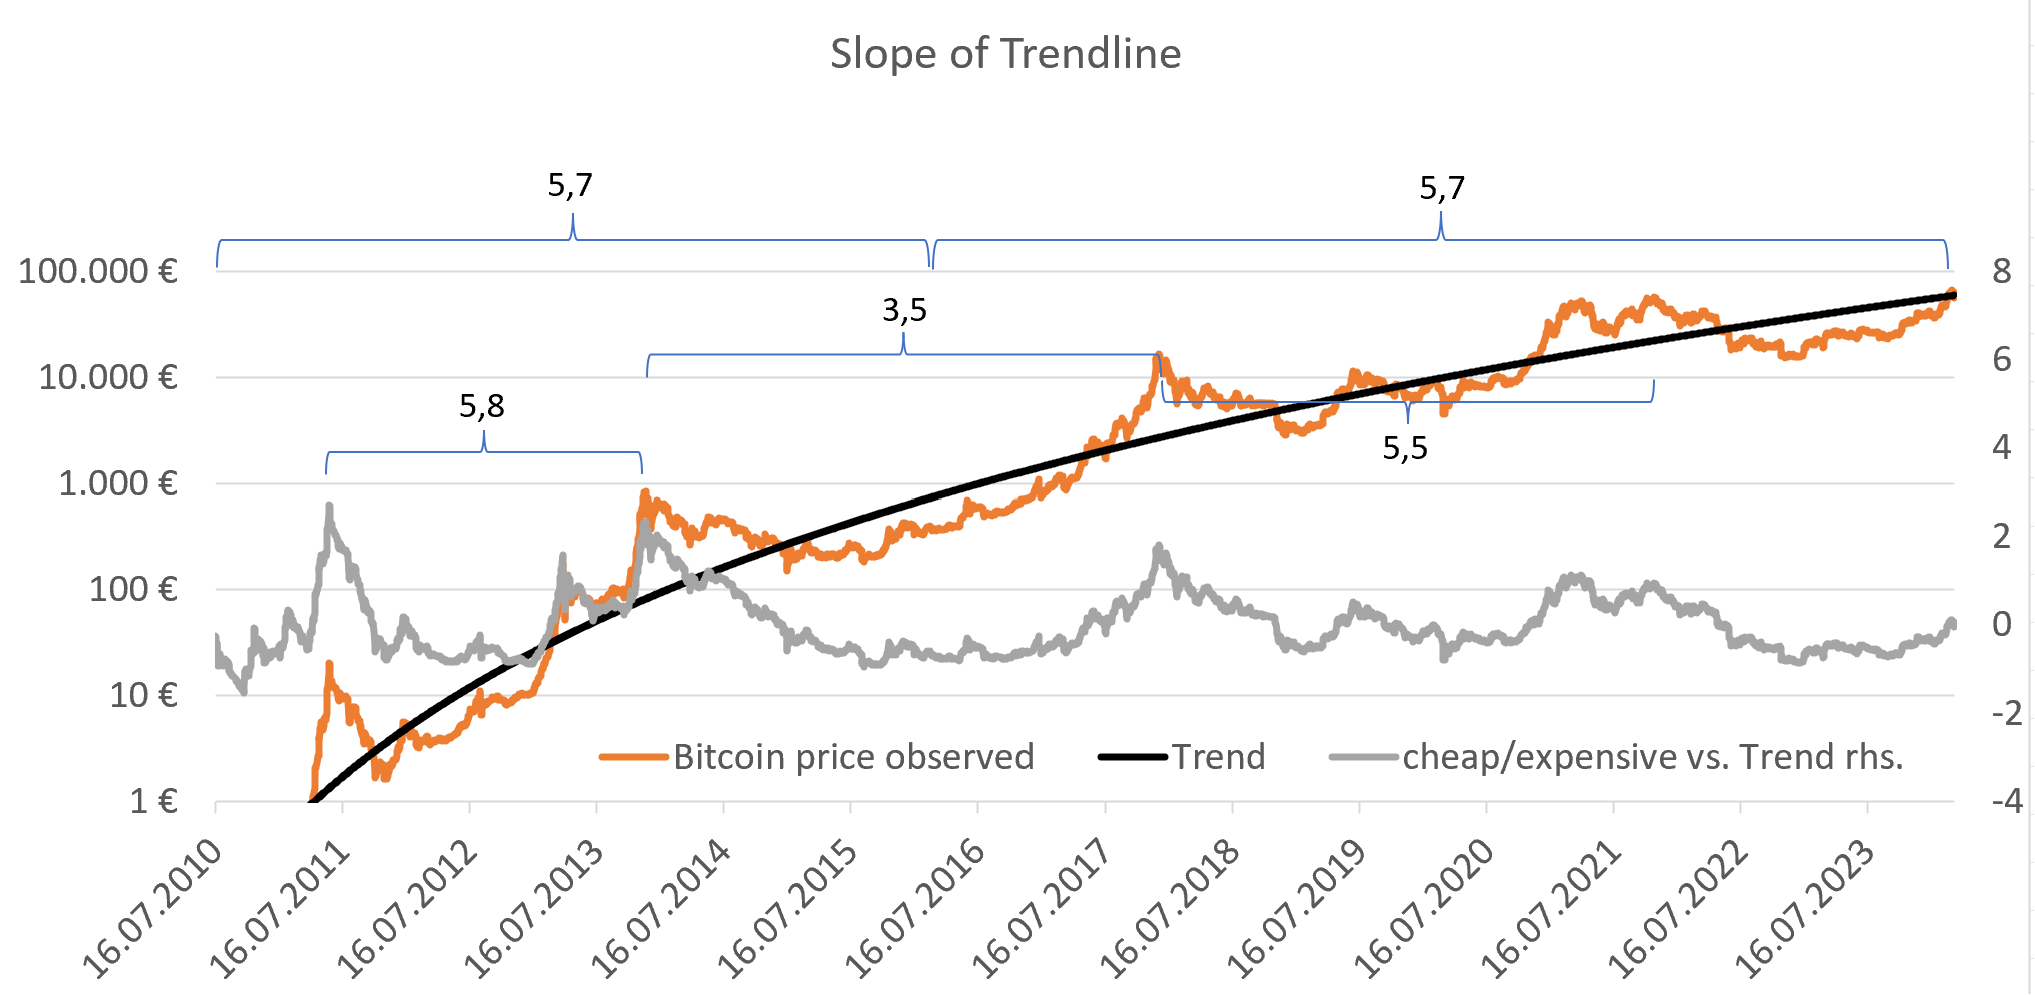 A significantly lower slope would require a new hedonistic optimization to get a new bitcoin allocation (e.g. 50% instead of 66%). I will also check how far above trend the Bitcoin price went, to set a new trading trigger for the next cycle (e.g. 500 days overvaluation instead of 750 days or switiching form days overvaluation to ln overvaluation). ❷ Maintenance trigger "new top missed": 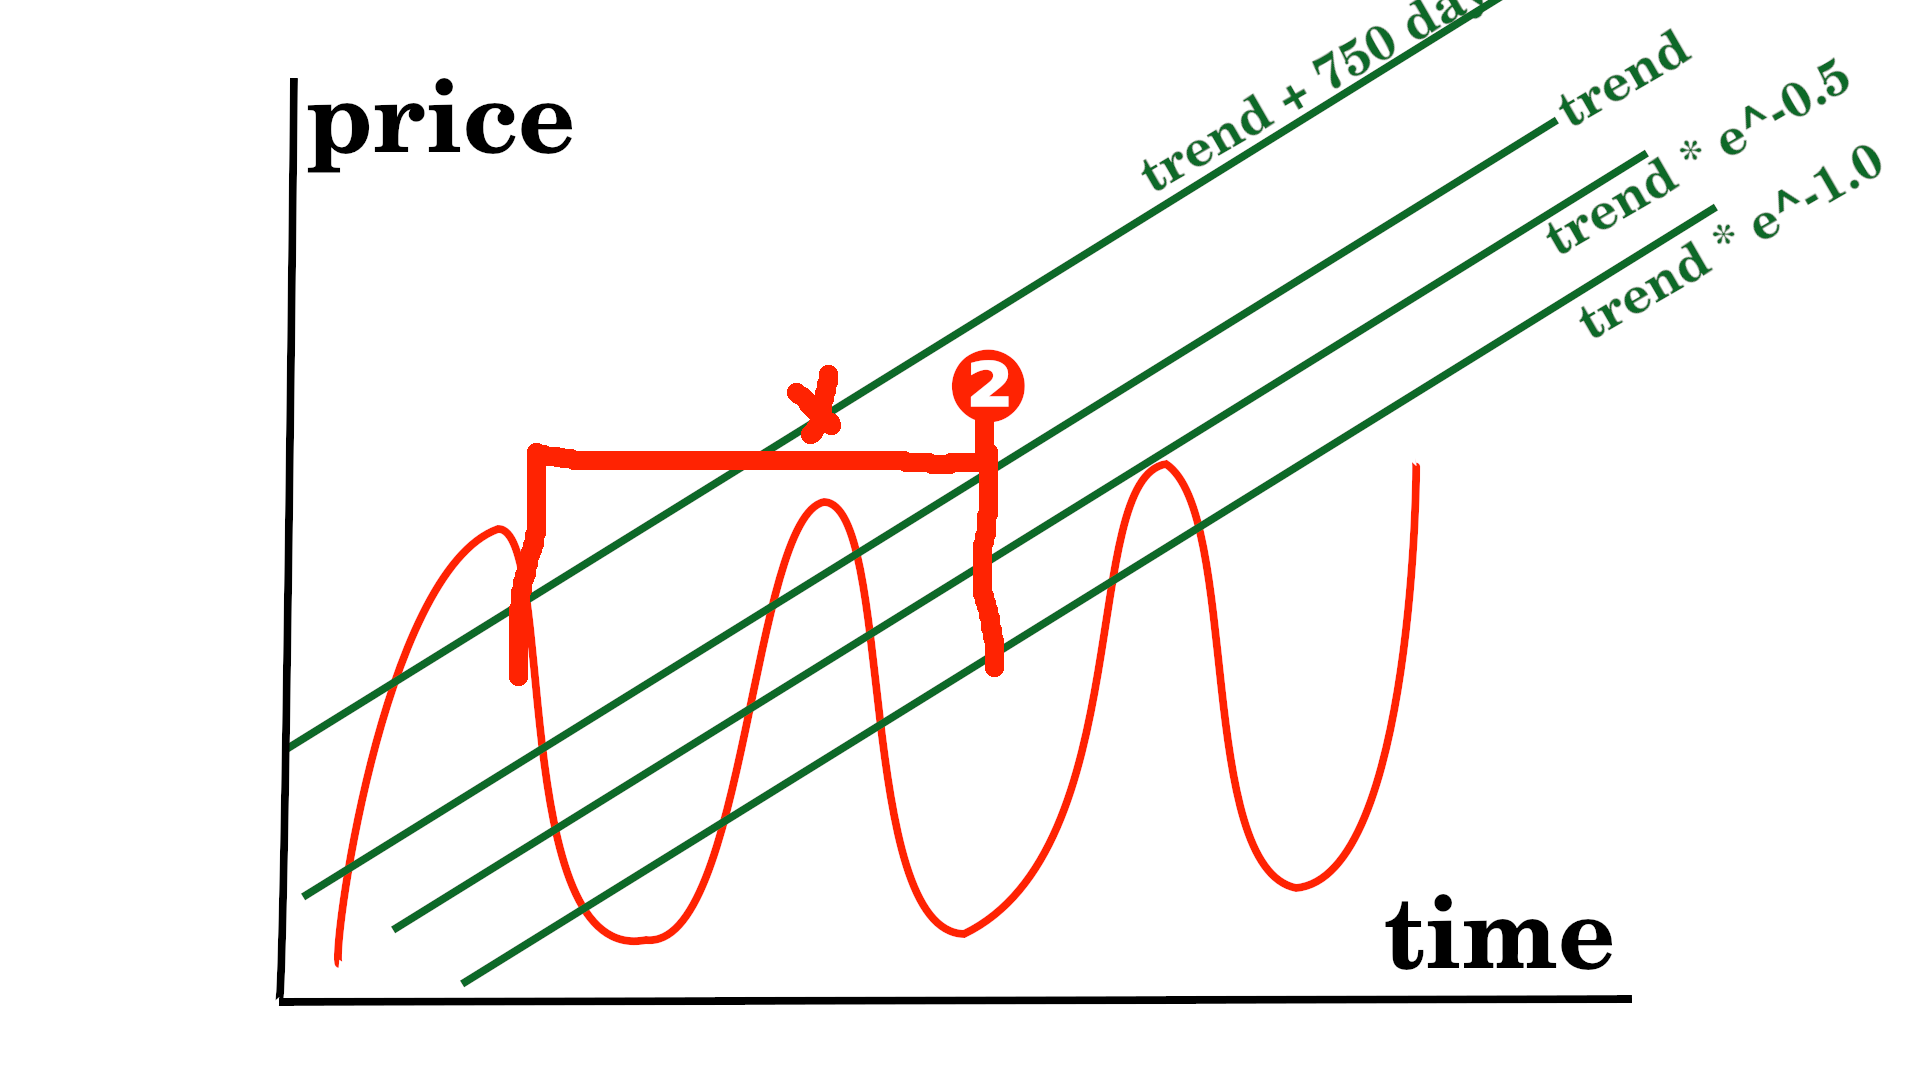 trigger: no euphoria since 1621 or 1677 days 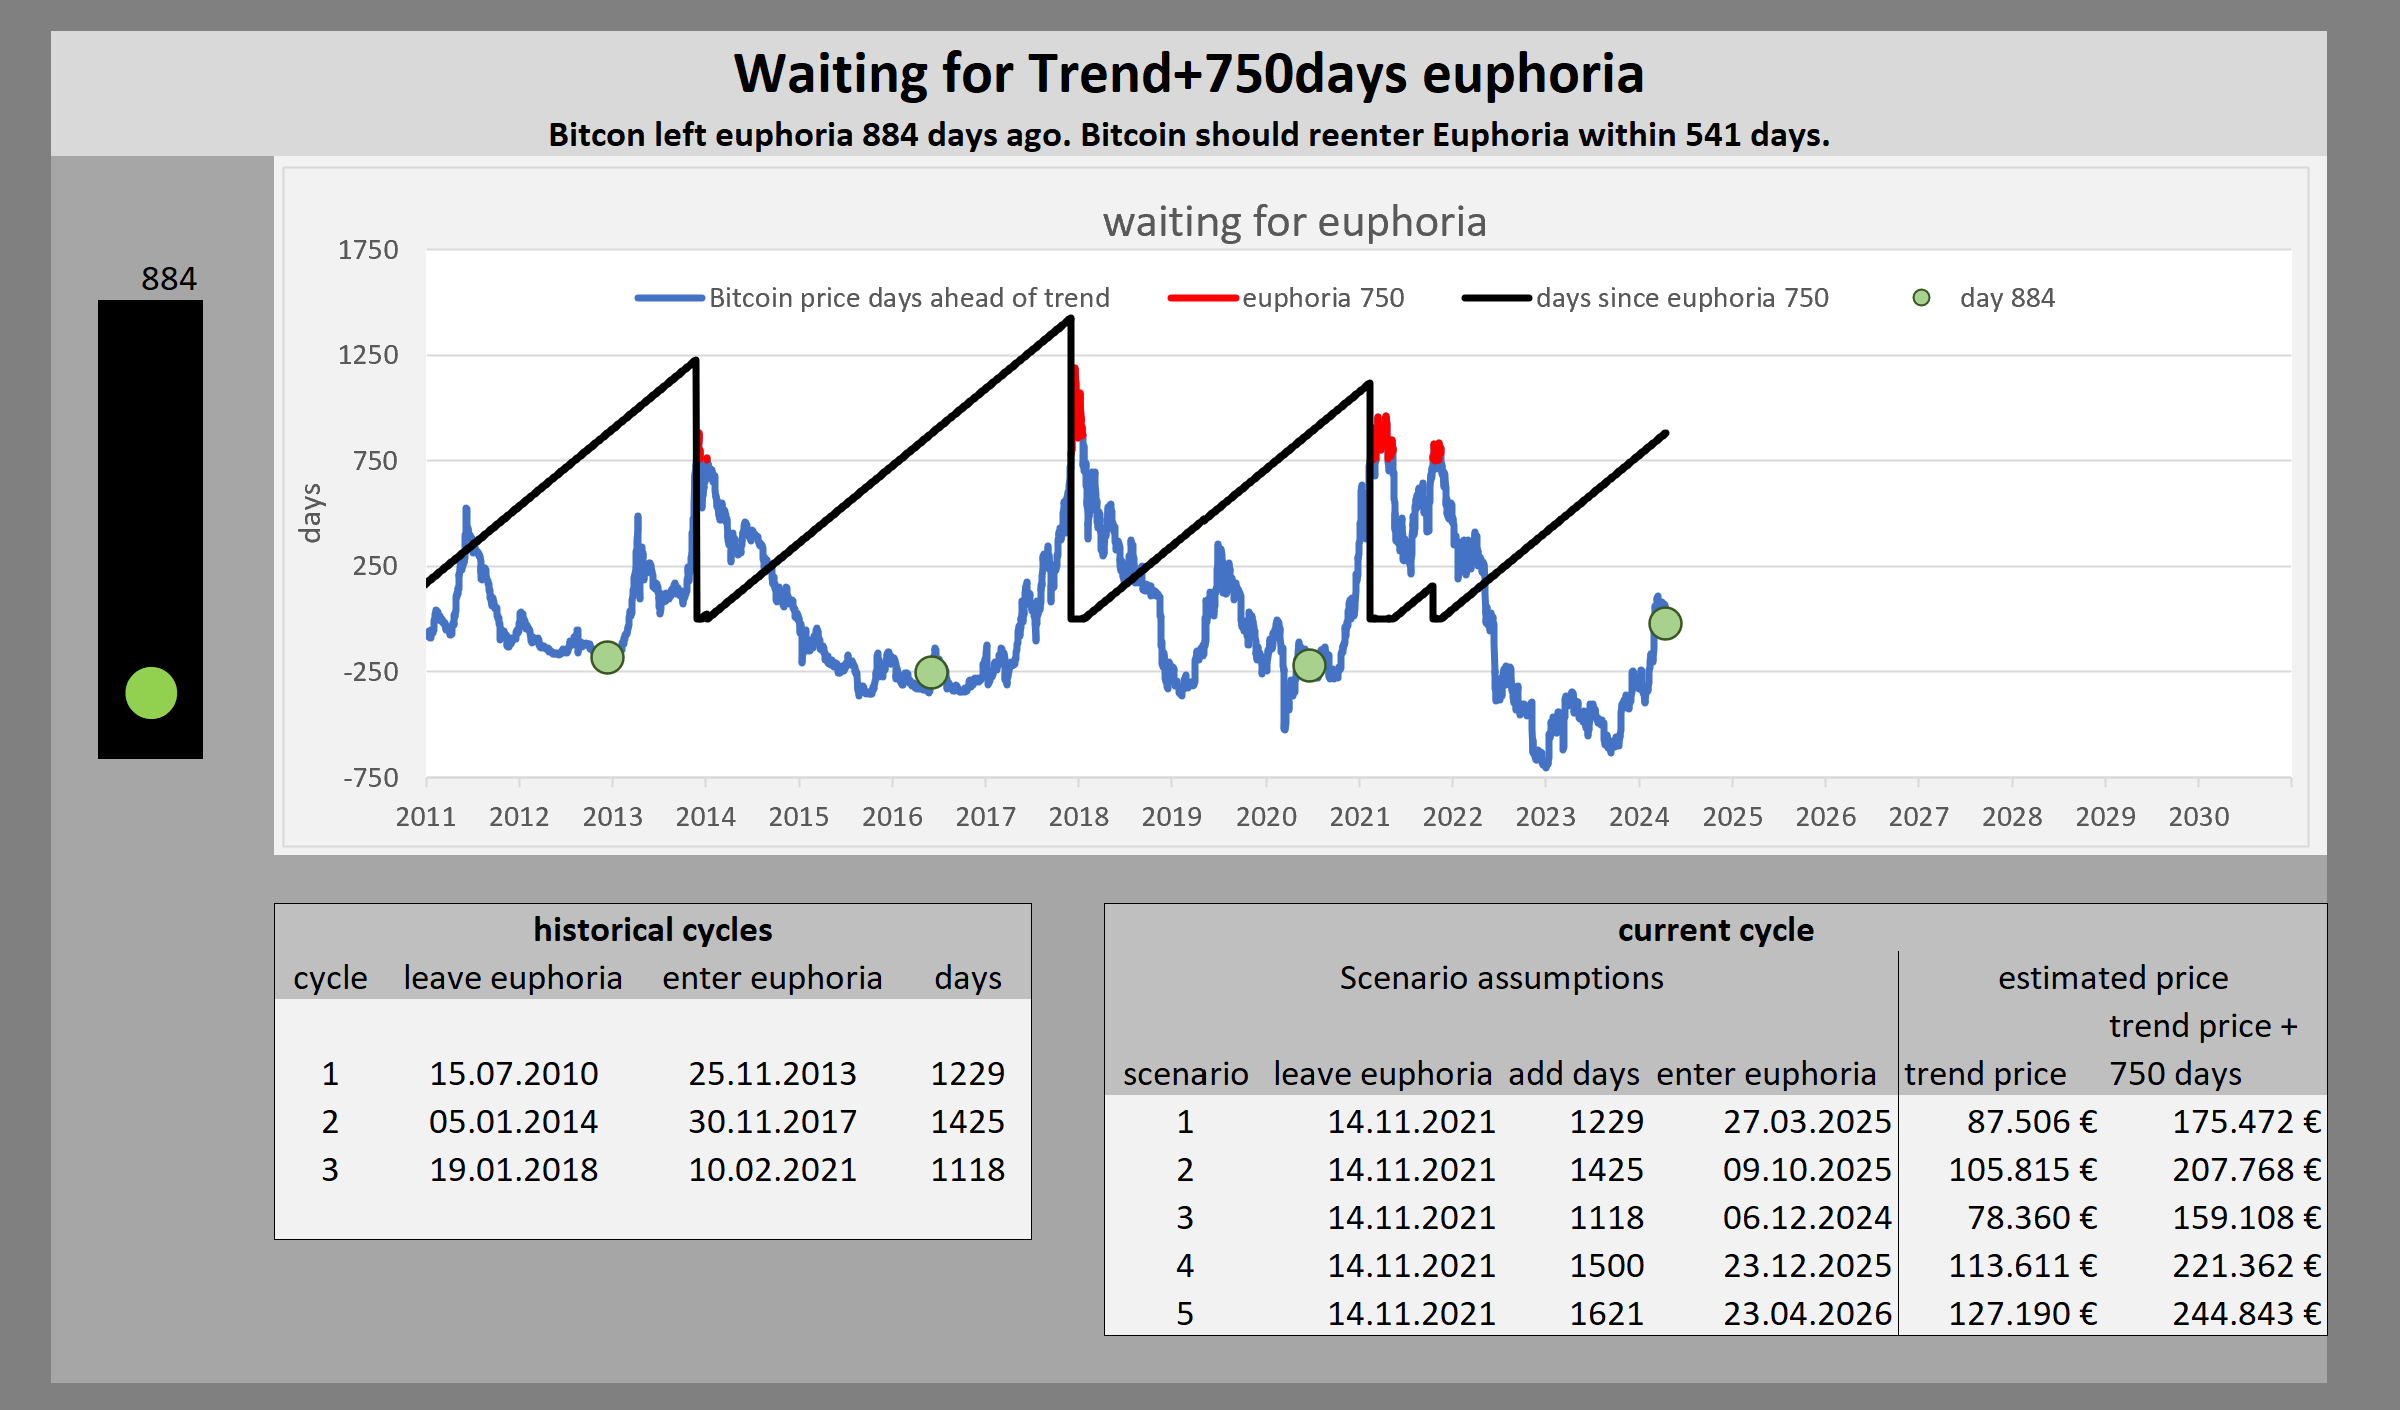 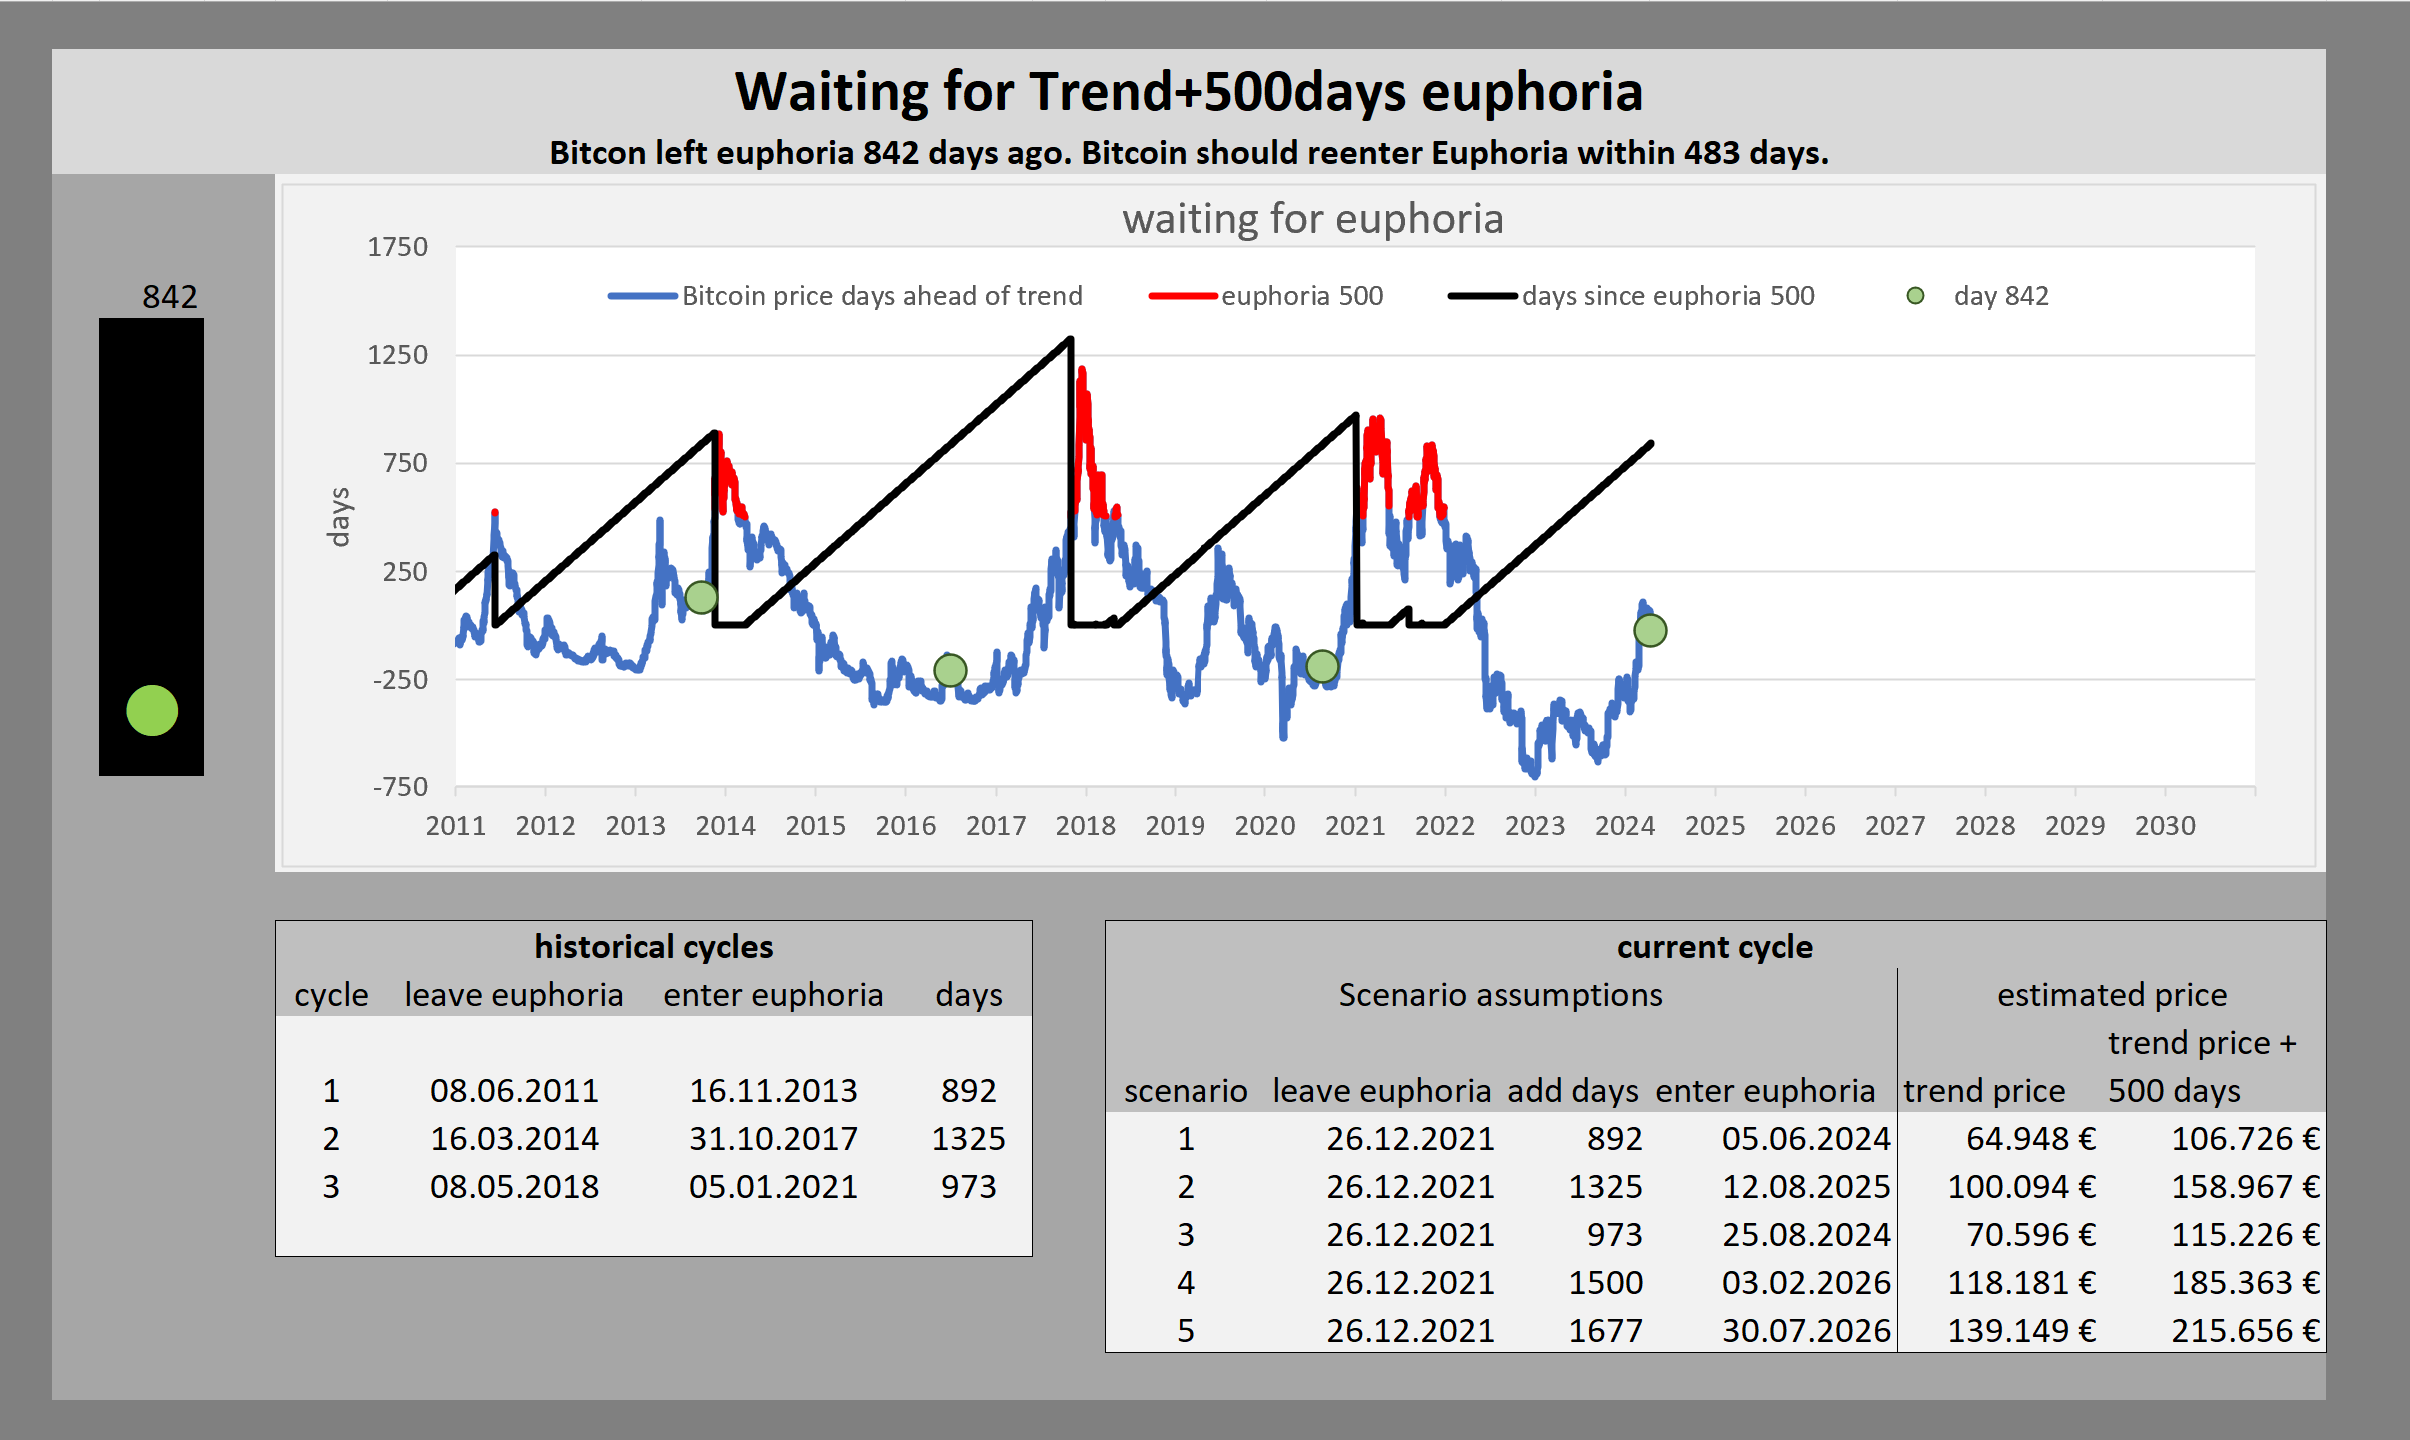 ❸ Maintenance trigger "new bottom found": 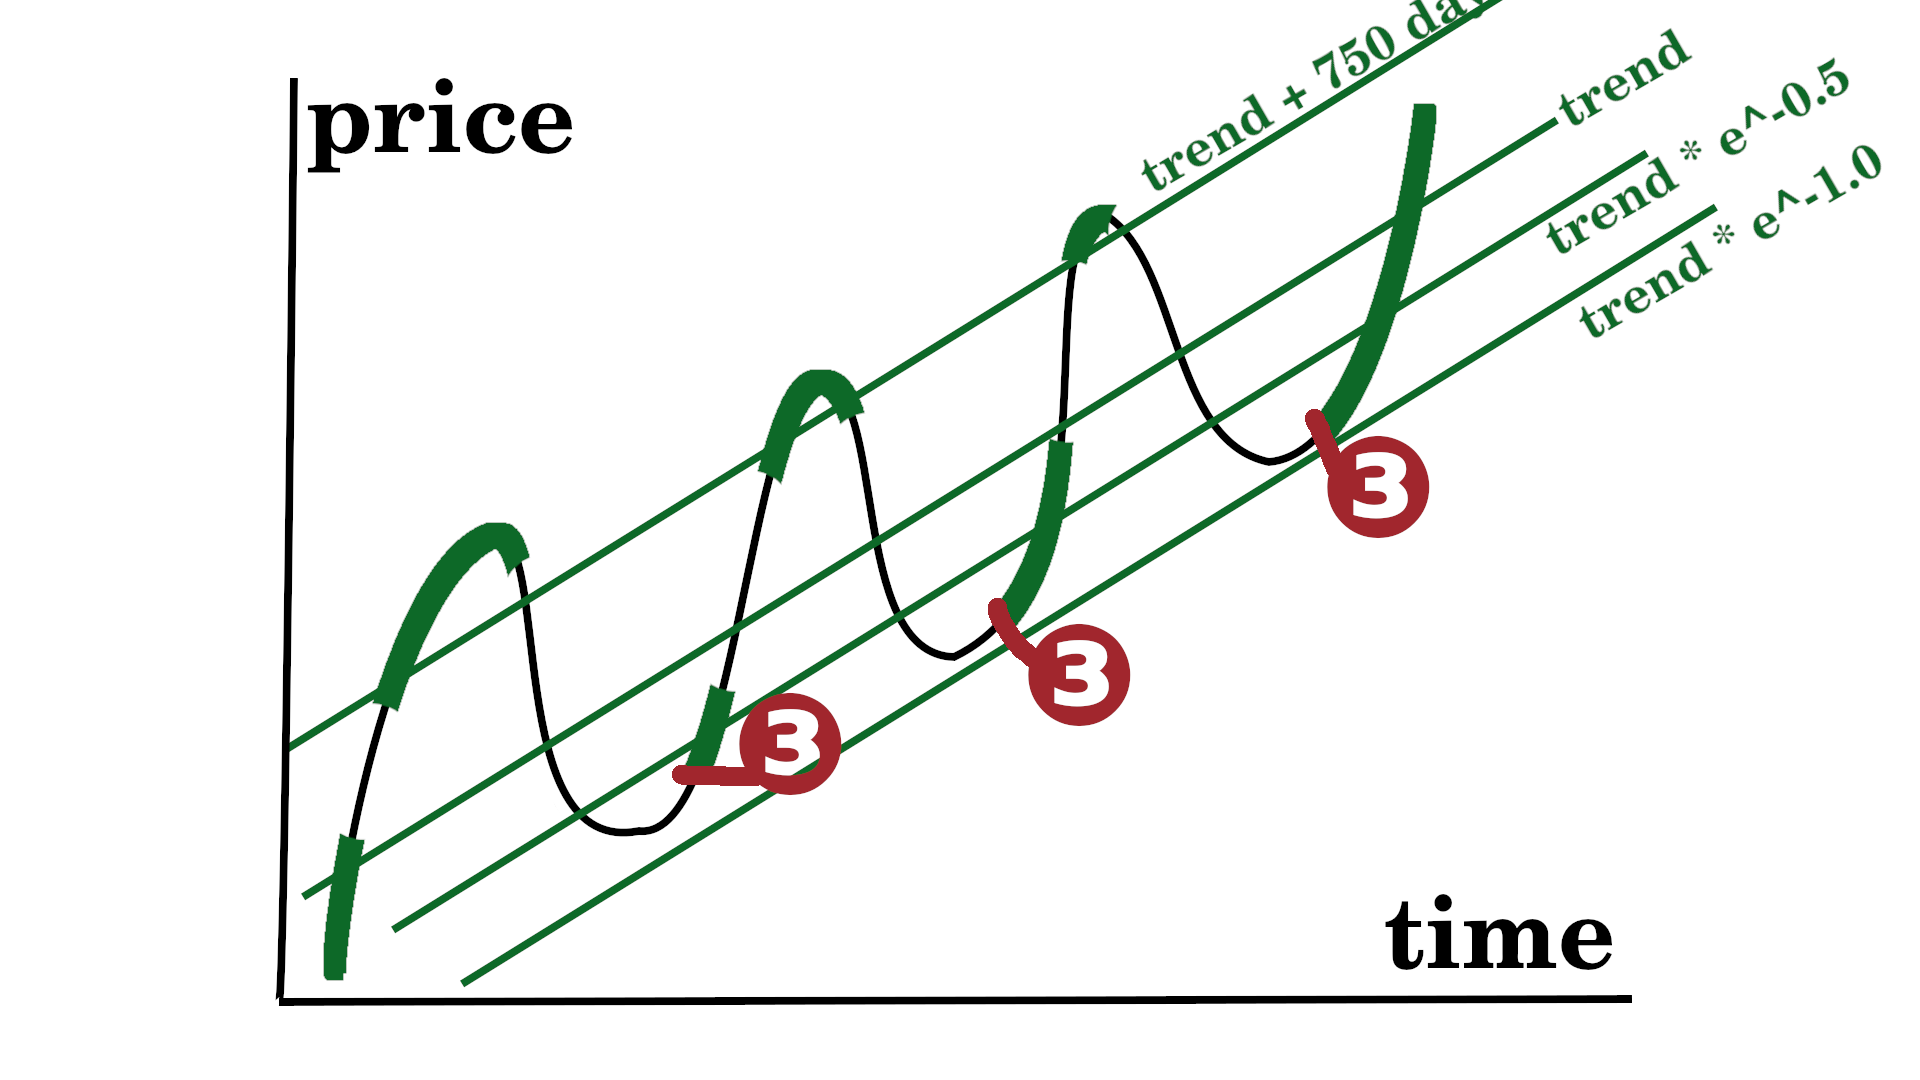 1st trigger: Bitcoin price = 40% below trend 2nd trigger: [Bitcoin price 10% above 12 months low] and [S&P 90d volatility < 90% S&P 500d volatility] or [Bitcoin price 50% above 12 months low] I will then check, if the slope is still slightly below 6. Also I will check the picture of undervaluation and volatility to re-calibrate our trading triggers and our maintenance triggers. ❹ Maintenance trigger "bottom broken":  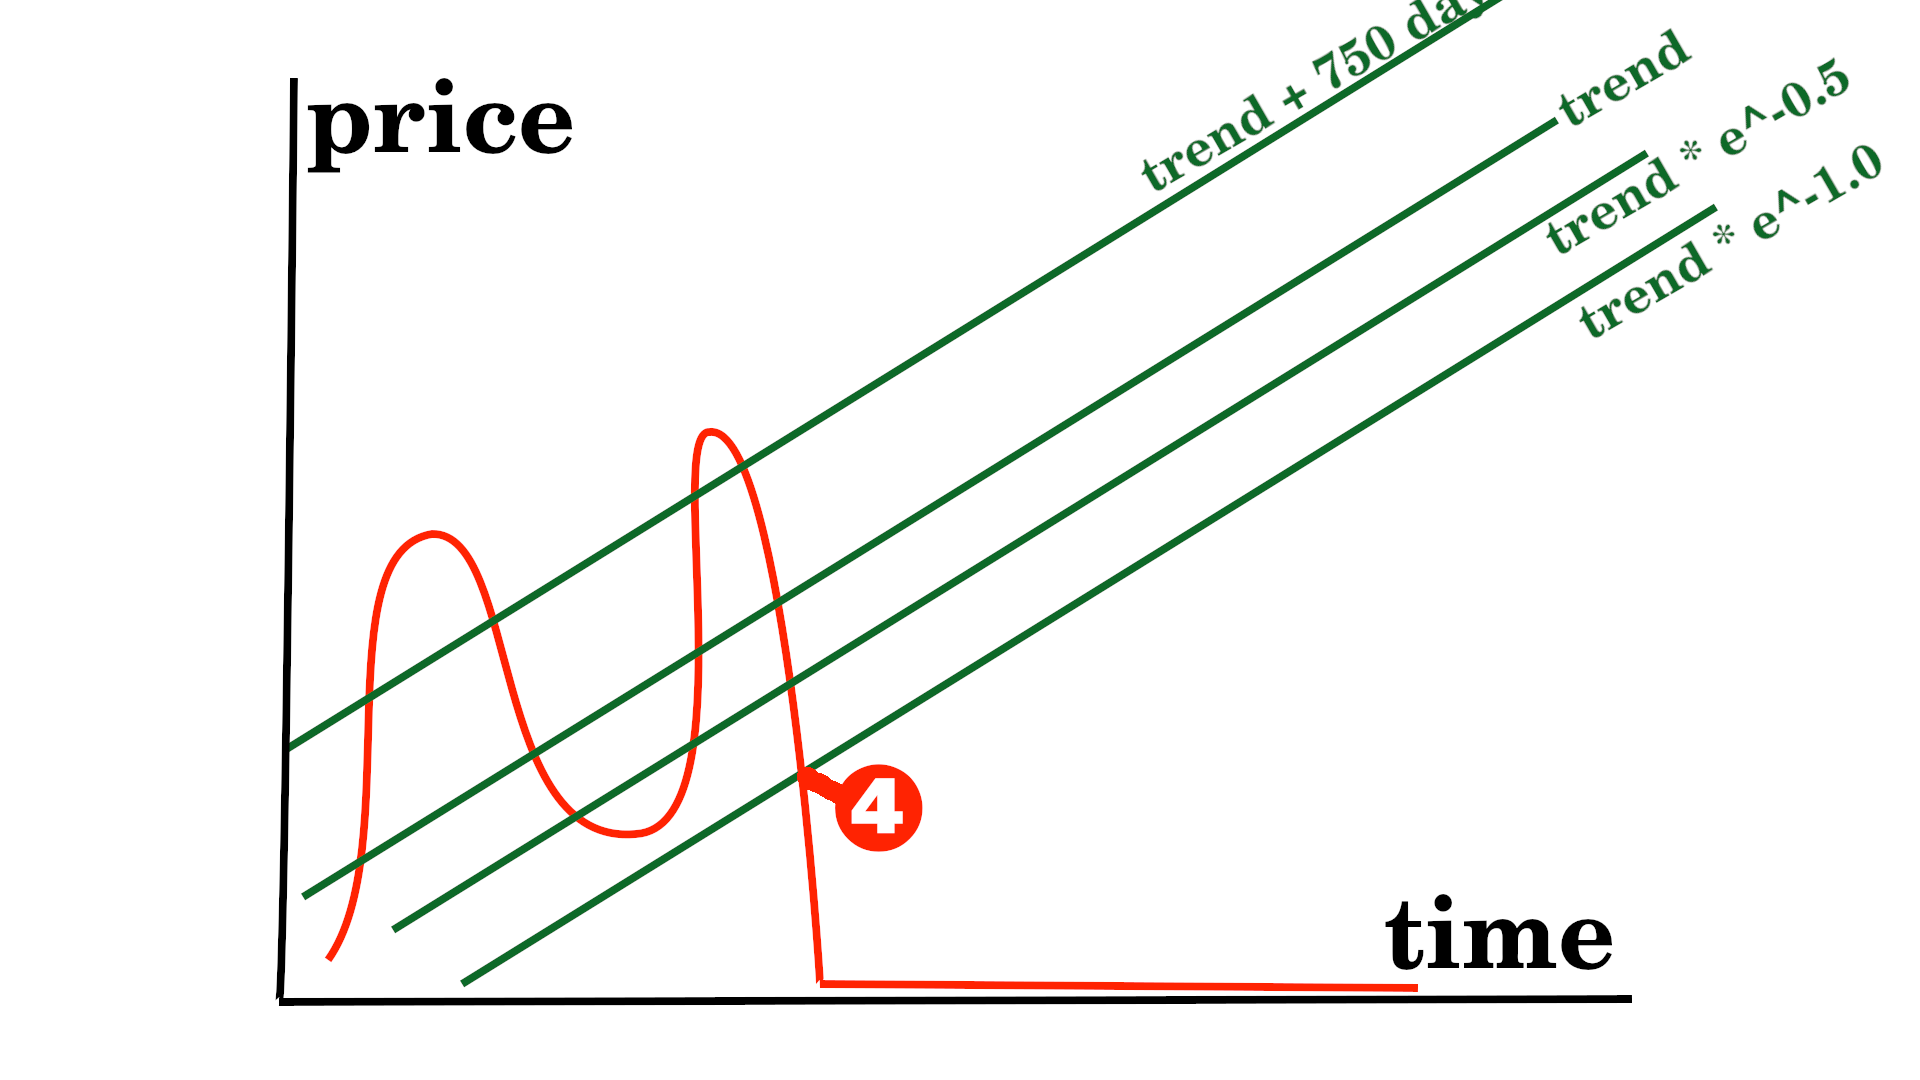 trigger: crushing with high volatility through the floor or gradually lower and lower bottoms 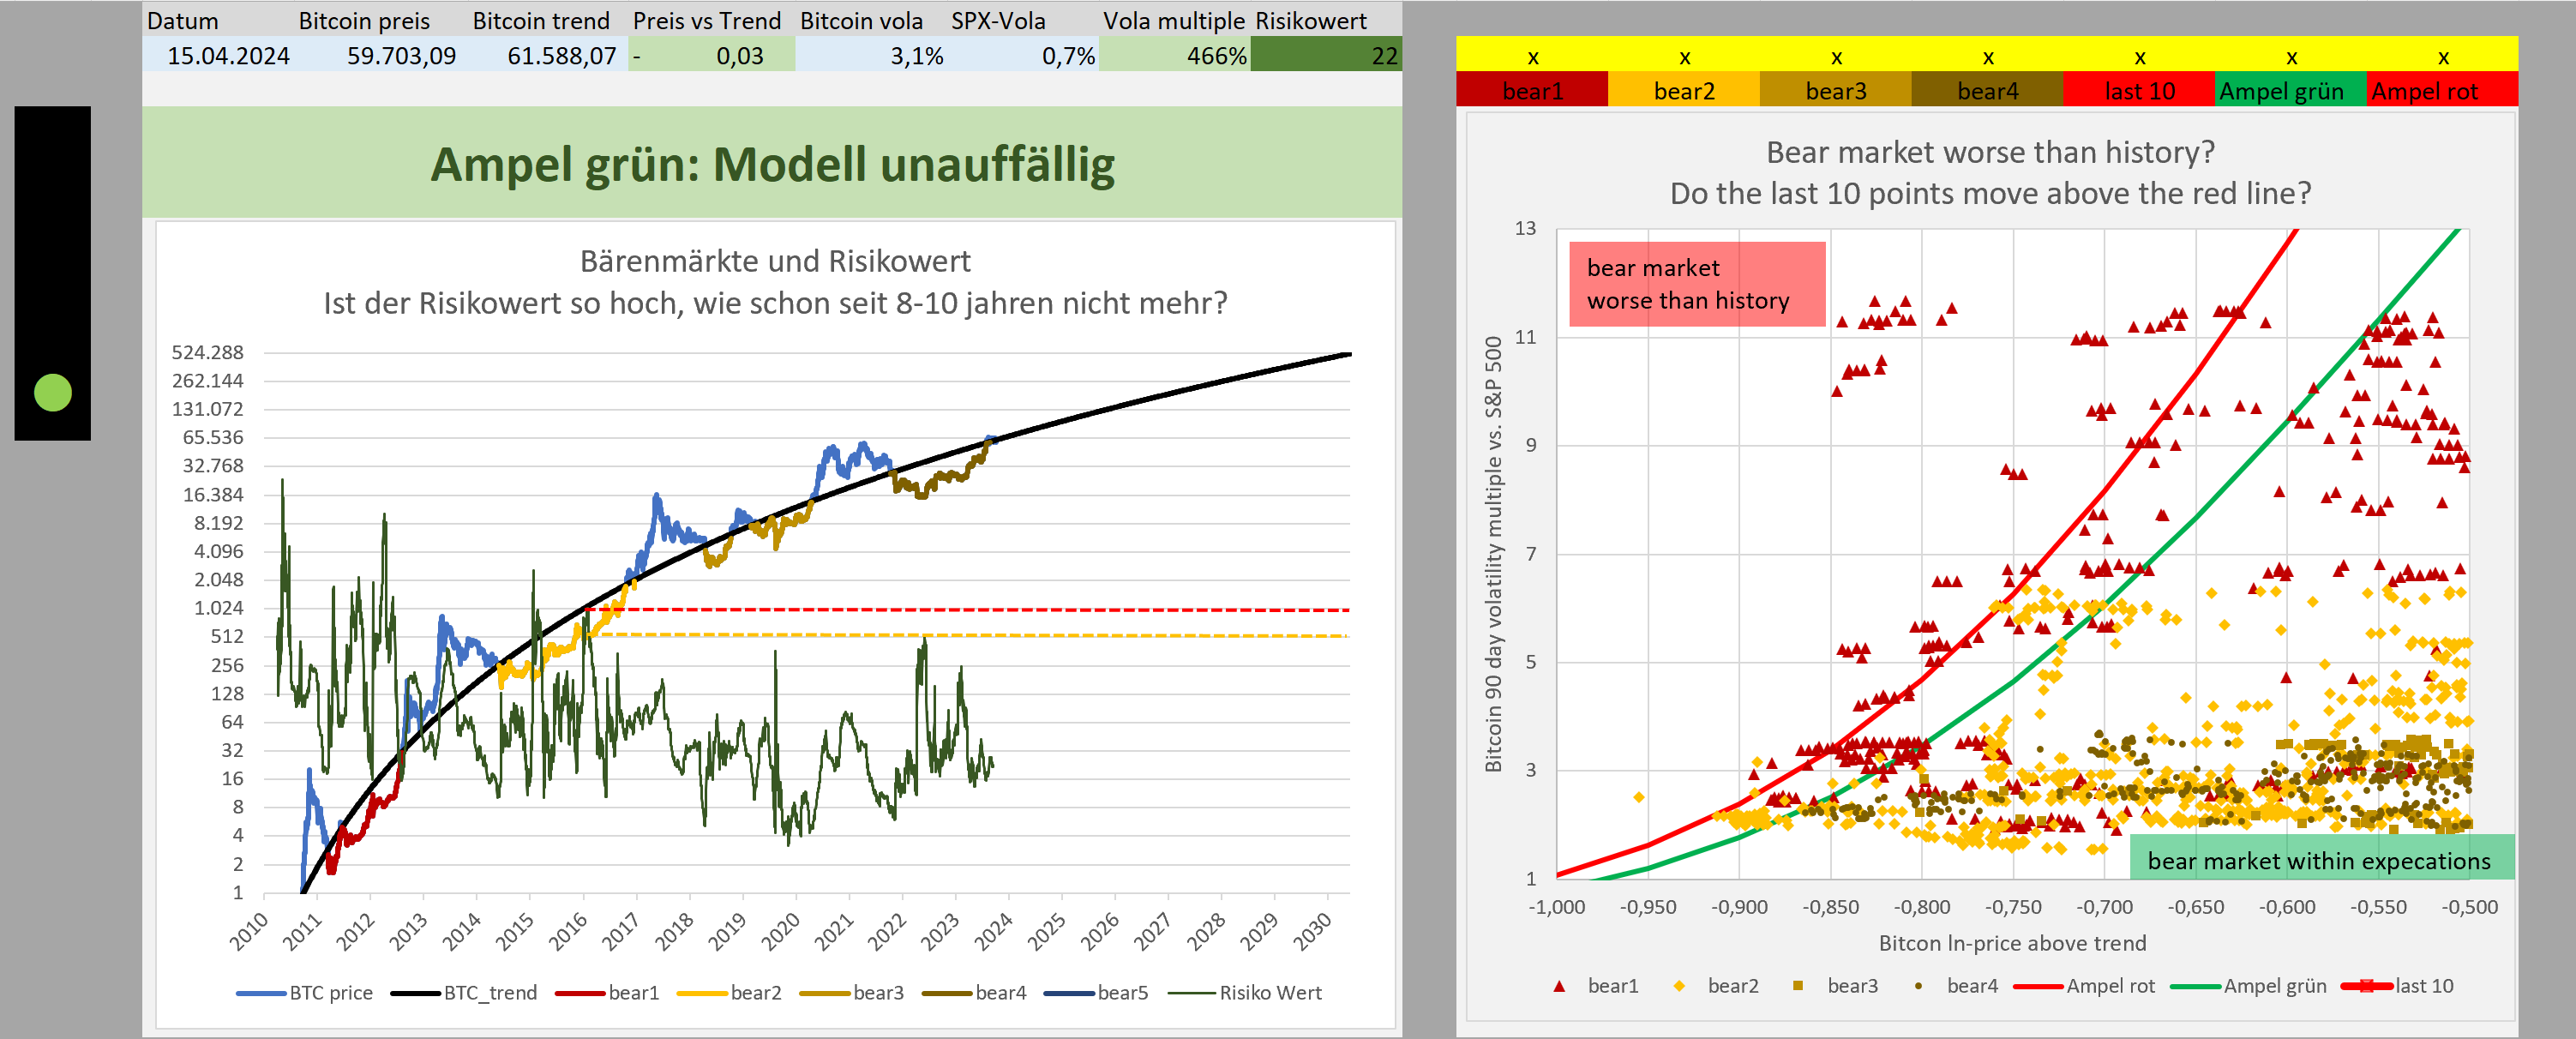
|
|
|
|
1) More people HODLing for longer periods than 4 years. ... people with some savings can.
Governmental approval of Bitcoin makes banning much less likely, making longer term holding saferIt is not unusual to have savings. Many people have pension savings, some own property, a few own gold. Saving means trading [less consumption today] for [more consumption in the future] (e.g. during retirement). So selling Bitcoin to buy stocks or gold just trades one risk for another risk, but you still have risk. Even going 100% cash has risk because of inflation. If you plan to hold for more than 10 years, temporary drawdowns are not important, only permanent losses hurt you. The SEC decision, the ETF approval, MSTR, etc. have brought bitcoin more into the political power structure. The more Bitcoin is owned by the powerful people who set the regulations, the less likely we will see a ban and therefore a permanent loss of one's investment in Bitcoin. 3) More people buying into the falling knife in bear markets. Even with the current 70-80% bear markets, buying at less than ~33% of the previous top actually always has meant that you will be able to sell for profit in less than a year, and if you have 3 years time to HODL then you have profitted always even if you bought near the top (excluding the 69-73k run).
Limited potential for volatility reduction during bear markets, plenty of potential during bull markets, via more people selling into the bull market.If you know a bear market is temporary you can buy the dip. However buying the dip is limited by liquidity (many become unemployed or higher bank lending standards). The S&P-500 has drawdowns of 50%. European stock Indizes have drawdowns of 75%. A minimum drawdown portfolio of 55% gold and 45% S&P still has drawdowns of roughly 30%. I don't see Bitcoin drawdowns to be fully eliminated. The Bitcoin 90 day volatility of Bitcoin during bear markets is already only 2-3x higher than the S&P Index. 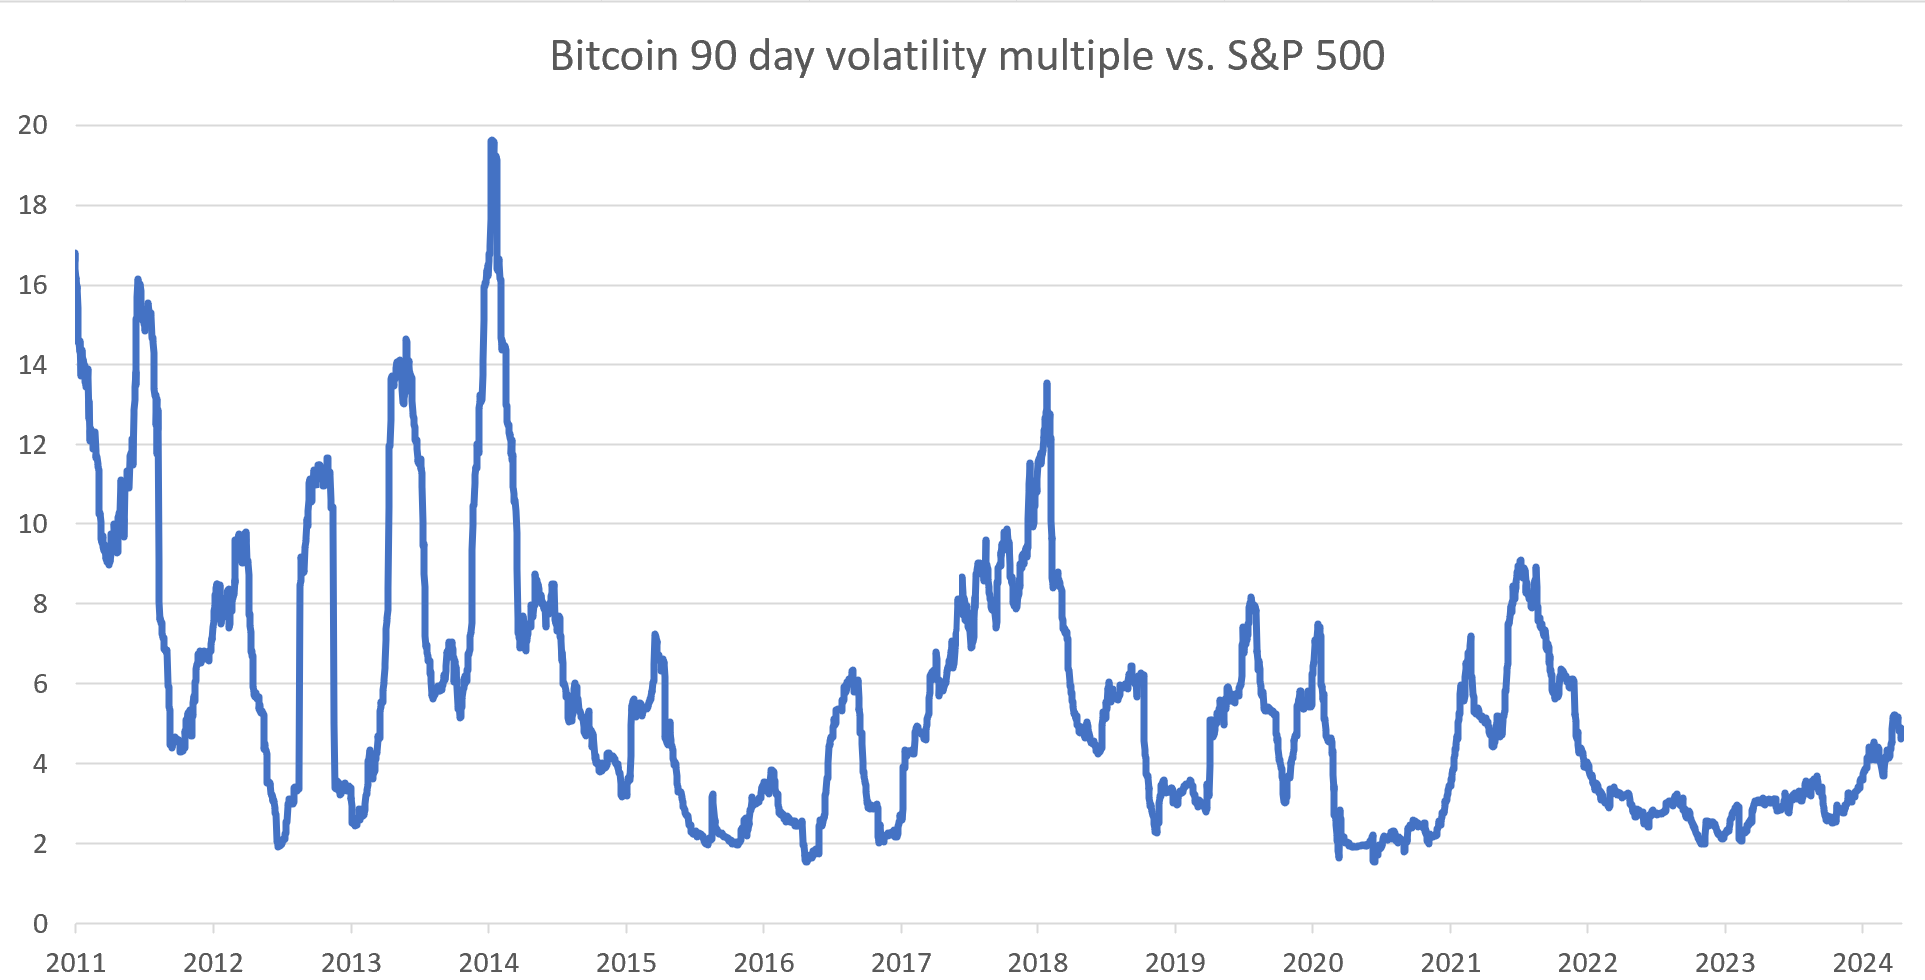 While during bull markets we see 6x higher volatility in Bitcoin vs. the S&P Index. 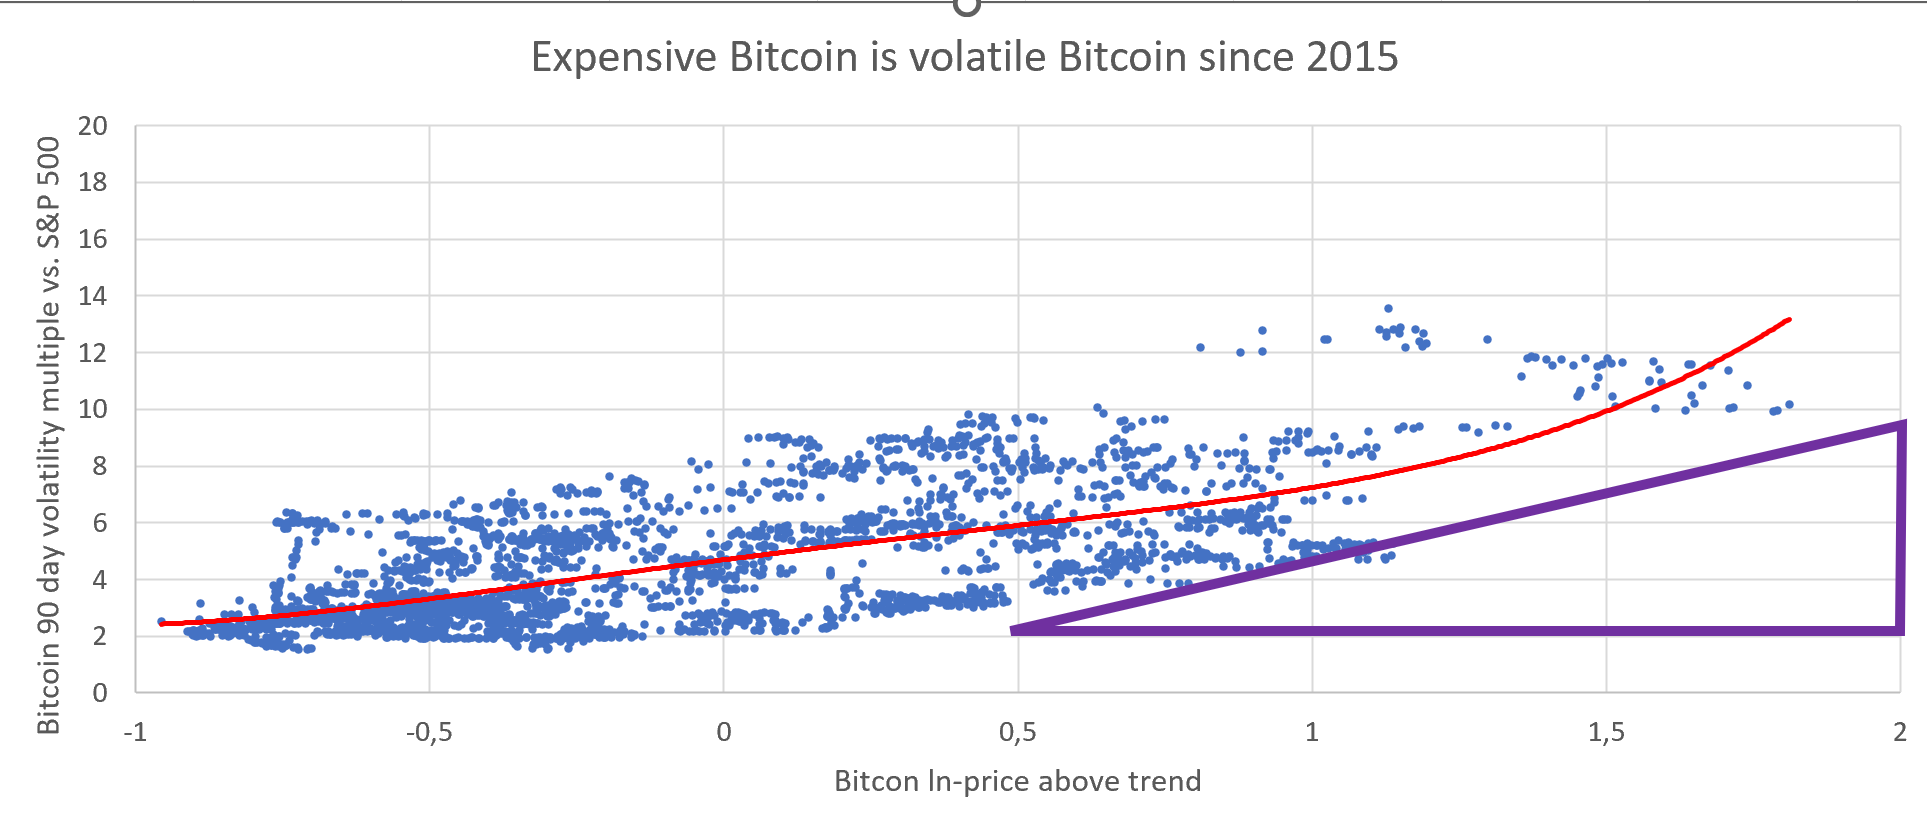 I think Bitcoin having a 2x higher volatility than the S&P Index is still justified. Maybe one day Bitcoin's volatility drops below the S&P towards gold, but probably not within the next 10 years. This seems to suggest that catching the falling knife is working. However I see plenty of potential for lower volatility during the bull market. We could calm this volatility by holders selling more aggressively into the bull market. As a result we will get less extreme tops and also lower drawdowns from the top. 4) More people DCAing into Bitcoin, and not only while the bull roars.
 The Bitcoin bottoms look stable, low Bitcoin valuation has very low volatility, therefore I think the DCA already works very well. I'm always happy to see more DCA, but most volatility is based in the bull markets not the bear markets.
The competent acitve-investor fraction will shift from real estate to Bitcoin as generations cyclePeople who are not interested in managing their own finances will simply stick to what the financial advisor tells them to do and are likely to invest in long-term US bonds regardless of inflation and the US fiscal situation. Only a subset of people (i) have money to invest, (ii) are competent enough to stick to a plan, and (iii) are interested enough to manage their own finances. Let's call them active investors. Many active investors are long property and short paper, a historically excellent trade. Many are also long equities. Most wealth is controlled by old people who are very competent at executing what they know, but bad at learning new things. They will just keep doing real estate. However, as the generations shift, bitcoin (IT & private key management) comes easier than real estate (maintenance and tenant management). People who would otherwise have handled bank loans, tenants and maintenance will also be competent enough to hold Bitcoin long term or buy it cheap and sell it expensive. As bitcoin becomes more integrated into the financial market infrastructure, there will be also more arbitrage. |
|
|
|
TL;DR I guess we will have weaker and irregular cycles in the future Cycles will remainEverything moves in cycles: You have the business cycle, the long term and short term debt cycle, even my kid's emotions have cycles. The usage of leverage supports volatility. Leverage is not only financial (CFDs or futures) but you also have operational leverage. Multiple companies have more volatile fee revenue than salary expenses, therefore some companies in the crypto space tend to break (become insolvent) during a downturn. Cycle duration of 4 years unlikelyThe Bitcoin ecosystem supply comes not only from miners (sell block reward, buy electricity), but also exchanges (sell trading fees, pay salaries) and ETFs (Fees). Additionally the police gets their hands on Bitcoin from time to time and sells. Then we have the Bitcoin owners, who will sell for major purchases especially after accumulating high unrealized gains. Thanks to saving in Bitcoin some people may marry, buy a house and start a family. They will then sell some of their Bitcoin for their wedding, their down payment or their kids education. I think the halving may already be overrated, but going forward I expect the halving to have almost no impact on the price. I expect the main impact will be central bank liquidity, regulation and time. Since I still believe in a cyclical nature of markets / humans, how long can a cycle be? We still need some time to go from overvaluation to undervaluation, so I would guess a cycle will be still between 3 and 6 years or at least between 2 and 8 years. Cycles will become weakerWe can observe: - lower realized daily price volatility - lower realized daily price volatility relative to stocks - lower option implied volatility - less extreme cycles above trend 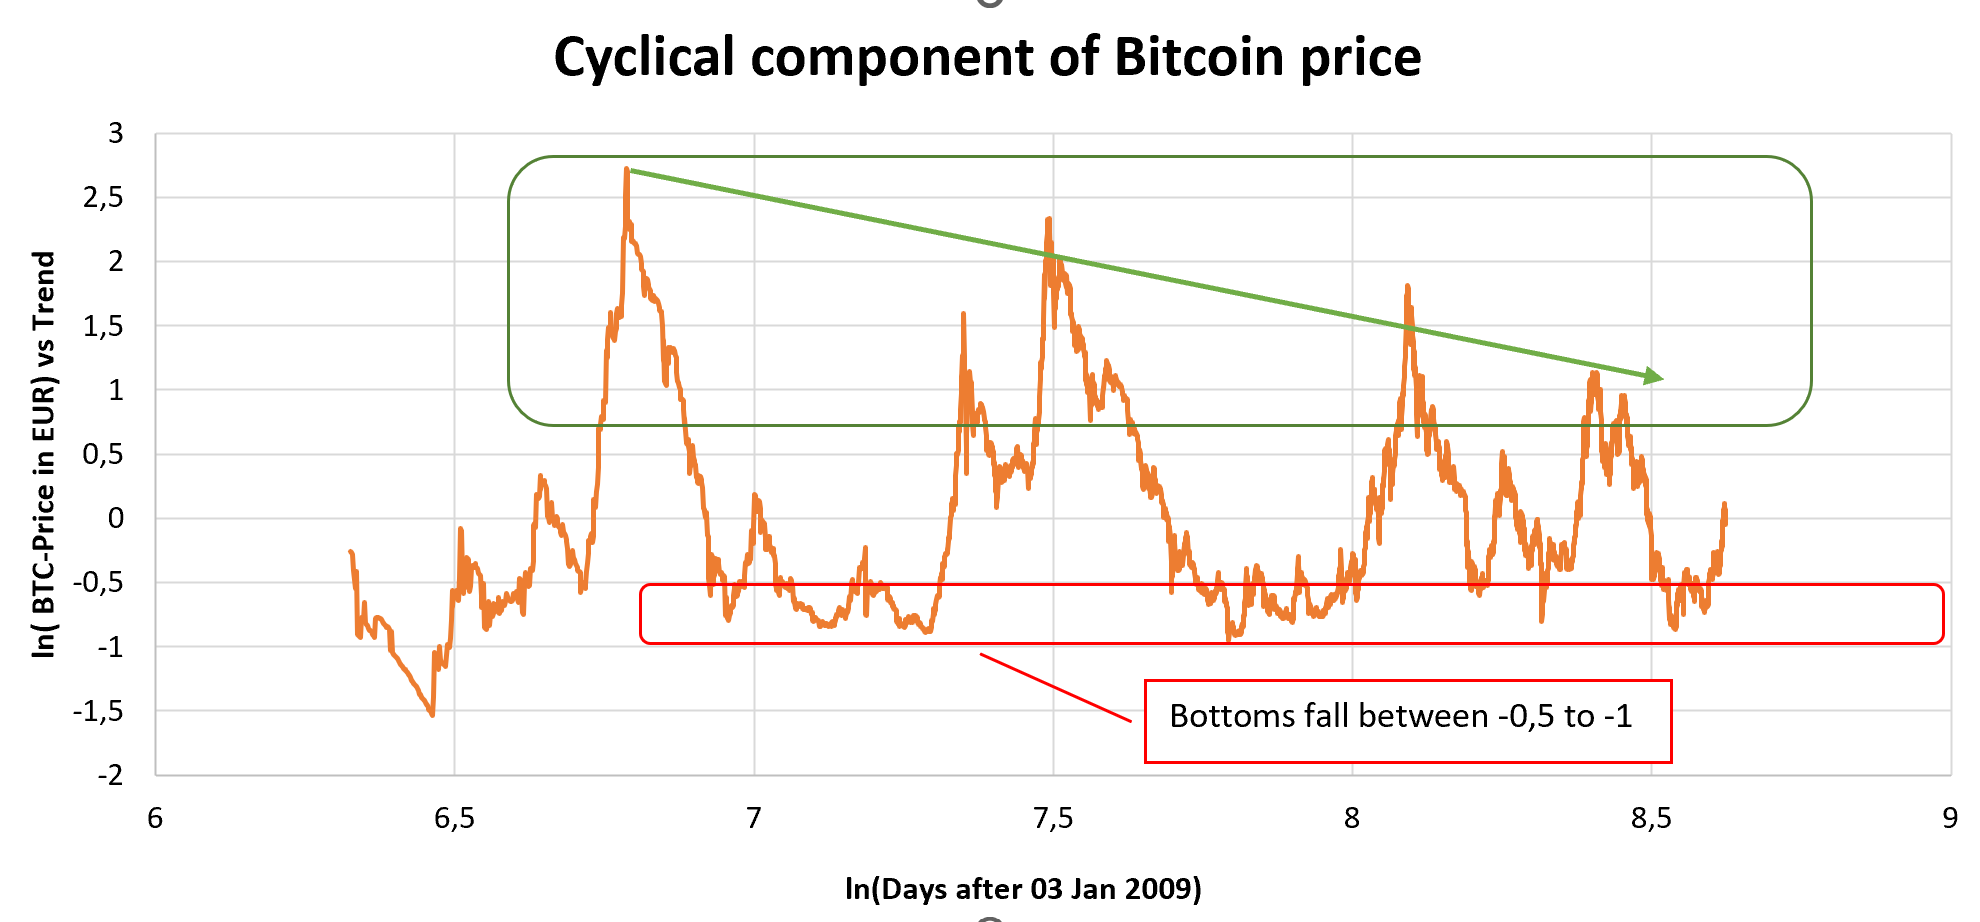 We can't observe less extreme cycles below trend, which might be due to extraordinary events like FTX or Luna. Lower volatility around in combination with a unchanged Bitcoin price trend would be definitely good news for most. Not only would this stabilize your assets, but also lead to more inflows into Bitcoin. Less volatility means higher allocation for most investors, which in return increases the price of Bitcoin. Weaker cycles endangers timing the cycle.During the last cycles we saw 1000+ days overvaluation and trend close to e^⁻0.9. 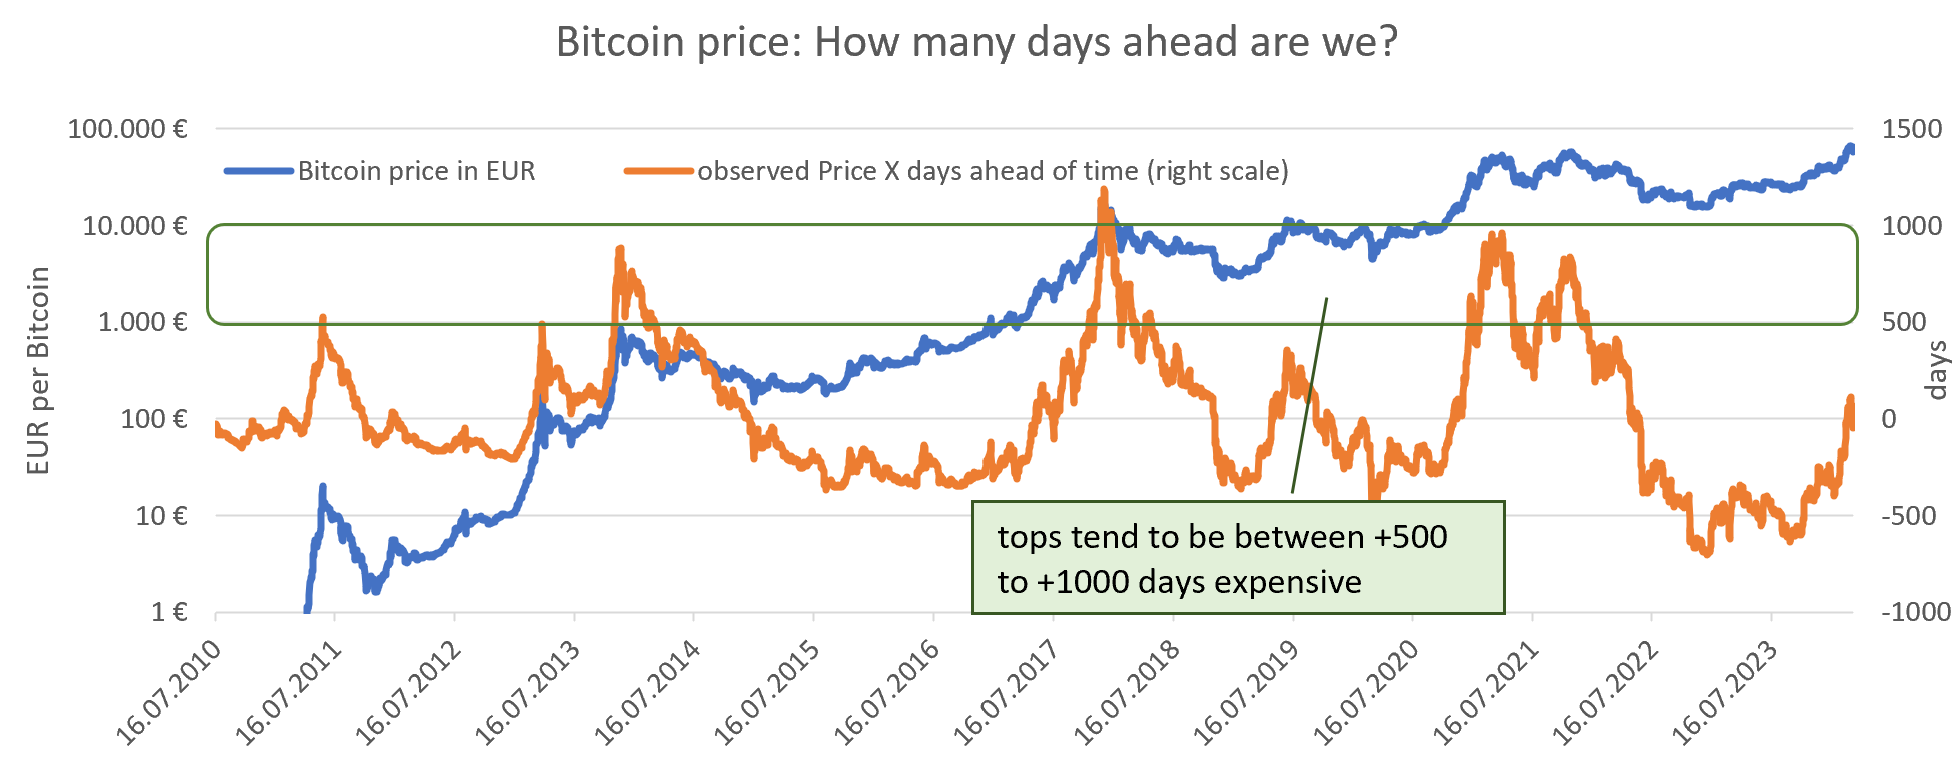 I suggested Bitcoin to be expensive at Trendprice+750 days, Bitcoin to be cheap at Trend*e^-0.5. This gives some reasonable stability for lower Bitcoin cycle volatility during the next cycle. The yield from timing the cycle (blue arrow) is already declining: What do we learn?1.) We can see that the red lines have a declining slope. You get better 1-year forward returns by buying bitcoin cheaply. This makes sense as the mean of the cycle reverses around the trend. It is still interesting to see this result on a time horizon of only 12 months, not 2 or 4 years. 1st orange arrow2.) We can see that the red line (2010-2013) is the highest, the red line (2014-2017) is lower, the red line (2018-2021) is even slightly lower and the last line (2022-March 2023) is even lower. As time goes on, you can expect less return on your bitcoin investment for the same level of overvaluation relative to the trend. This makes sense as the price trend of bitcoin flattens out. 2nd orange arrow3.) We can see the red lines crossing the x-axis at lower and lower values. 2nd orange arrow 2010-2013 we cross at 1.5, 2014-2021 at 0.6 and recently at 0. Buying relatively expensive bitcoin (trend +0 to trend +1.5) in 2010-2013 still gave you positive returns, recently buying only slightly expensive bitcoin gave you negative returns. 3rd blue arrow4.) In our four charts we see 2 grey lines. We can see 2 different trend lines for each 4y cycle. One trend is on the way to the top. The second trend is on the way from the top to the bottom. Obviously you can get a better return the way up vs. on the way down. Unfortunately, it is only partly tradable:  Falling from the green peaks, we could assume that we are on the way down. Excessive overvaluation can be traded. At the yellow tops, however, we could have assume in real time that we were still climbing to a green top. Only in hindsight we would have realized we missed the yellow top. Since we can't tell the yellow tops in real time moderate overvaluation is not tradable. Looking at our most recent dot plot, we can see that the red line crosses 0/0. Does only the cycle matter now? Bitcoin price trend growth is declining. Maybe it is declining much quicker than the cycle? Is trading the Bitcoin cycle more important than holding Bitcoin? The answer is no. 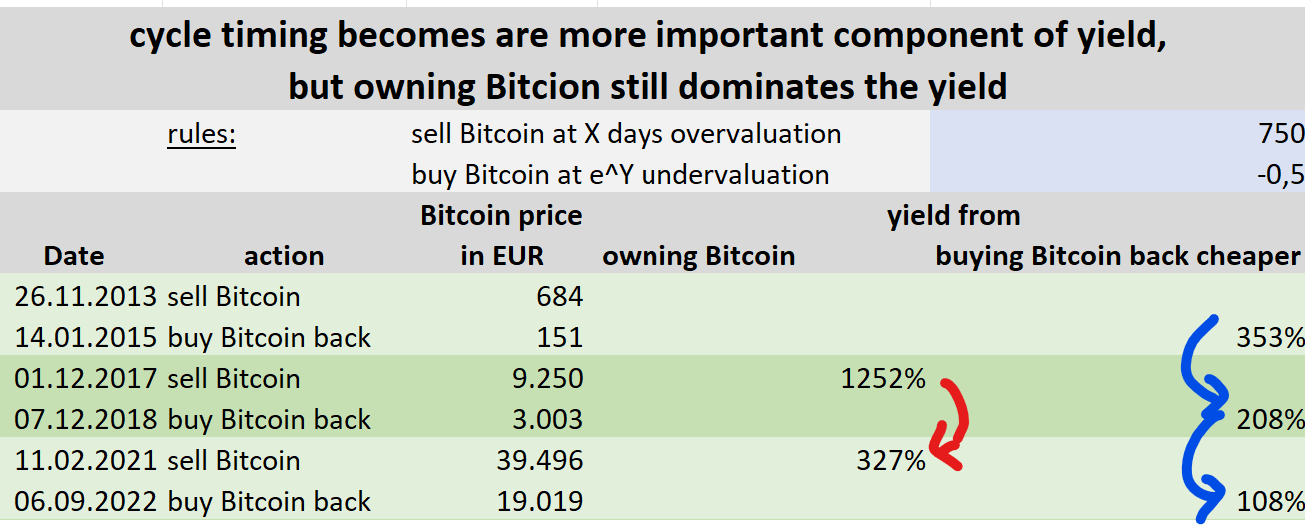 It is true that the yield from owning Bitcoin (red arrow) declines faster (from 1200% to 300%) than the yield from trading the cycle (blue arrow, 350% to 200% to 100%) and therefore the cycle matters relatively more. However the return from just holding Bitcoin is still much higher than the yield from timing the Bitcoin cycle. The main take away is: trading the cycle can juice your returns, but the most imposant decision is buying Bitcoin at all. The red line crosses 0/0, not because the cycle dominates the returns, but because it represents a bear market. Therefore the line is naturally lower than a bull market line (see: what can we learn #4, the two grey lines). Benefiting from cycles is difficultBenefiting from cycles looks good on paper. However during a economic downturn you might become unemployed, or have difficulties rolling over your debt, due having lower net worth or more restrictive loan decisions. Imagine a recession with lower house prices, lowering the amount you can refinance. In this case you would be forced to liquidate other assets.
|
|
|
|
@virginorange: danke für die Antwort. Dass der Trend "bisher" stabil ist, stelle ich eigentlich auch nicht in Frage. Sondern eher, ob er auch weiterhin für die nächsten Zyklen gleich aussagekräftig bleibt.
Zum Thema Hoch- und Tiefpunkte: Der FTX-Tiefpunkt war in der Hinsicht ungewöhnich, dass dabei ein älteres ATH unterschritten wurde, ...
Ich erinnere mich aus dem letzten Zyklus an das Modell, dass Bitcoin auf 4 Jahre noch nie eine negative Rendite hatte, was eine ähnliche Aussage hat. Auch das Stock-to-flow-Modell hat nicht gehalten. Aus der Anfangszeit von Bitcoin hatte ich gehört, dass es hier exponentielle Modellierungen des Preises gibt. Du hast deswegen schon recht, auch wenn mein Modell bisher immer gilt, wird dieses Modell irgendwann brechen. Dieses Modell hat evtl. nur einen Survivor-bias. Ich bemühe mich deswegen das konkrete Scheitern meines Modells frühzeitig zu bemerken: ...
Es stellt sich mir eben die Frage: Wenn wir davon ausgehen, dass sich die Volatilität insgesamt abschwächt, warum schwächt sie sich dann nur nach oben hin ab und nicht nur nach unten?
Das ist eine sehr gute Frage. Evtl. spült jeder Bullenmarkt neue Leute in den Bitcoinmarkt. Ein teil der Leute kauft ohne Verstand, und steigt im Bären wieder aus. Ein gewisser Prozentsatz der neuen Bitcoiner beschäftigen sich aber mit Bitcoin und kauft mit DCA. Damit gibt es einen Preis-Boden. Die Käufer investieren ja x% vom EUR-Gehalt. Die Panik-Verkäufer verkaufen 100% ihrer Bitcoin. Das führt zu einem natürlichen Boden. Wie weit Bullenmarkt nach oben geht ist glaube ich variabler. Hier geht es darum, wie stark sich Bitcoin über die sozialen Netzwerke verbreitet, wie die Liquitätssituation ist und vieles mehr. Der Boden von Bitcoin wird definiert durch den harten Kern, der wirklich von Bitcoin überzeugt ist. Das Top ist stärker Zufallsabhängig, wie viele Menschen von Bitcoin neu hören. Aber ich kenne aus den Bereichen Volkswirtschaft und Medizin, es gibt viel mehr plausible Erklärungen als Wahrheiten. Das für das Gegenteil lassen sich oft genauso gute Gründe finden. Da fällt mir auch an deiner letzten Grafik auf: Nimmt man Corona und FTX (wobei ich 2022 nicht FTX alleine, sondern auch Terra/Luna und Nachwirkungen aus Corona/Ukrainekrieg für den tiefen 2022er Bottom verantwortlich machen könnte) raus, dann steigen die Tiefpunkte auch im Vergleich zum Trend klar an. Vielleicht sind beides also Anomalien. Die Beobachtung der vielen Tiefpunkte stimmt, allerdings scheinen sie seit 2019 seltener zu werden.
Ein Spötter würde sagen, irgendwas ist immer. Ich denke FTX ist vergleichbar zu Mt. Gox. Und Terra/Luna wäre in einer Krise sowieso gescheitert. Aber das Makro-Umfeld war zu Corona schon besonders schlecht. Auch Ende 2018 war das Makroumfeld schlecht, da war die FED restriktiv, bis der Treasury Markt Liquiditätsprobleme bekommen hat. Ich denke, du könntest schon recht haben, dass die Volatilität nach unten abgenommen hat. Aber eindeutig ist es bisher nicht. Wir haben noch zu wenig Daten, sodass noch mehrere verschiedene Theorien plausibel klingen. |
|
|
|
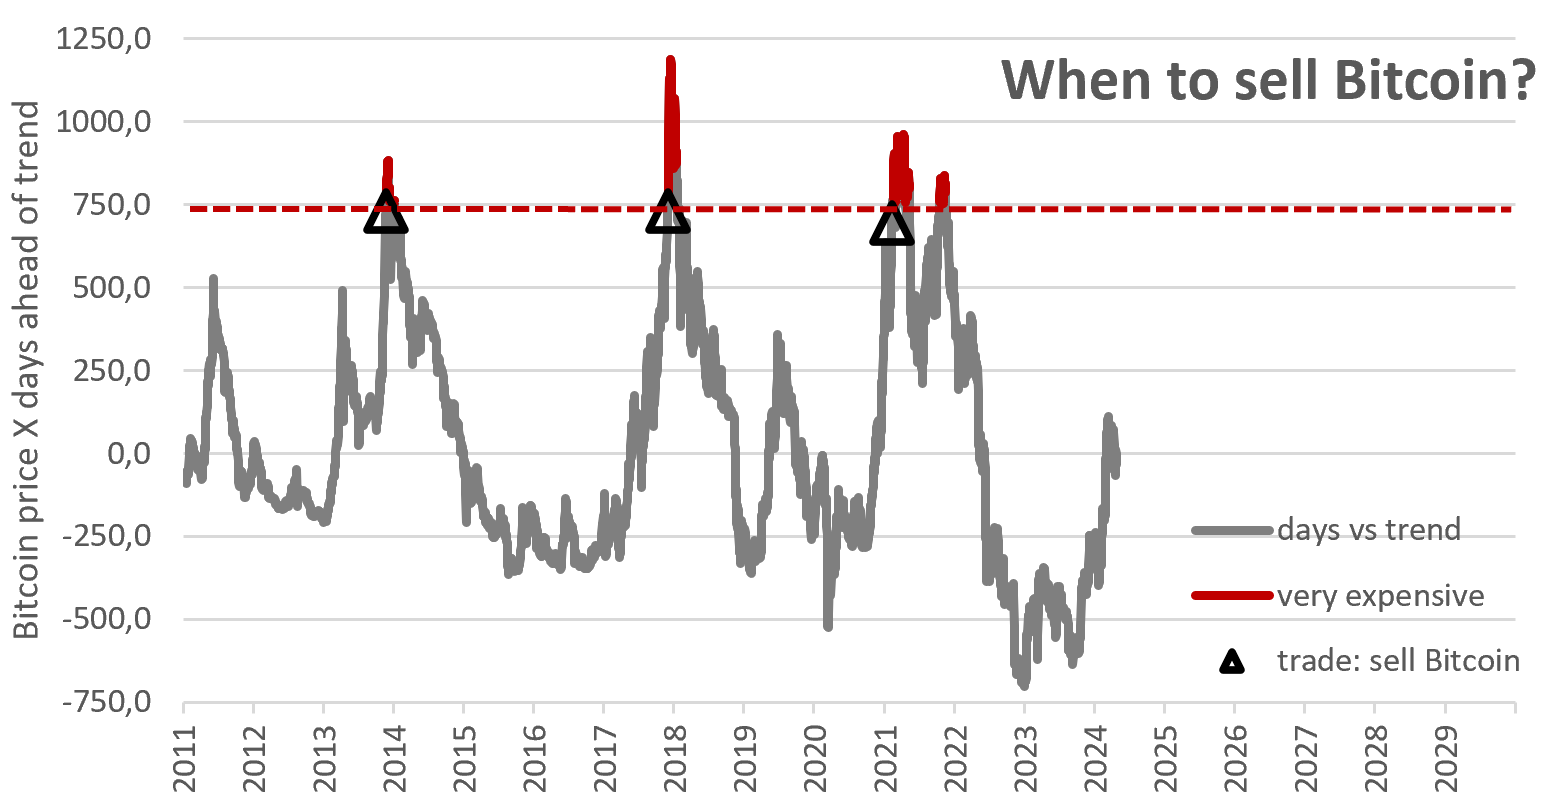
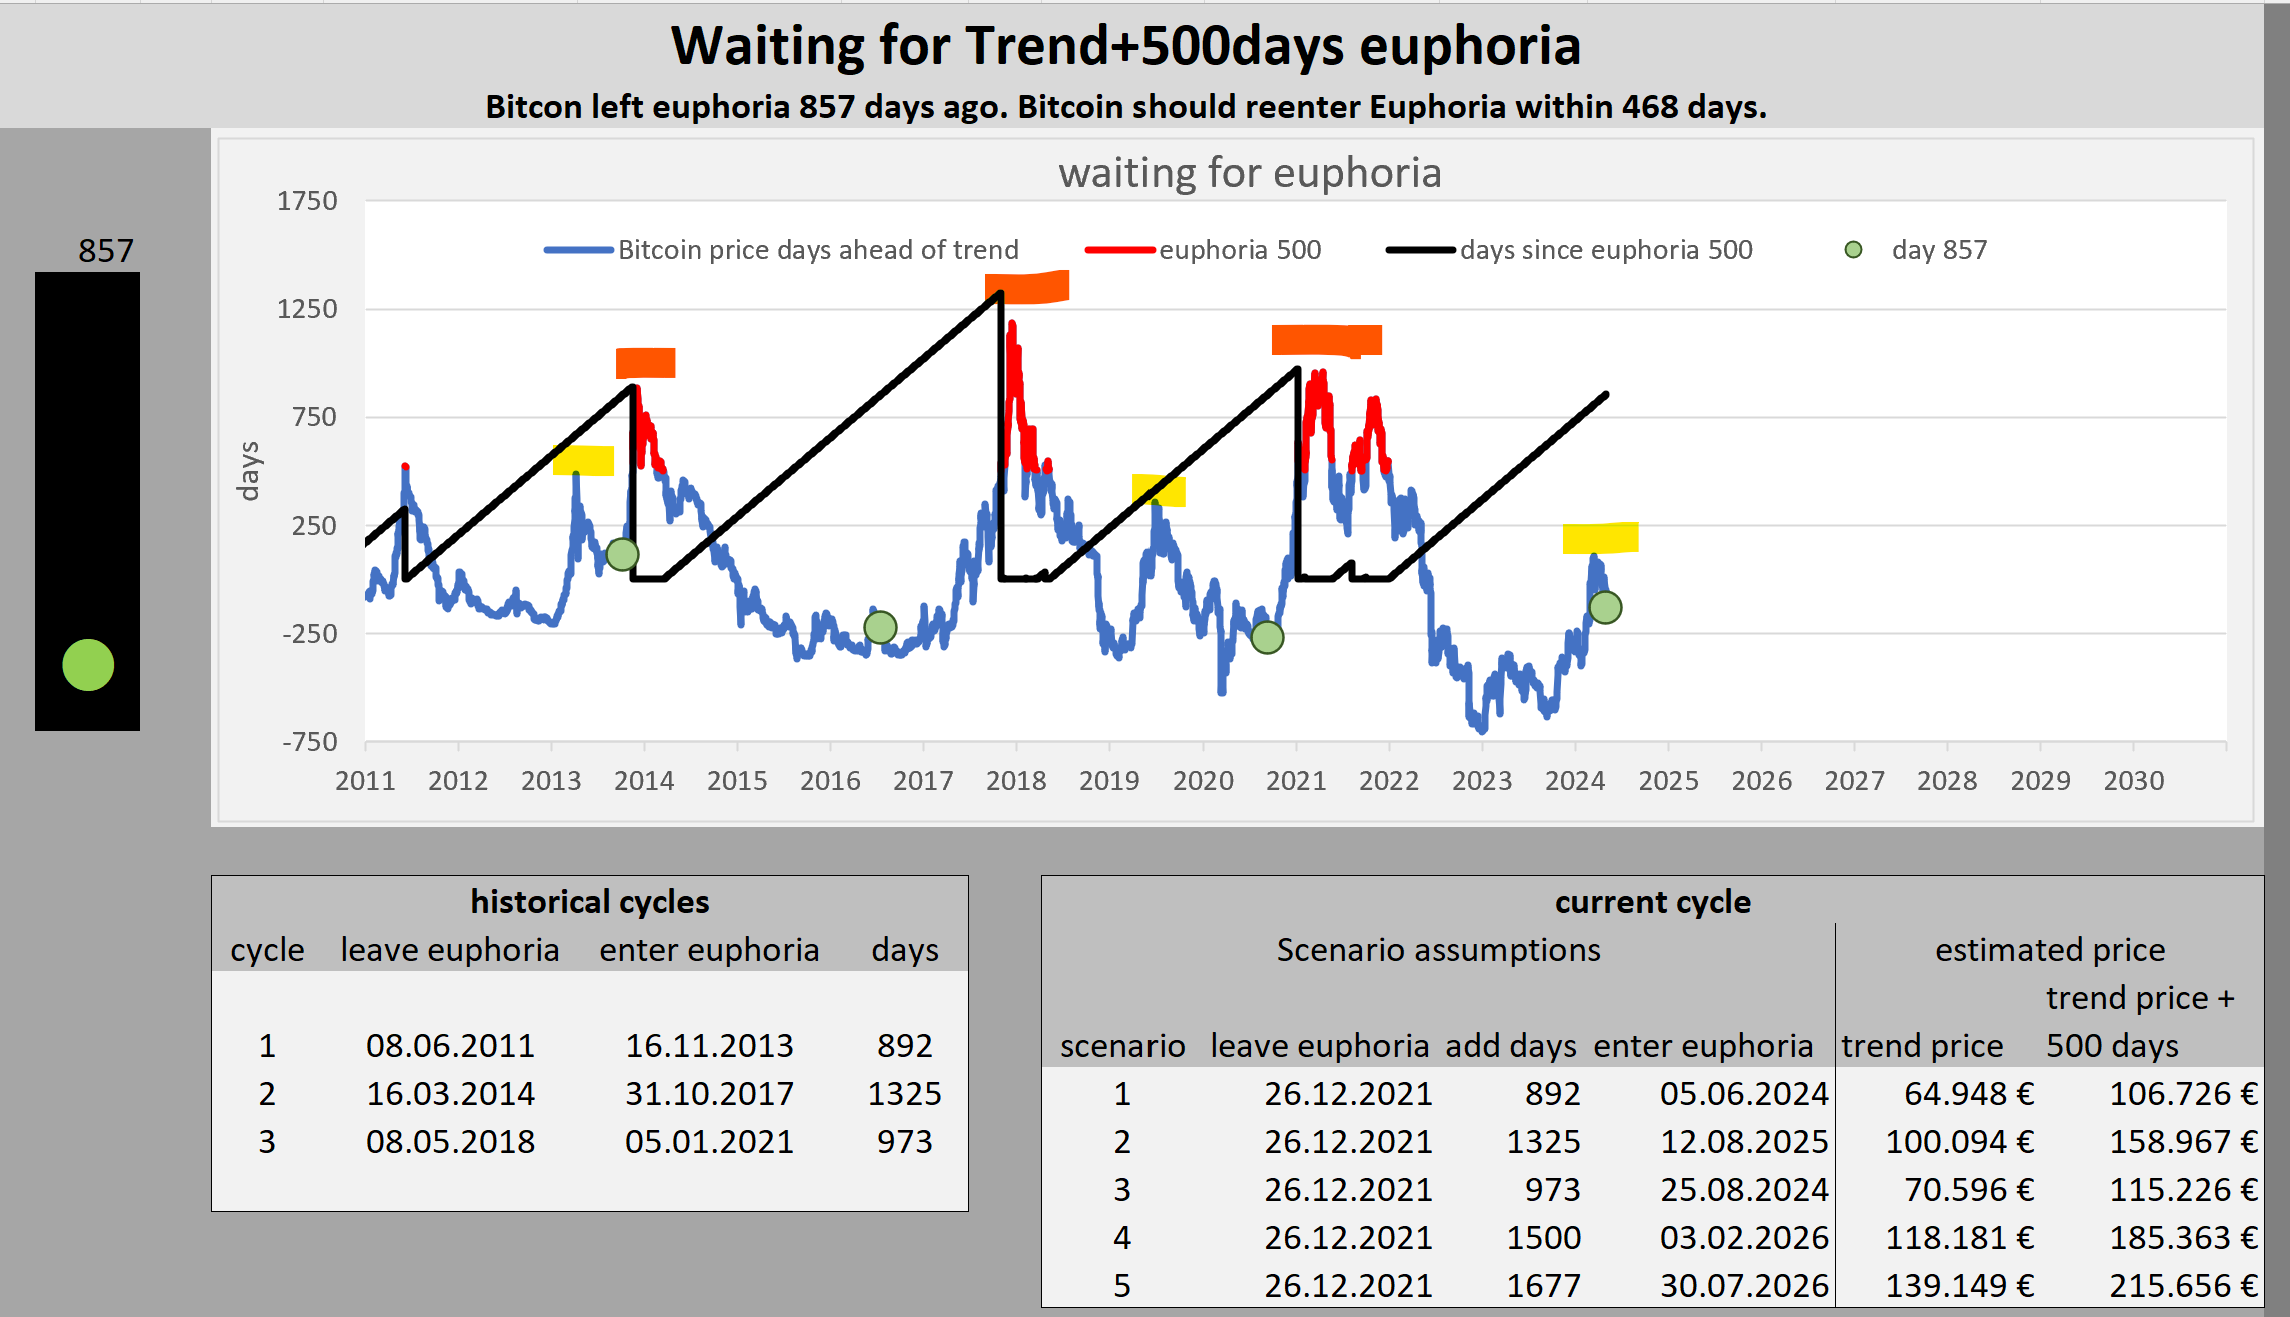
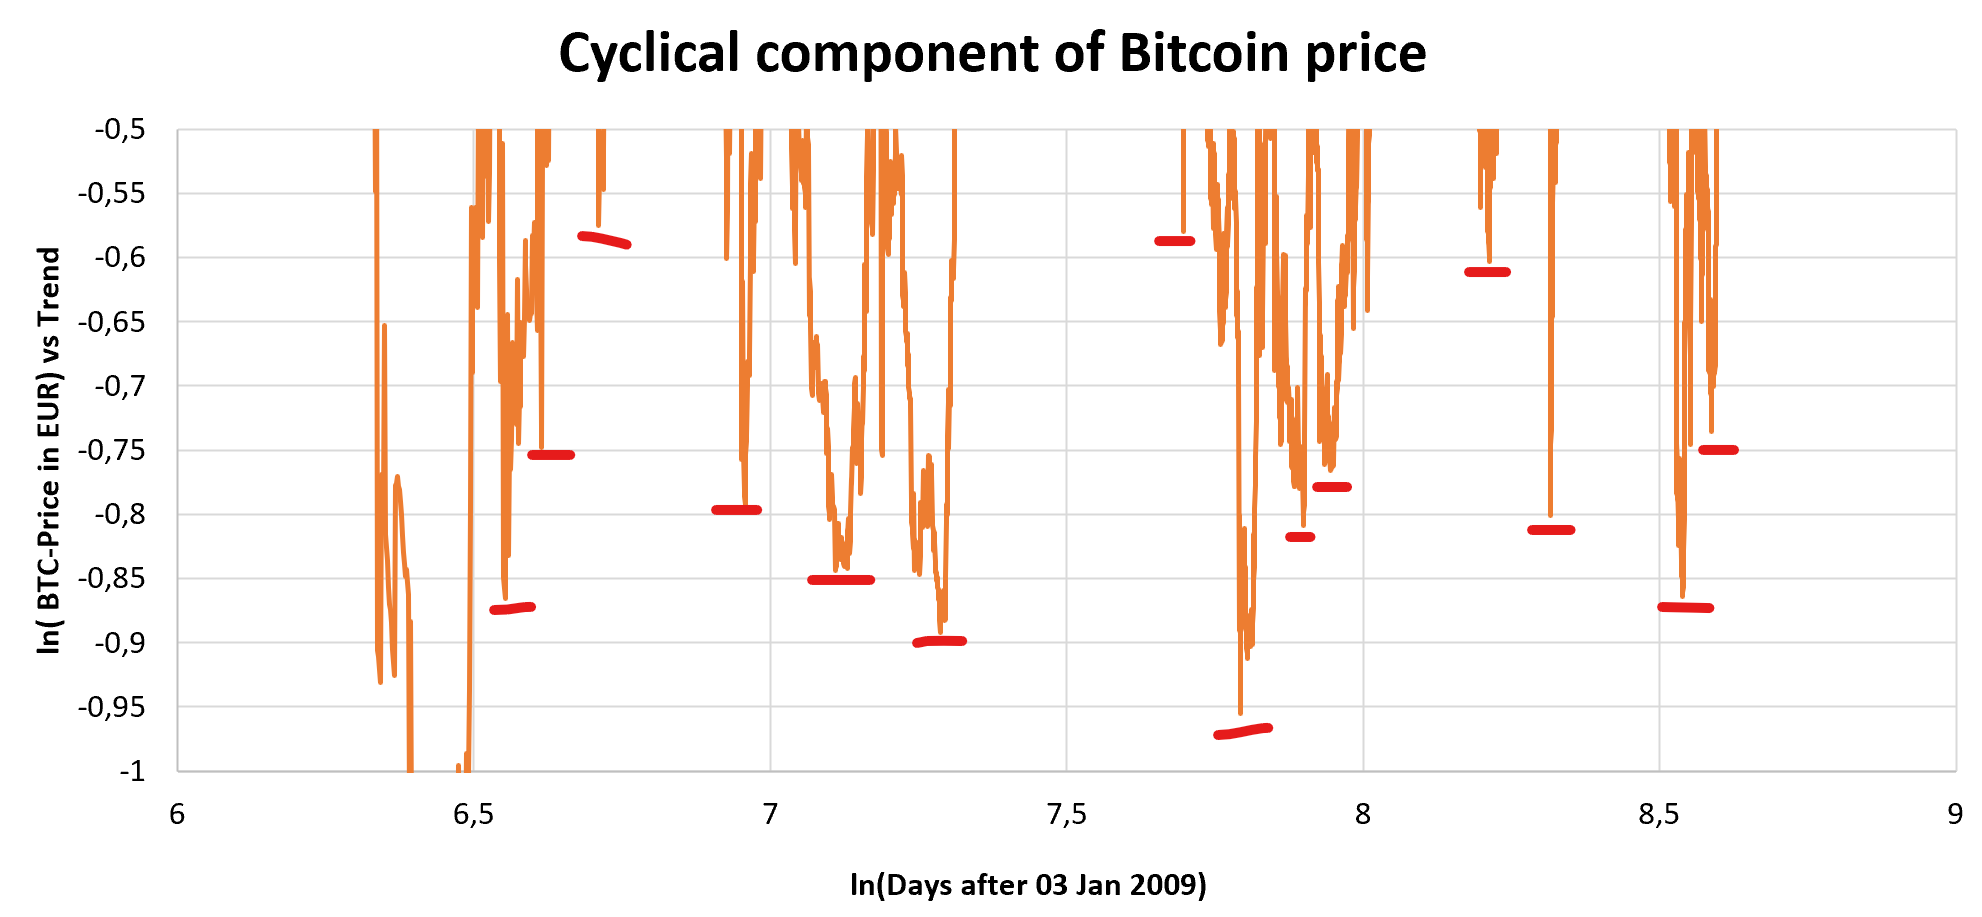
Warum ich mir Risiko-Ampeln für Bitcoin gebaut habe: ❶ Der Bitcoinpreis unterliegt bisher einem positiven Trend plus einem Zyklus um diesen Trend. ❷ Trend & Zyklus sollen zukünftig meine Entscheidungen beeinflussen: ⓐ Weil der Bitcoinpreis einen stark positiven Trend aufweist, investiere ich mehr in Bitcoin also ohne diesen Trend. ⓑ Weil der Bitcoinpreis um diesen Trend schwankt, modifizieren ich ggf. meine monatlichen Käufe. D.h. ich würde mehr im Bärenmarkt und weniger in der Spitze kaufen. Bei Verkäufen (z.B. in 10 Jahren) könnte ich meine Verkäufe bezogen auf den Zyklus timen (eher teuer im Bullenmarkt verkaufen als billig im Bärenmarkt). ❸ Eines Tages, das kann in einem Jahr oder auch erst in 30 Jahren sein, werden sich Trend oder Zyklus bei Bitcoin ändern. ❹ Weil meine Entscheidungen abhängig sind, von Trend und Zyklus beim Bitcoinpreis, sollte ich bemerken, wenn sich hier etwas ändert. ❺ Zusätzlich kann ein Bruch in den Eigenschaften einer Zeitreihe auch durch fundamentale Änderungen ausgelöst werden. Springt die Risikoampel auf rot, sollte ich also prüfen, ob sich bei Bitcoin fundamental etwas geändert hat. Warum sich meine Ampeln auf Hoch- und Tiefpunkte konzentrieren:Der Bitcoinpreis zu jedem Tag setzt sich zusammen aus (i) einer Trend- und (ii) einer Zykluskomponente, die wir beide allerdings nicht direkt beobachten können. Hochpunkte und Tiefpunkte im Bitcoin Chart eignen sich am besten für meine Risikoampeln. Am Hochpunkt haben wir den maximalen Zyklus nach oben. Am Tiefpunkt haben wir den maximalen Zyklus nach unten. Ⓐ Hochpunkte werden höher: Volatilität des Zyklusses steigt oder Trendwachstum steigt. Ⓑ Hochpunkte werden tiefer: Volatilität des Zyklusses sinkt oder Trendwachstum sinkt. Ⓒ Tiefpunkte werden tiefer: Volatilität des Zyklusses steigt oder Trendwachstum sinkt. Ⓓ Tiefpunkte werden höher: Volatilität des Zyklusses sinkt oder Trendwachstum steigt. Außerhalb der hoch und Tiefpunkte erhalten wir weniger Hinweise auf eine Änderung der Eigenschaften der Zeitreihe. Risikoampel für HochpunkteDen Bitcoinpreis gegenüber Trend habe ich als blau eingezeichnet. Ein Wert von 250 bedeutet, dass der Bitcoinpreis seinem Trend um 250 Tage voraus läuft (also 250 Tage zu teuer ist). Ab 500 Tagen zu teuer spreche ich von Euphorie, hier habe ich den Bitcoinpreis rot eingezeichnet. Schwarz eingezeichnet habe ich, wie lange wir warten müssen von Verlassen einer euphorischen Phase zur nächsten euphorischen Phase. Aktuell haben wir die jüngste euphorische Phase vor 842 Tagen verlassen, dies habe ich mit einem grünen Punkt eingezeichnet. Tag 842 seit dem Verlassen der euphorischen Phase habe ich für die vorherigen Zyklen ebenfalls eingezeichnet. In vergangenen Zyklen haben wir zwischen 892 und 1325 Tagen benötigt, um wieder in eine Euphorie zu kommen (siehe linke Tabelle). In der rechten Tabelle habe ich eingetragen, an welchem Datum un zu welchem Preis wir wieder in eine Euphorie kommen können, sofern sich der zeitliche Abstand zur kommenden Euphorie die Historie widerspiegeln würde. Aktuell liegen wir 842 Tage nach der vergangenen Euphorie. Sollten wir nach 1325 Tagen immer noch nicht in eine Euphorie gekommen sein, springt die Ampel auf gelb. Die könnte ein Hinweis auf ein abnehmendes Trendwachstum oder schwächere Zyklen sein. Die Länge vergangener Zyklen hat geschwankt. Der aktuelle Zyklus könnte daher auch länger dauern als 1325 Tage. Wie viel länger würde ich warten? Der längste Zyklus (1325 Tage) war 352 Tage länger als der zweitlängste Zyklus (973 Tage). Also wäre es nicht allzu weit hergeholt, wenn unser aktueller Zyklus 1325 + 352 Tage = 1677 Tage dauert. Wenn wir aber nach 1677 Tagen immer noch keine Euphorie gesehen haben, dann wäre dies schon ein starker Hinweis entweder (i) auf eine Abschwächung der Zyklen oder (ii) auf einen schwächeren Trend. Diese ganze Übung können wir nochmal durchführen mit einer Euphorie Definition von Trend+750 Tagen (anstatt Trend+500 Tagen). Die Ergebnisse sind aber im wesentlichen ähnlich: Risikoampel für TiefpunkteBei den Tiefpunkten sehe ich mir die Kombination von Bitcoinpries unter Trend und der releativen Volatilität von Bitcoin ggü. dem S&P-500 Aktienindex an.
|
|
|
|
|
Wir shorten einfach die Bitcoin Miner (RIOT, MARA). Das geht bei Interactive Brokers derzeit für 0,3% p.a. (wird im Bären wohl teurer aber immer noch billiger als die CFDs bei Kraken). Und Miner shorten ist betting against beta. Und im Depot haben wir kein Problem mit der Margin sowie kein Problem mit dem Kontrahentenrisiko. Wenn wir dann noch den Zyklus auf unserer Seite haben, dann wäre das eine durchaus vertretbare Wette.
|
|
|
|
... - Investitionsphase
- Akkumulationsphase
- Rückzugsphase
... PS: Ich habe eine Frau geheiratet, das ist das grösste Risiko, das es gibt  Also ist alles andere erstmal entspannt .... Ich bin noch in der Investitionsphase. Bei der Ehefrau musste ich schmunzeln. aktuell habe ich drei Wetten
❶ meine Bilanz ist Sachvermögen long, Fiat-EUR short
❷ innerhalb des Sachvermögens bin ich in Bitcoin übergewichtet.
❸ Onlineauftritt YT-Kanal, Bitcointalk
Wette 3 kostet viel Zeit für wenig produzierten Inhalt, hier müsste ich mit Technologie oder mit Menschen hebeln
Ich hatte tatsächlich auch überlegt, meine Ehefrau als größte Long-Einzelwette in meinem Leben aufzuführen. Dennach kommt mein Portfolio an Kindern.
Indikatoren ersetzten kein Denken, können einen aber helfen, wann man sich mit einer Sache tiefer beschäftigen sollte.Das mit dem Preis-Trigger hingegen kann ziemlich schiefgehen. Dafür gibt es sogar ein relativ junges Beispiel: der FTX-Crash 2022. Hätte man als Preis-Trigger die verbreitete Annahme genutzt, dass Bitcoin niemals unter ein altes ATH fällt, dann hätte man bei vielleicht $17000 (etwas Toleranz muss sein) verkauft. Sowohl die Annahme "fällt nicht unter altes ATH" als auch "fällt nicht unter Trend * e^-1" waren vorher gültig, danach der erste nicht mehr.
Du hast recht, ein Automatismus zum Verkauf von Bitcoin macht keinen Sinn. Ich habe inzwischen einen Preis-Trigger gebaut. ...
Ich denke der Preis-Trigger - sofern er noch nicht gerissen ist - kann einen im Bärenmarkt beruhigen, dass sich Bitcoin erwartungsgemäß verhält, um weiter an seinen monatlichen Käufen festzuhalten. Zudem habe ich überlegt bei Trend*e⁻0.5 eine volle Position aufzubauen. Diese Entscheidung könnte ich mit von meinem Preis-Trigger abhängig machen. Sofern sich Bitcoin historisch gesehen gewöhnlich verhält, könnte ich eine große Investition tätigen. Ansonsten würde ich eher zu DCA tendieren. Klar, das ganze wird dadurch abgeschwächt, dass du sagst, du gehst teilweise in einen Altcoin statt in Fiat. Hier wäre auch noch zu erörtern, wie stark dieser Altcoin von dem fundamentalen Ereignis betroffen ist. Monero ist dafür ein gutes Beispiel: der Coin hat sich ja deshalb in den letzten Monaten so schlecht entwickelt, weil mehrere Regulierer Druck ausüben, um den Handel auf regulierten CEXes zu untersagen oder zu erschweren. Ist also Regulierung der Grund für den Crash, könnte Monero sowohl gut (da mehr Privacy, d.h. Verfolgung von verbotenen Transaktionen schwieriger) als auch schlecht sein (weil die Regulierungssituation noch schlechter ist als für BTC). Es bleibt also nichts anderes übrig, als den Einzelfall zu betrachten und danach meine Entscheidung zu treffen.
Man muss prüfen, was zu diesem Zeitpunkt legal ist. Sollten Bitcocin und Monero beide illegal sein, hat man durch eine Umschichtung nichts gewonnen. Sollte der Regulator Fiat-Käufe nur umbequem machen, dann wäre eine Umschichtung in Monero eher möglich, aber wegen zukünftiger Wertaufholung von Bitcoin ggf. gar nicht nötig. Aber es wäre dennoch interessant zu sehen, welche Coins in so einem Szenario Bitcoin outperformen. |
|
|
|
TL;DR I develop a warning sign, to warn me about my Bitcoin price model is breaking towards the downside during a bear marketInput: Bitcoin price ( [valuation vs. trend] and [volatility multiple vs. S&P 500]) Output: Traffic light ● red = urgently check, if the Bitcoin price model is still valid ● yellow = keep attention on the traffic light, ● green = no problem with Bitcoin price model detected Why do we use our traffic light? ●●● Risk management, time savings, control of emotions A significant Bitcoin exposure as a % of net worth requires risk management tools. The tools should quickly indicate, if my Bitcoin portfolio allocation is developing according to expectations or I have to update my assumption, my model and possibly my allocation. High volatility in Bitcoin in combination with low valuation could indicate mayor negative news. High Bitcoin volatility during times of high general market volatility (COVID 19) doesn't indicate Bitcoin specific problems. However if Bitcoin's is very volatile while other markets are calm, this could indicate problems influencing our Bitcoin price model. Therefore we calculate the multiple of Bitcoins volatility over the S&P 500 volatility (90 days). We can see Bitcoin's excess volatility is declining as time goes on. If we plot Bitcoin's [excess volatility vs. stocks] vs. [Bitcoin's valuation vs. trend] ...  ... we notice that high Bitcoin valuations are associated with higher volatility, while low Bitcoin valuations are often associated with low volatility. This trend relationship is even clearer, if we only plot data after 2014: The higher Bitcoin's valuation the higher the volatility. The positive relationship between valuation and volatility is uncommon for other asset classes. Usually low valuations are associated with higher volatility (bond spreads or shares). If we look at the S&P 500 (blue line), and adjust the S&P 500 by M2-money inflation (orange line), we can separate the cyclical S&P performance (orange line minus orange dotted line) from the trend performance (orange dotted line).  Interestingly the S&P has 0 trend growth exceeding M2-inflation. The S&P was expensive 2000-2002 and cheap 2009 - 2014. If we plot S&Ps volatility ...  ... we notice expensive S&P is associated with low volatility (green box) and cheap S&P is often associated with high volatility (red box). Very cheap S&P almost never comes with low volatility (purple triangle). So lets get back to Bitcoin.  Since Bitcoin has declining volatility, we have to separate early bear markets from later bear markets. A bear market is Bitcoin price falling e^-0.5 below trend. We separate those bear market in 4 separate bear markets (bear 1, bear 2, bear 3 and bear 4) for each 4 year Bitcoin cycle. We can now take a look at the relationship between Bitcoin valuation and volatility for our 4 bear markets. 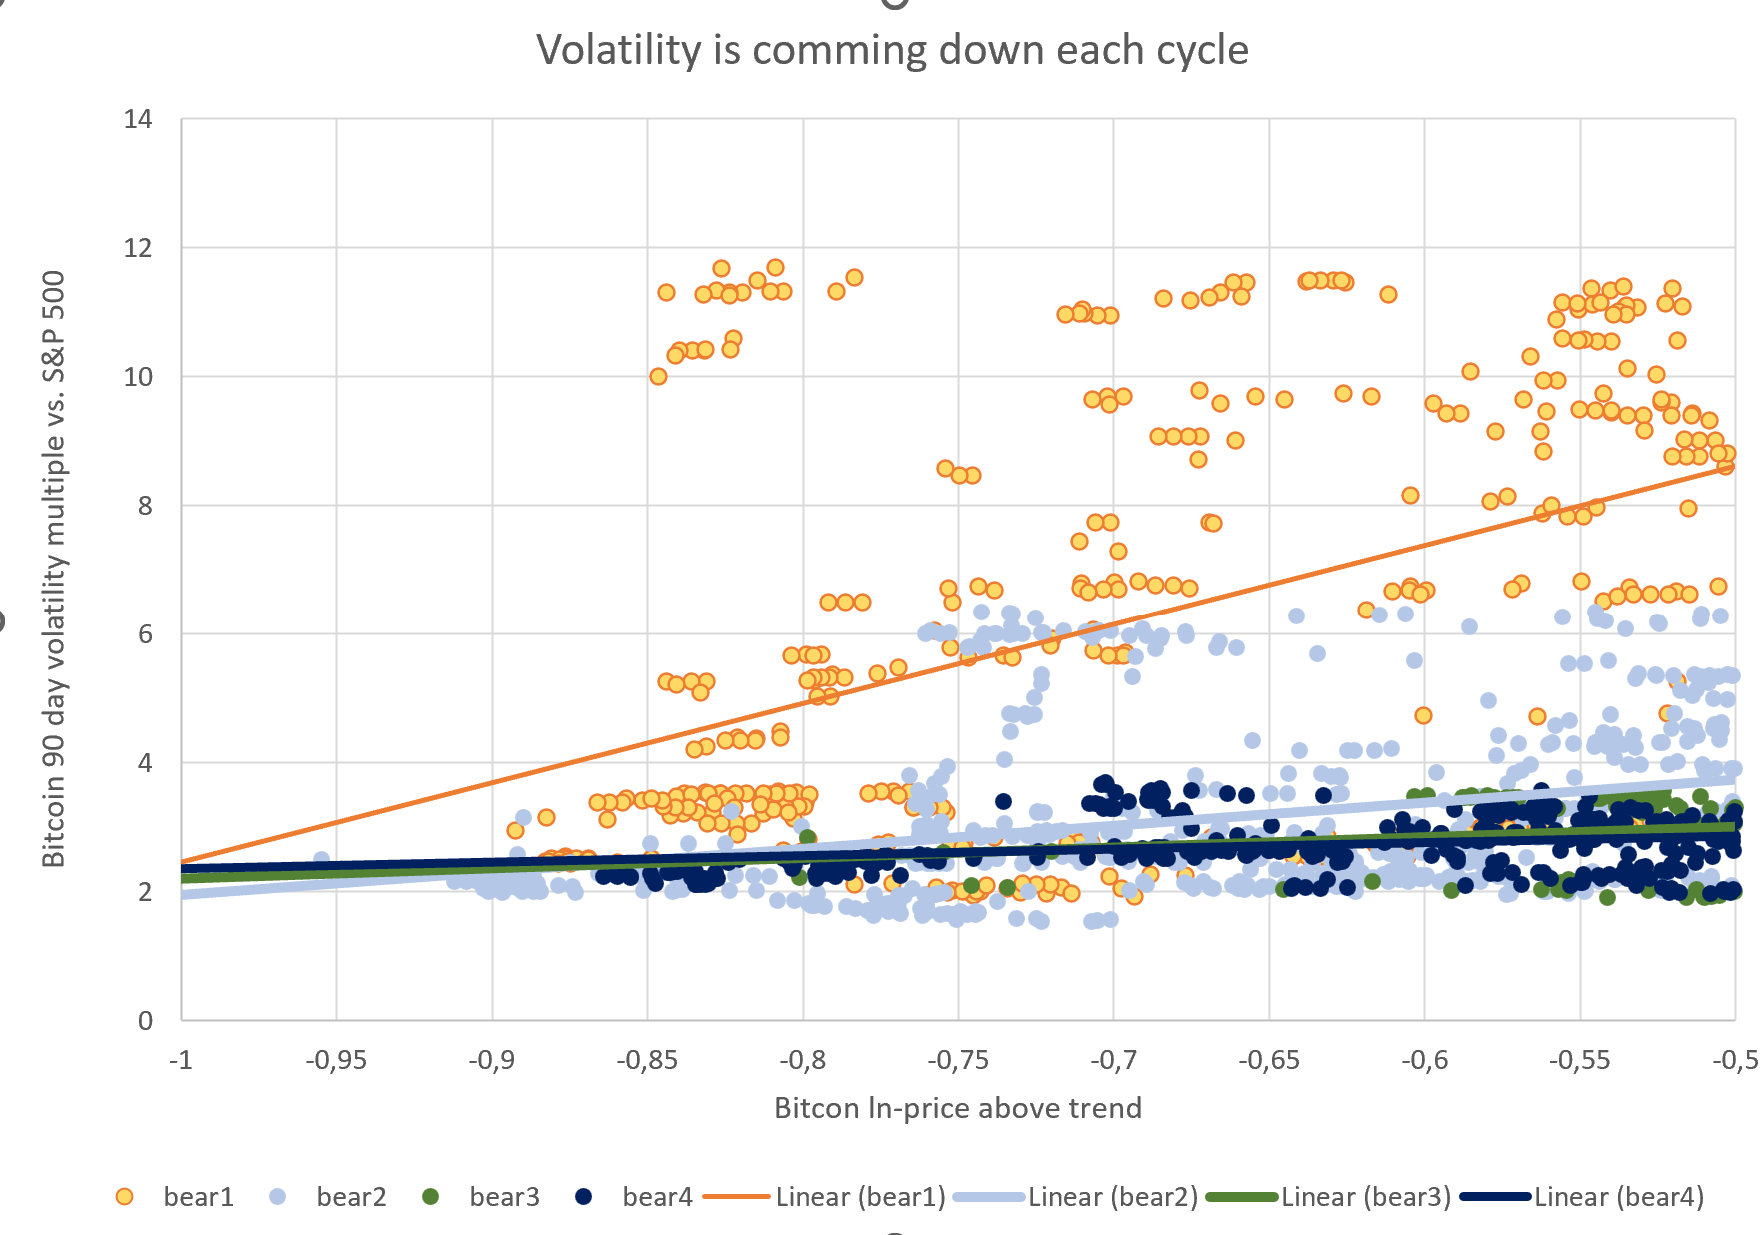 We can observe that the first bear market was the most volatile with subsequent bear markets becoming less volatile. We can also see from the linear trend lines that lower valuation is weakly associated with lower volatility. To get a better picture I make a chart with only the most recent 3 bear markets: 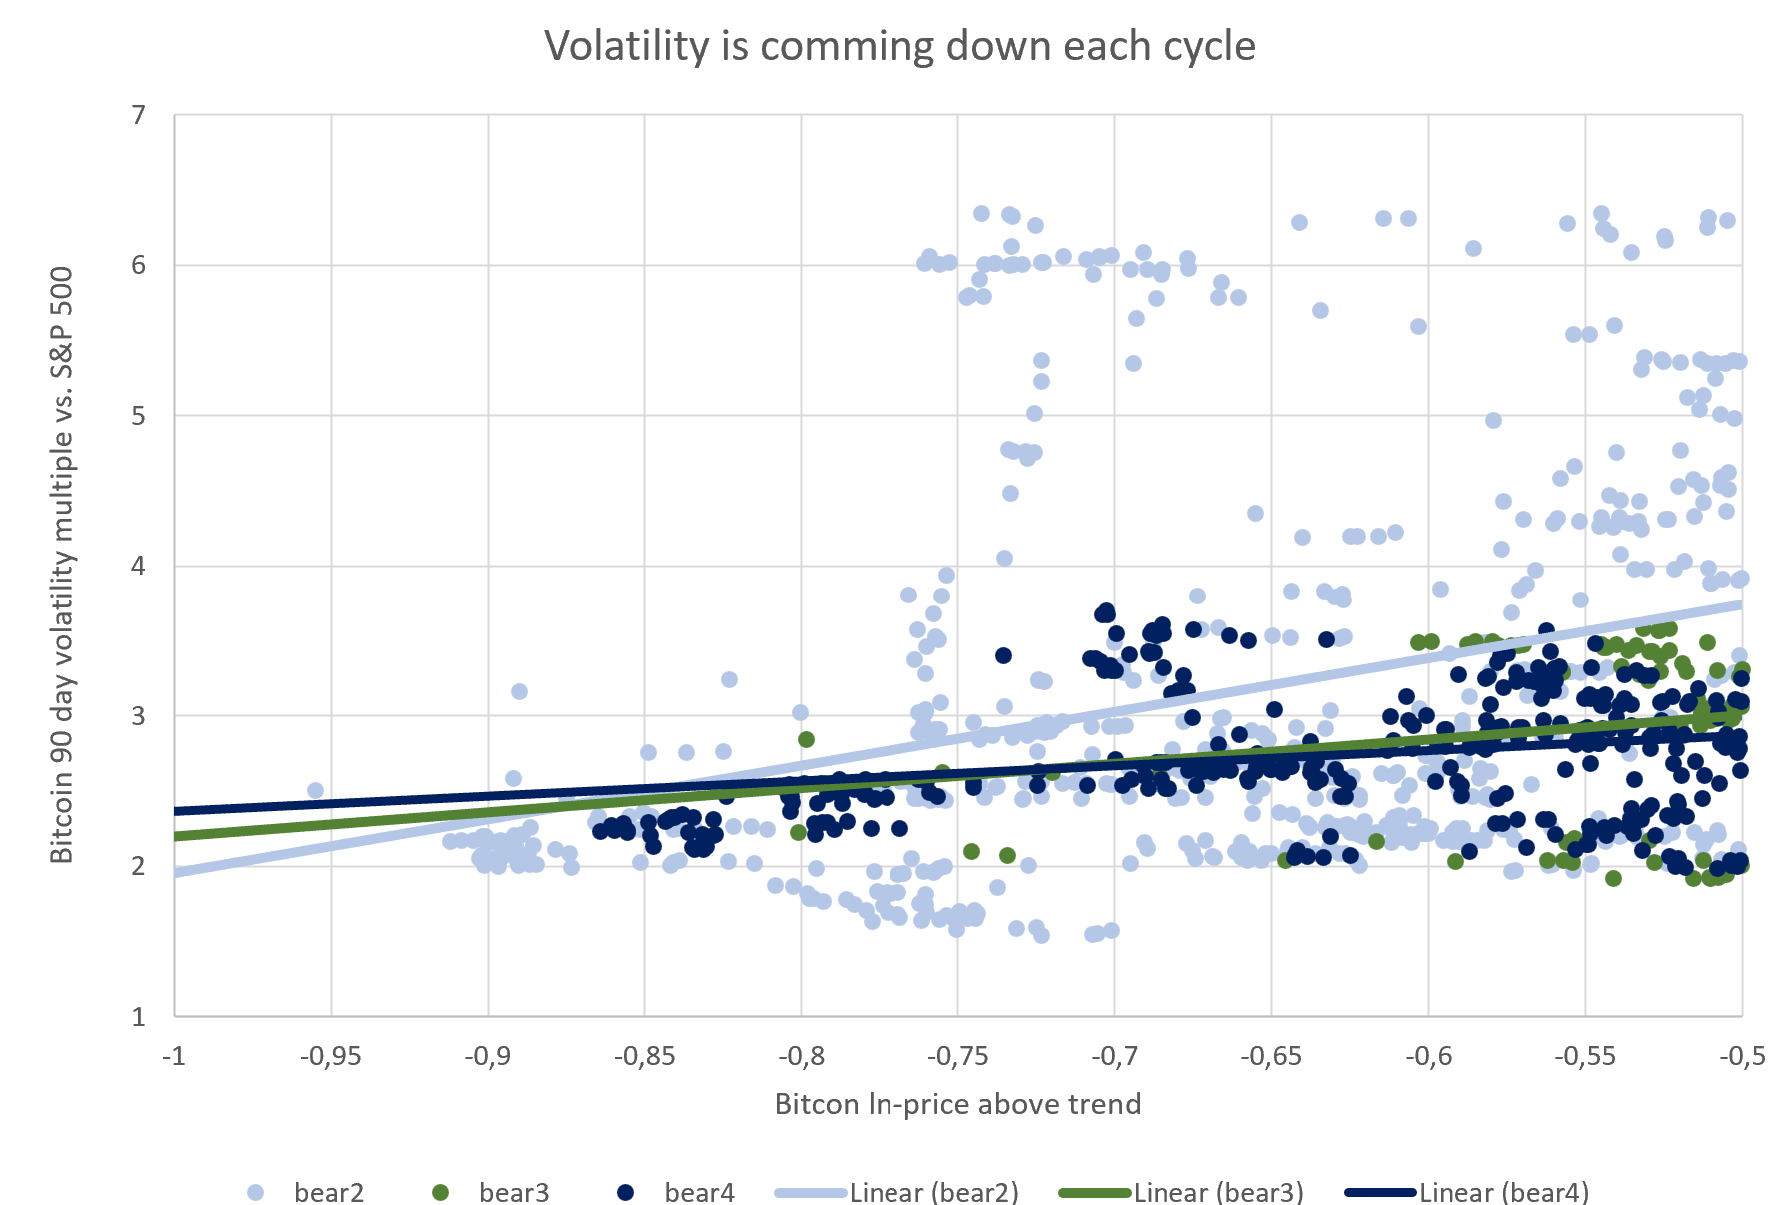 And I made a chart with only the most recent 2 bear markets as well: 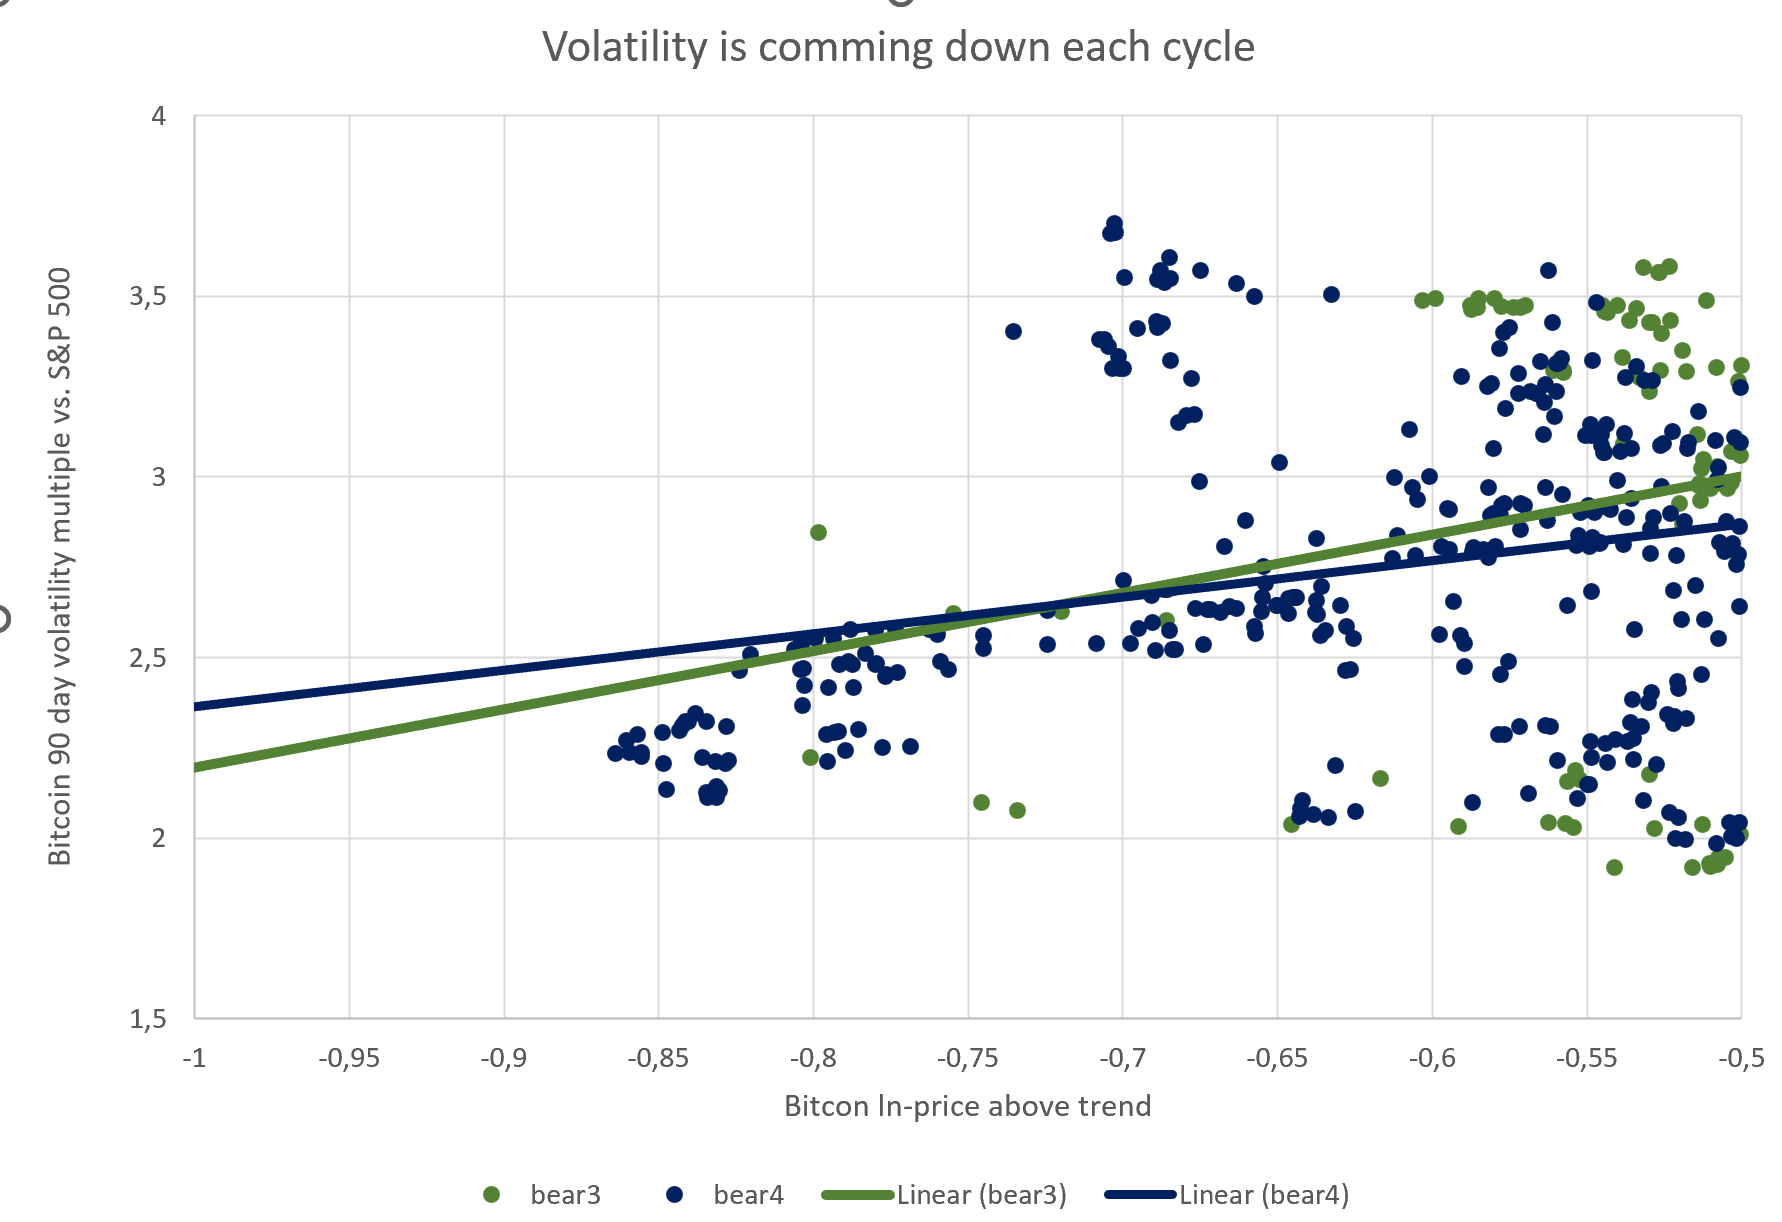 We can observe below average volatility in a severe bear markets (-0,75 and lower). The combination of low valuation AND high volatiltiy was especially unlikely in the past, and I would not expect dots in the "unexpected are" in the future either. 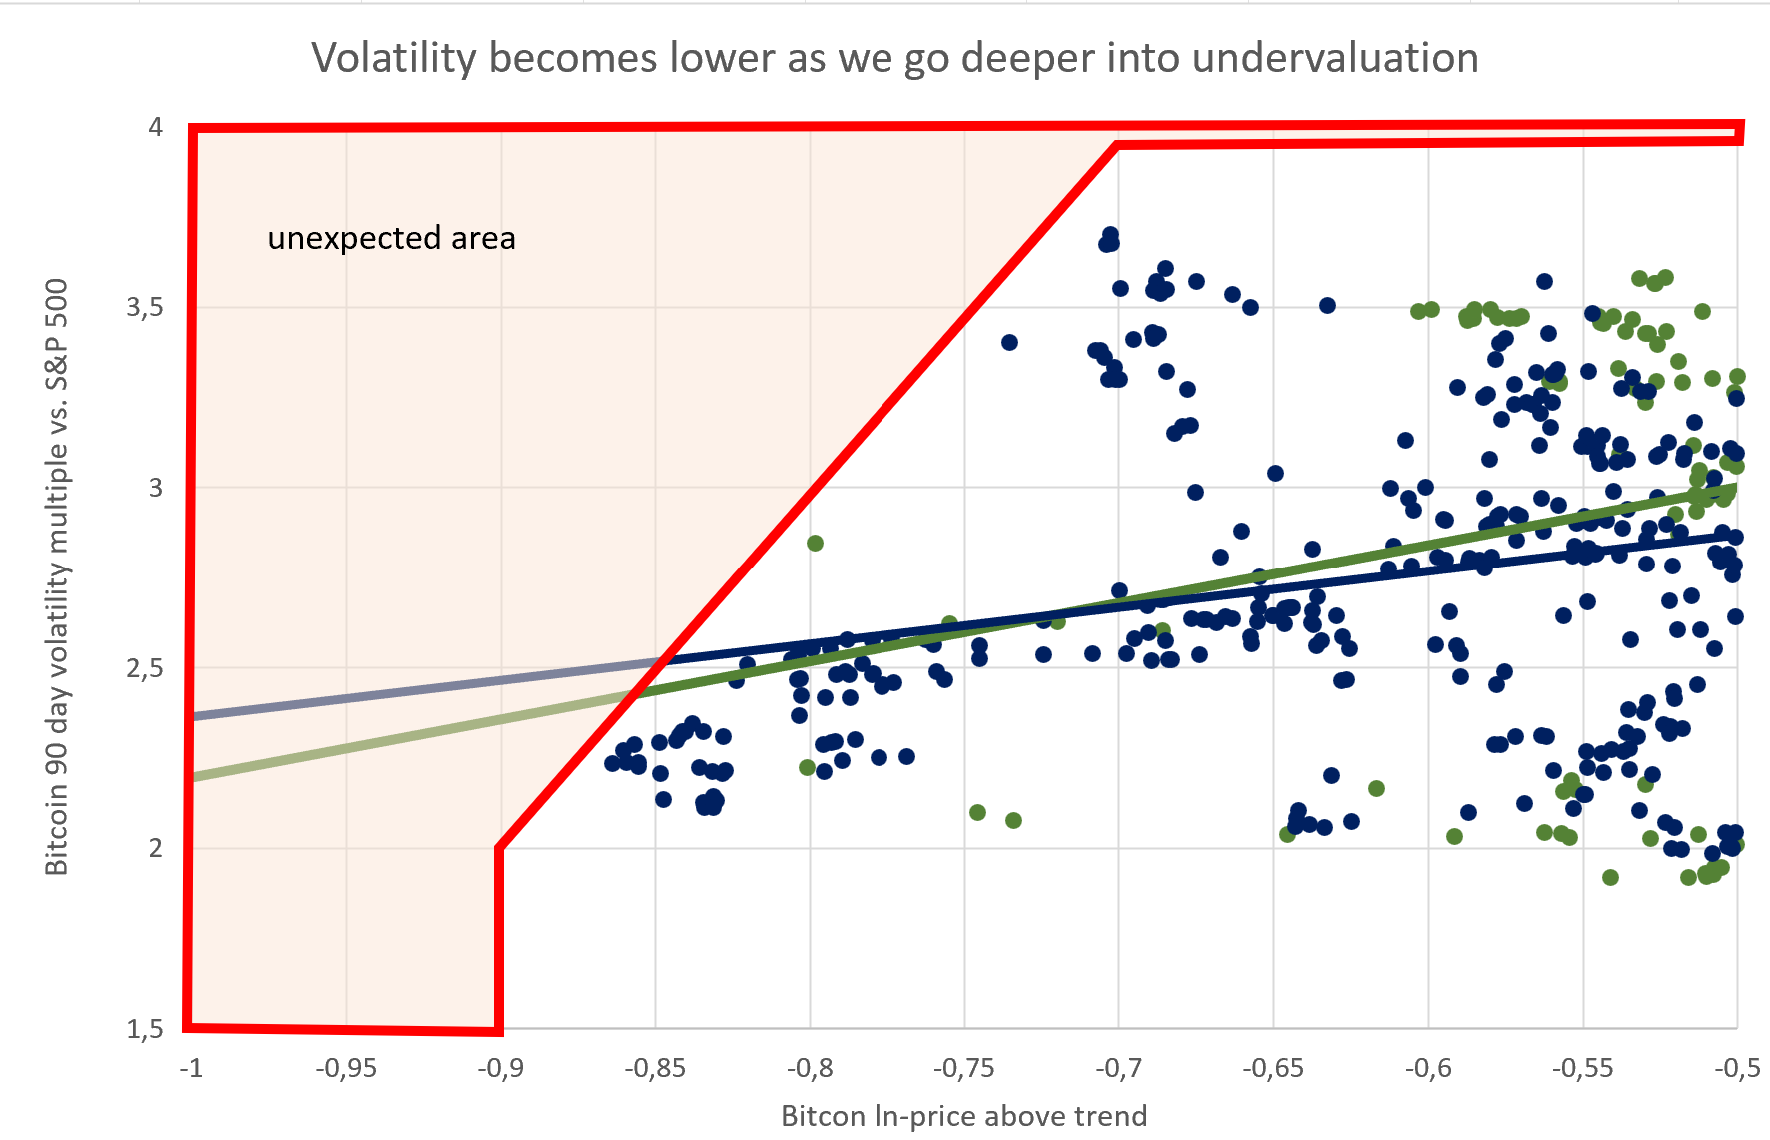 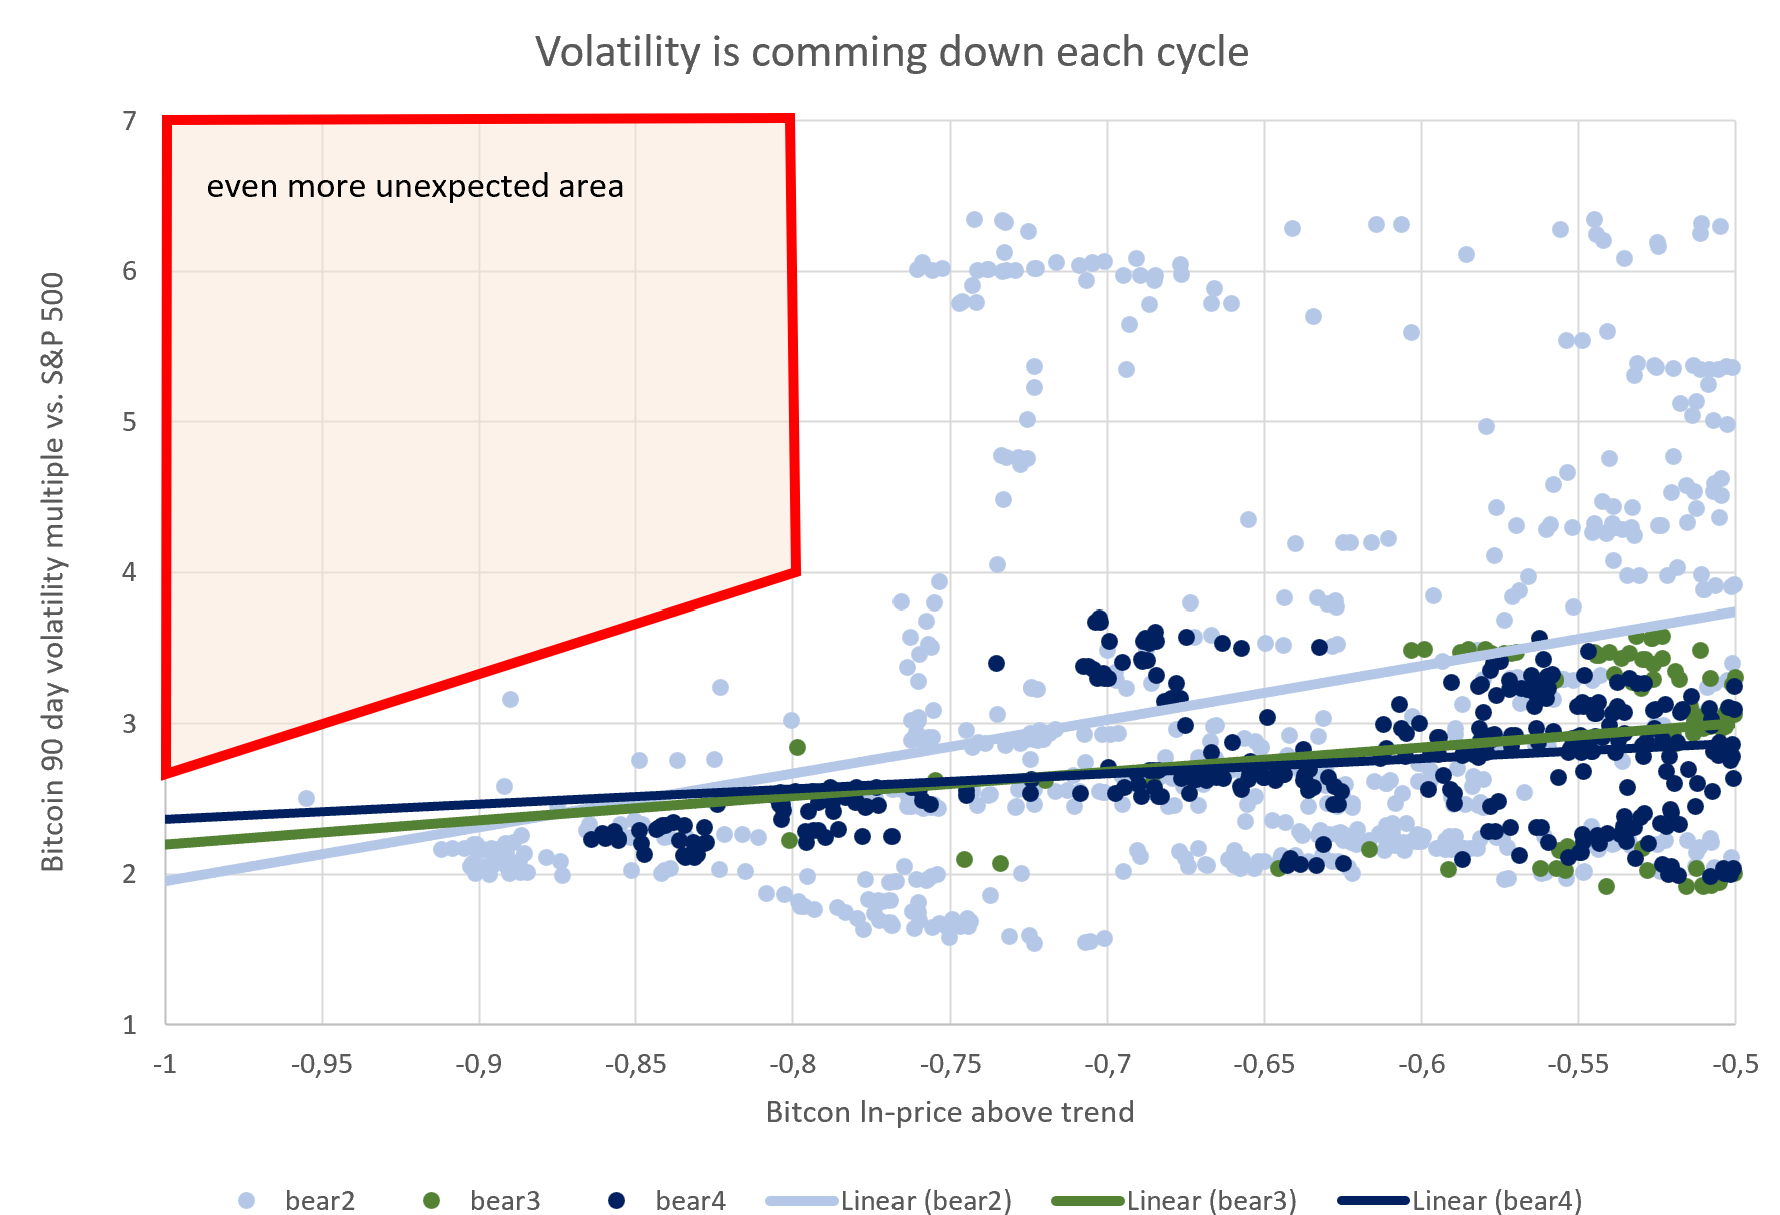 The two red boxes "unexpected area" and "even more unexpected area" are drawn via hand. An alternative visualization would be to mark all points, which were not exceeded during previous 4 bear markets. The yellow line marks the frontier data points in the first bear market. All the points above the yellow line, we have no observation of higher volatility given a certain level of undervaluation. So all observed data points, even the worst data points are below the curve. The 3 other lines (bear 2, bear 3, bear 4) show the worst observed combinations of drawdown and volatility during the respective bear market. 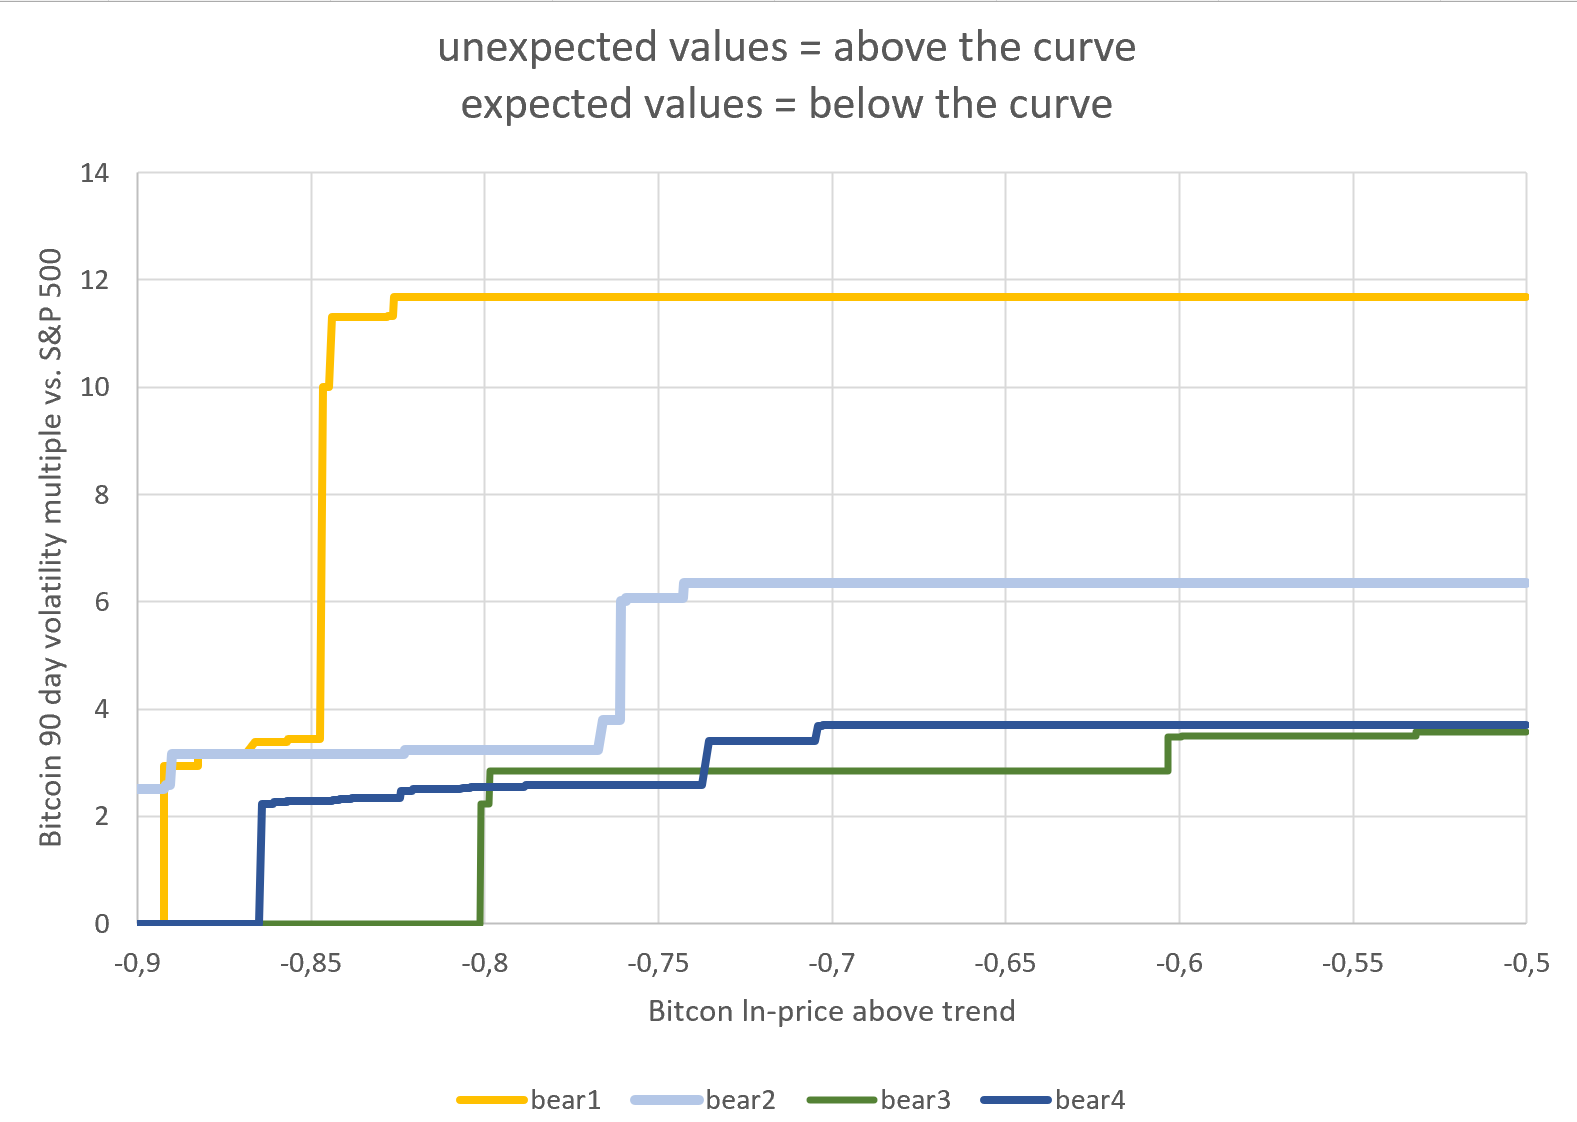 From bear1 to bear2 to bear3 we can see a clear reduction in volatility. The worst data points for bear3 and bear4 however look pretty similar, so I will lump them together in future charts. These frontiers only give us a binary indicator. If our newly observed data point is outside of the frontier (above the curve), our observation is worse than historical data points. If our newly observed data point is inside of the frontier, our observation is within historical observations. To quantify "Know how bad is it?" we have to rank our data points somehow. 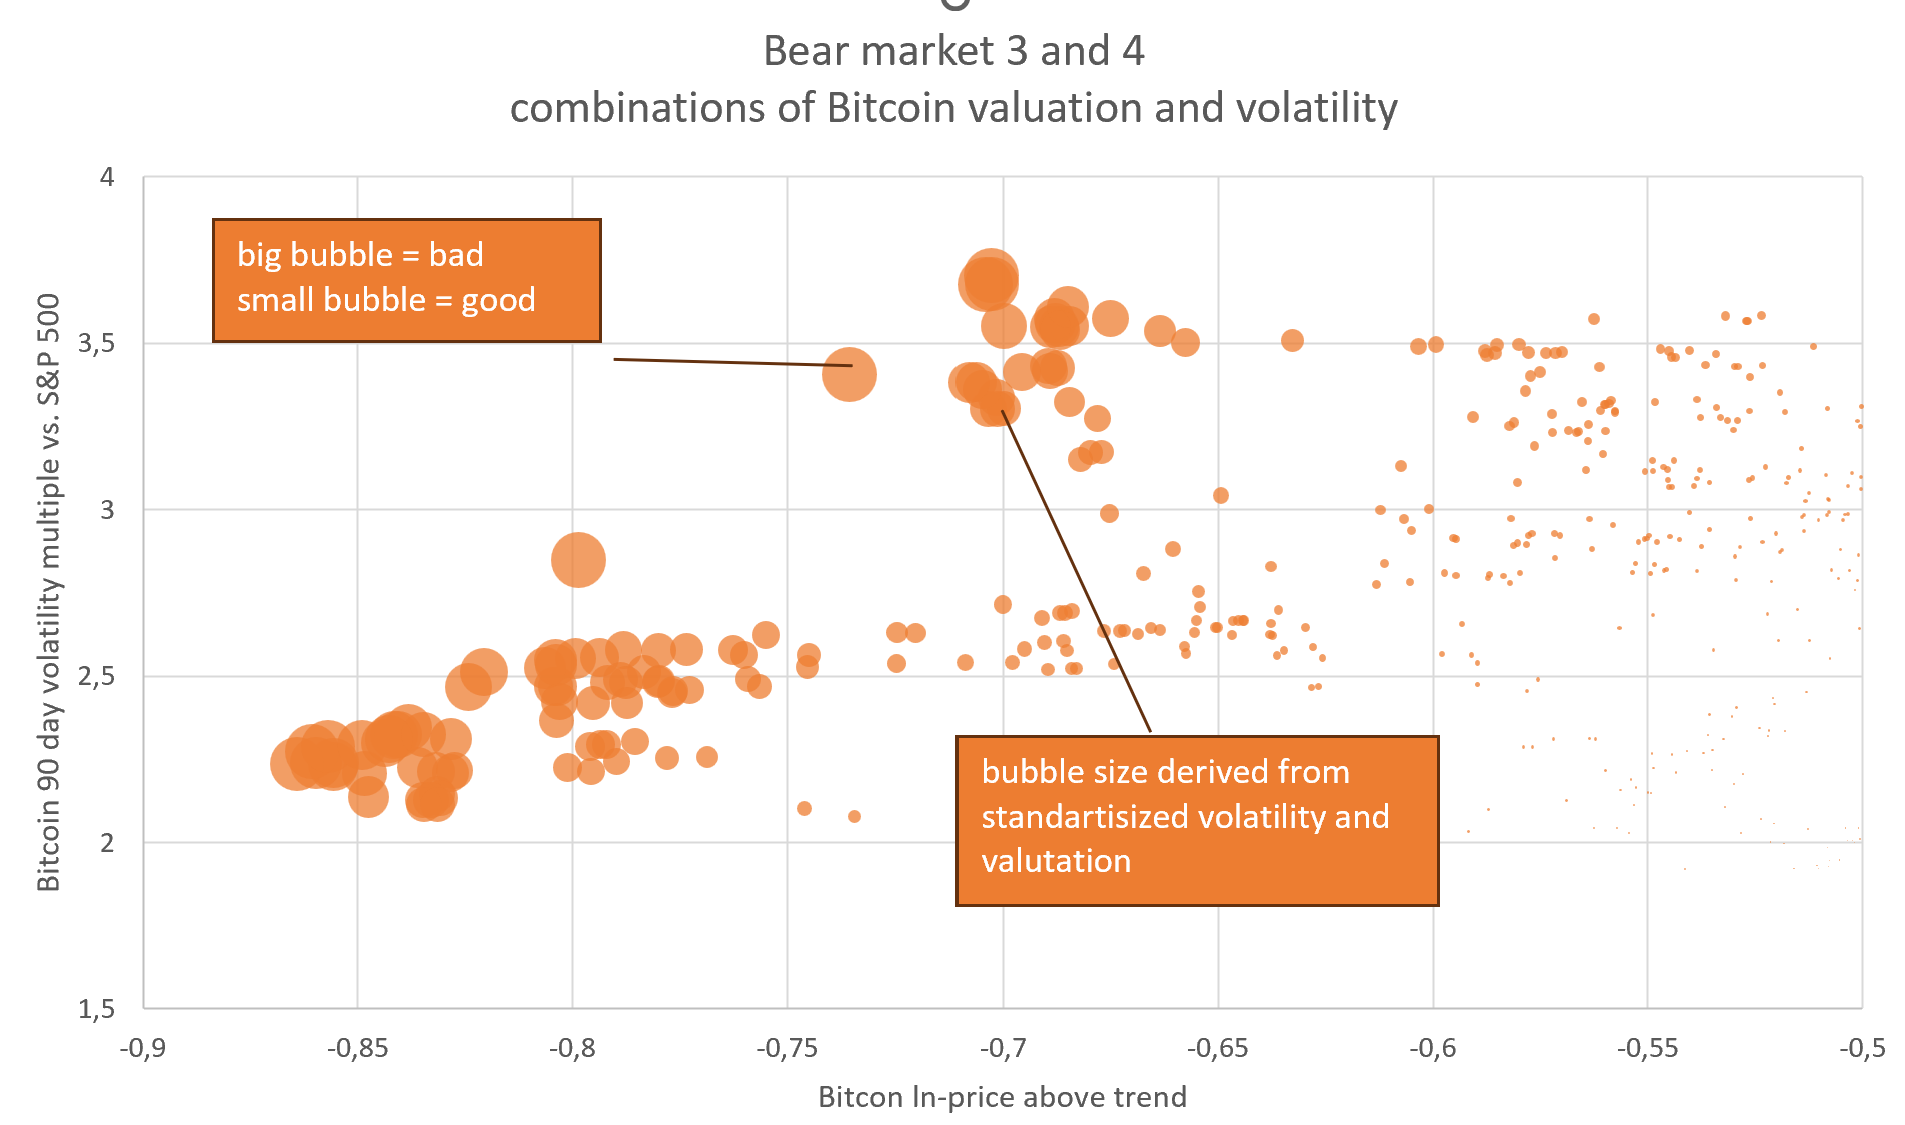 We want to create a metric, which shows (i) high volatility is bad, (ii) low valuation is bad, (iii) a valuation decline from -0,5 to -0,7 much ist less bad than a valuation decline from -0,85 to 1,05 and (iv) a combination of high volatility AND low valuation is worse than any one of both. The valuations during bear market (Bitcoin price below trend) shows many observations of average bear market and fewer observations as the bear market become more extreme. Describing the valuation data in a bear market with a normal distribution seems fitting to me. 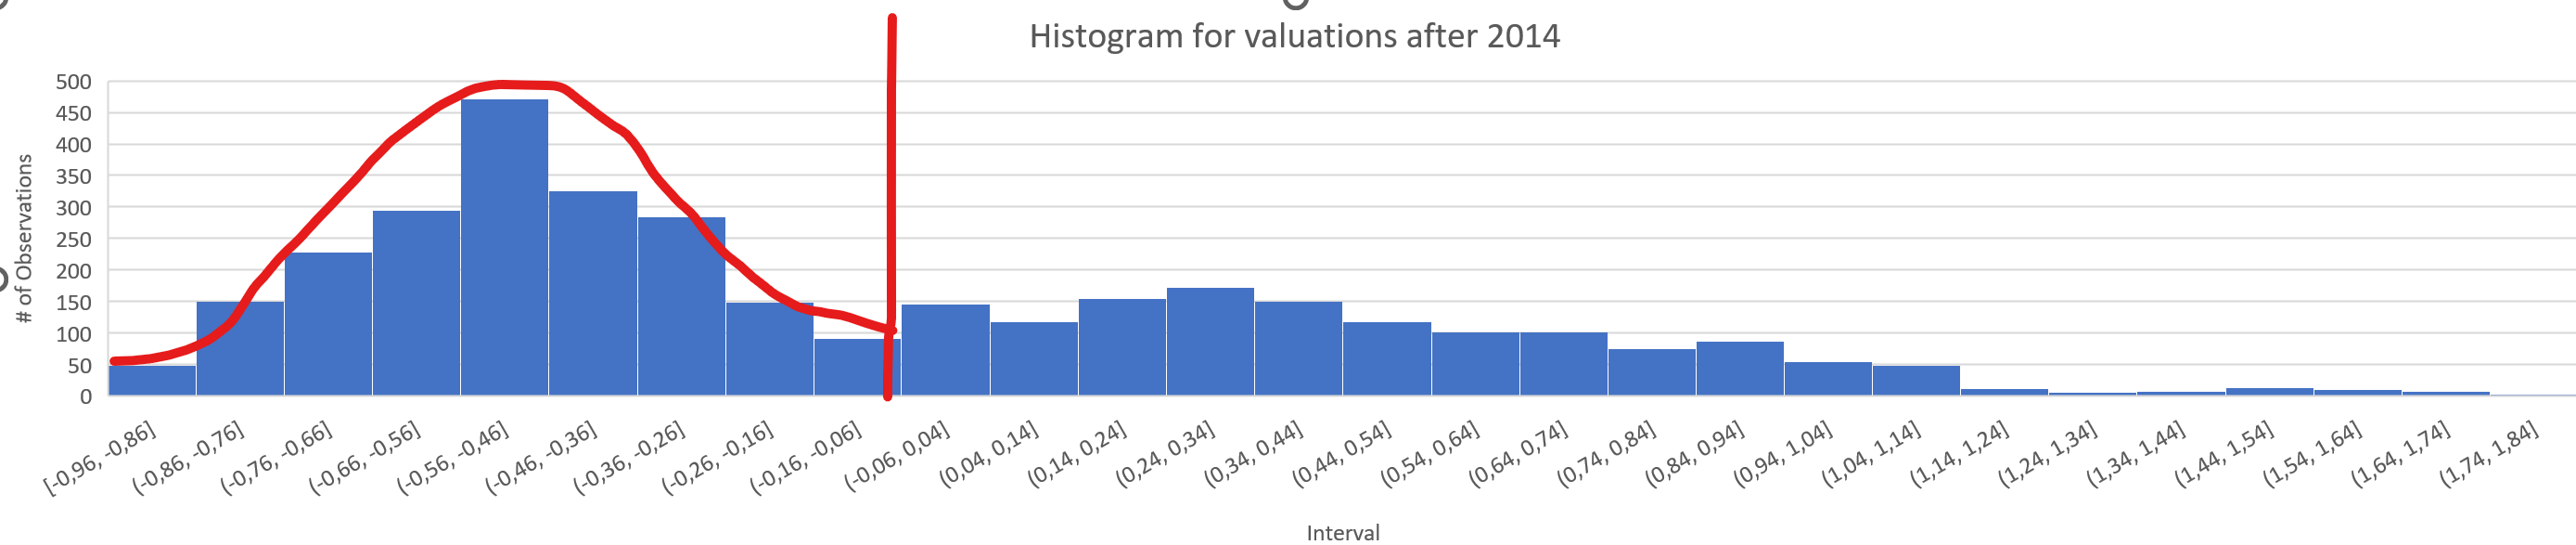 Whereas the the volatility does not suggest a normal distribution. The higher the volatility the lower the probability, with a volatility floor slightly below 2. 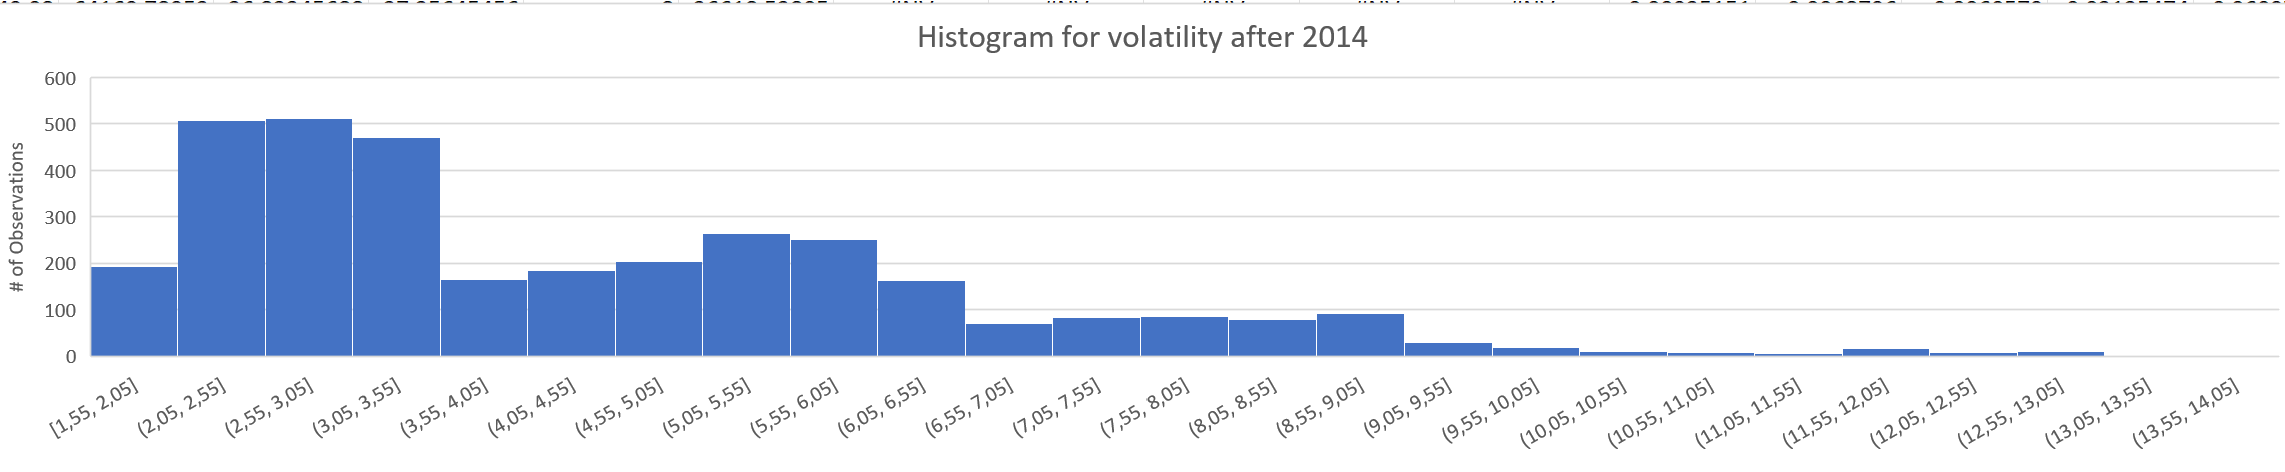 With this information I create a formula for calculating risk scores, which seems fitting to me. The risk score measures the risk of a sudden break in my model to the downside. Each blue dot represents a day in the bear market bear3 or bear4. The size of the dot represents how risky a break down of the model to the downside was for each day. 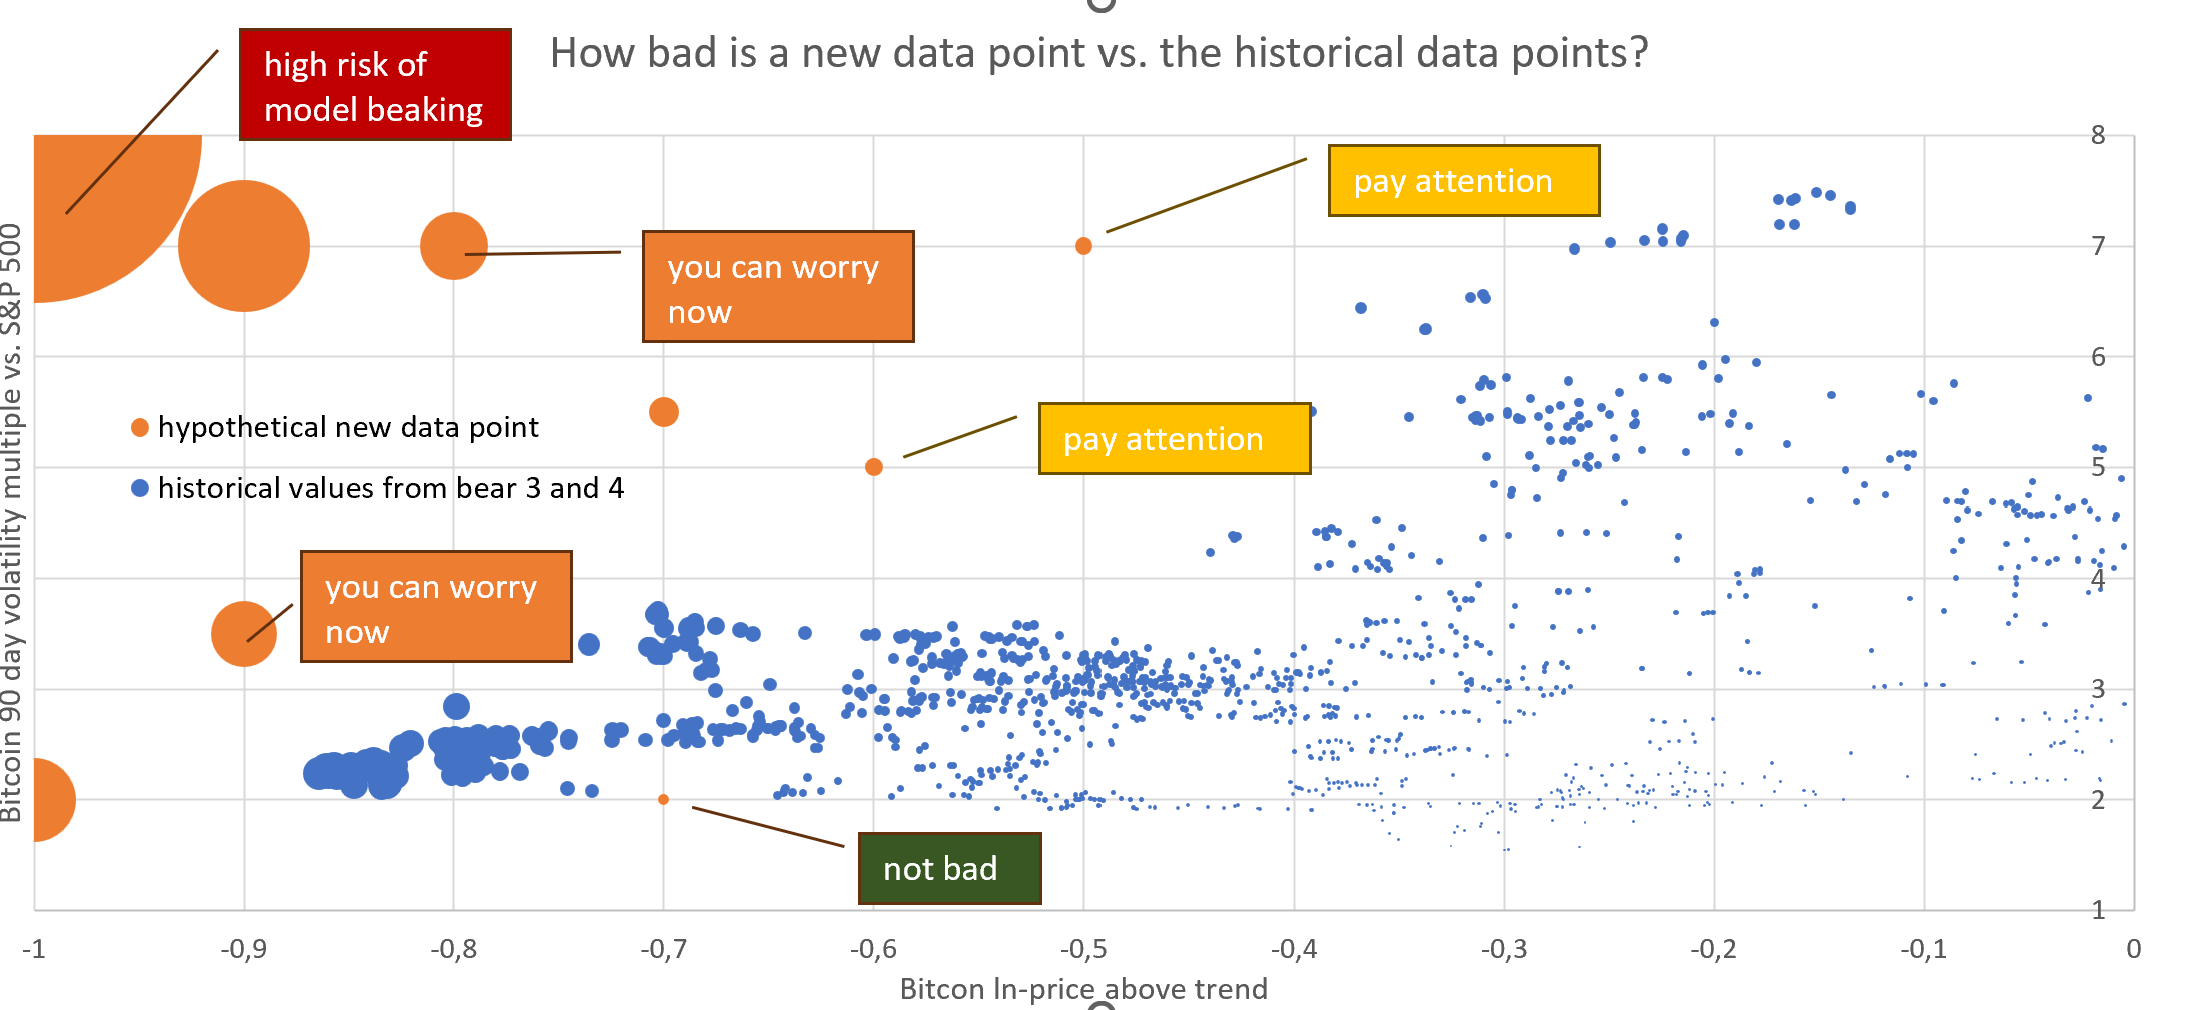 The orange points are hypothetical new data points in the future to show how much risk each data point would have: - A Bitcoin price at trend*e^-0.7 with a volatility of 2, would be low risk, since we have historical data points with am even lower Bitcoin price with higher volatility. This data point would be a green traffic light. - A day of (-0.6, 5) or (-0.5, 7) would be slightly elevated risk. The combination of Bitcoin price and volatility seems a bit high compared to the last 2 bear markets. However Bitcoin was cheaper or more volatile in the past, so we have to pay attention. This data point would be a yellow traffic light. - A hypothetical day of (-1, 2) or (-0.9, 3.5) or (-0.8, 7) would indicate elevated risk of a model break down, since drawdown and volatility exceeds historical data from the last two bear markets. This data point would be a orange traffic light. - A hypothetical day of (-1, 8 ) would indicate a high risk of our model breaking, since the historically Bitcoin price didn't sink so far below trend and the high level of volatility is also very unusual.  The 10 days with the highest risk value were end of 2022 / beginning of 2023, with high drawdown, but only moderate volatility. I added a graph for the risk values since 2011 (blue line). 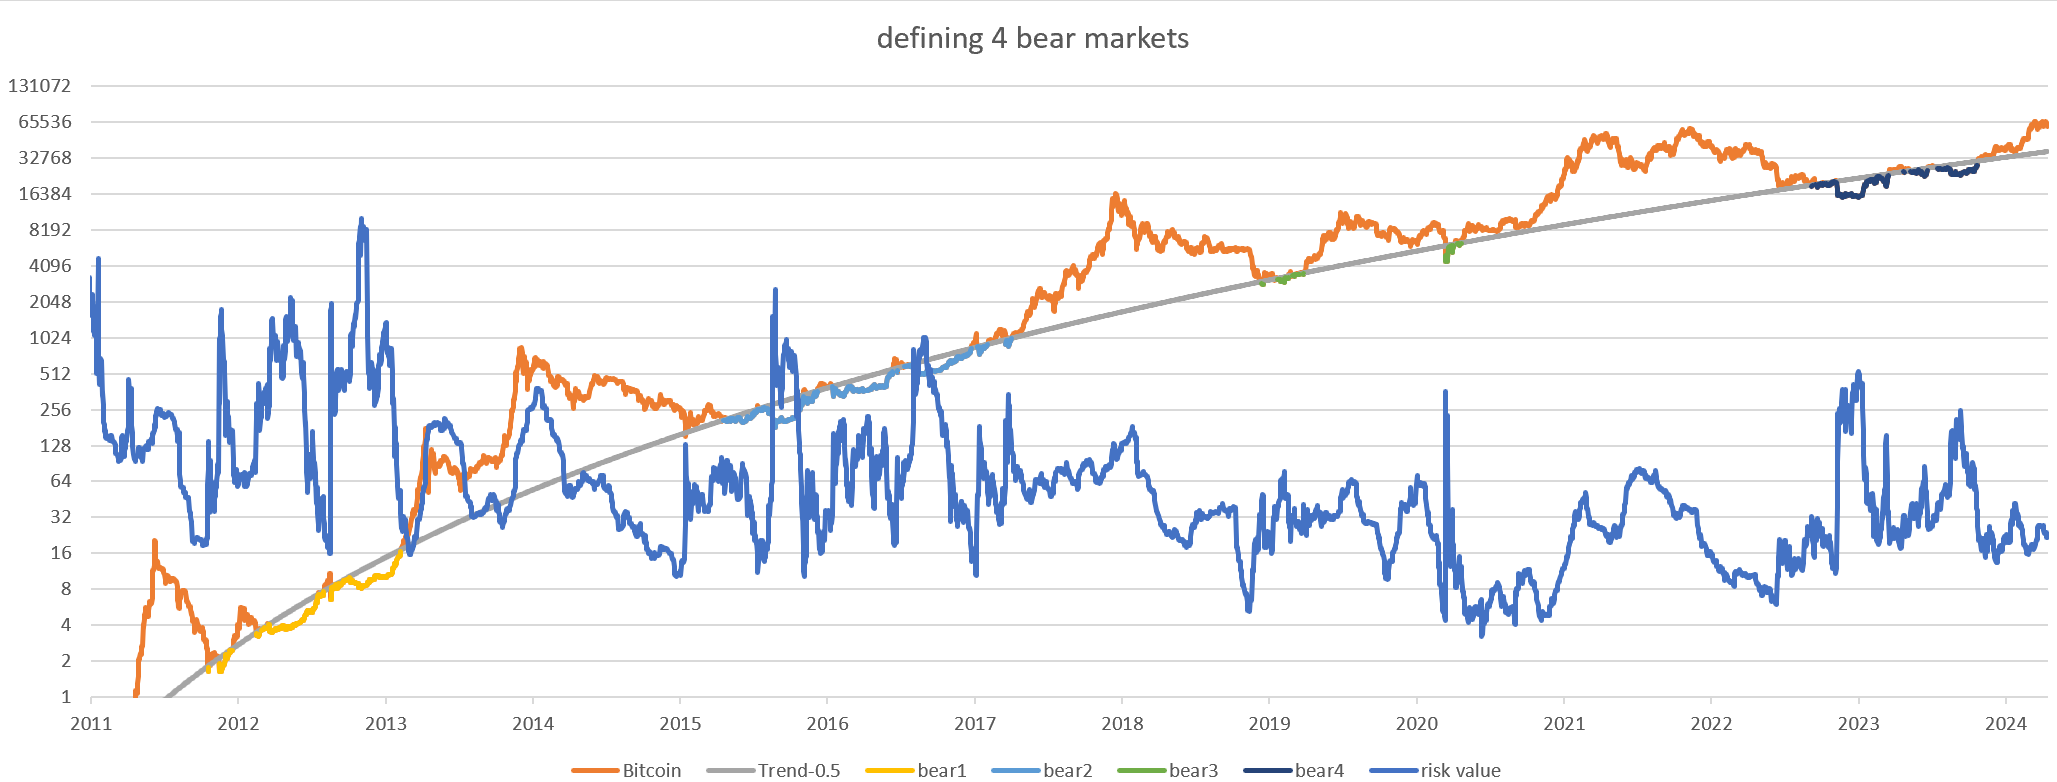 We couldn't have calculated the blue line in real time. However I still plottet the line to get a feeling how the risk value moved during Bitcoin's history. 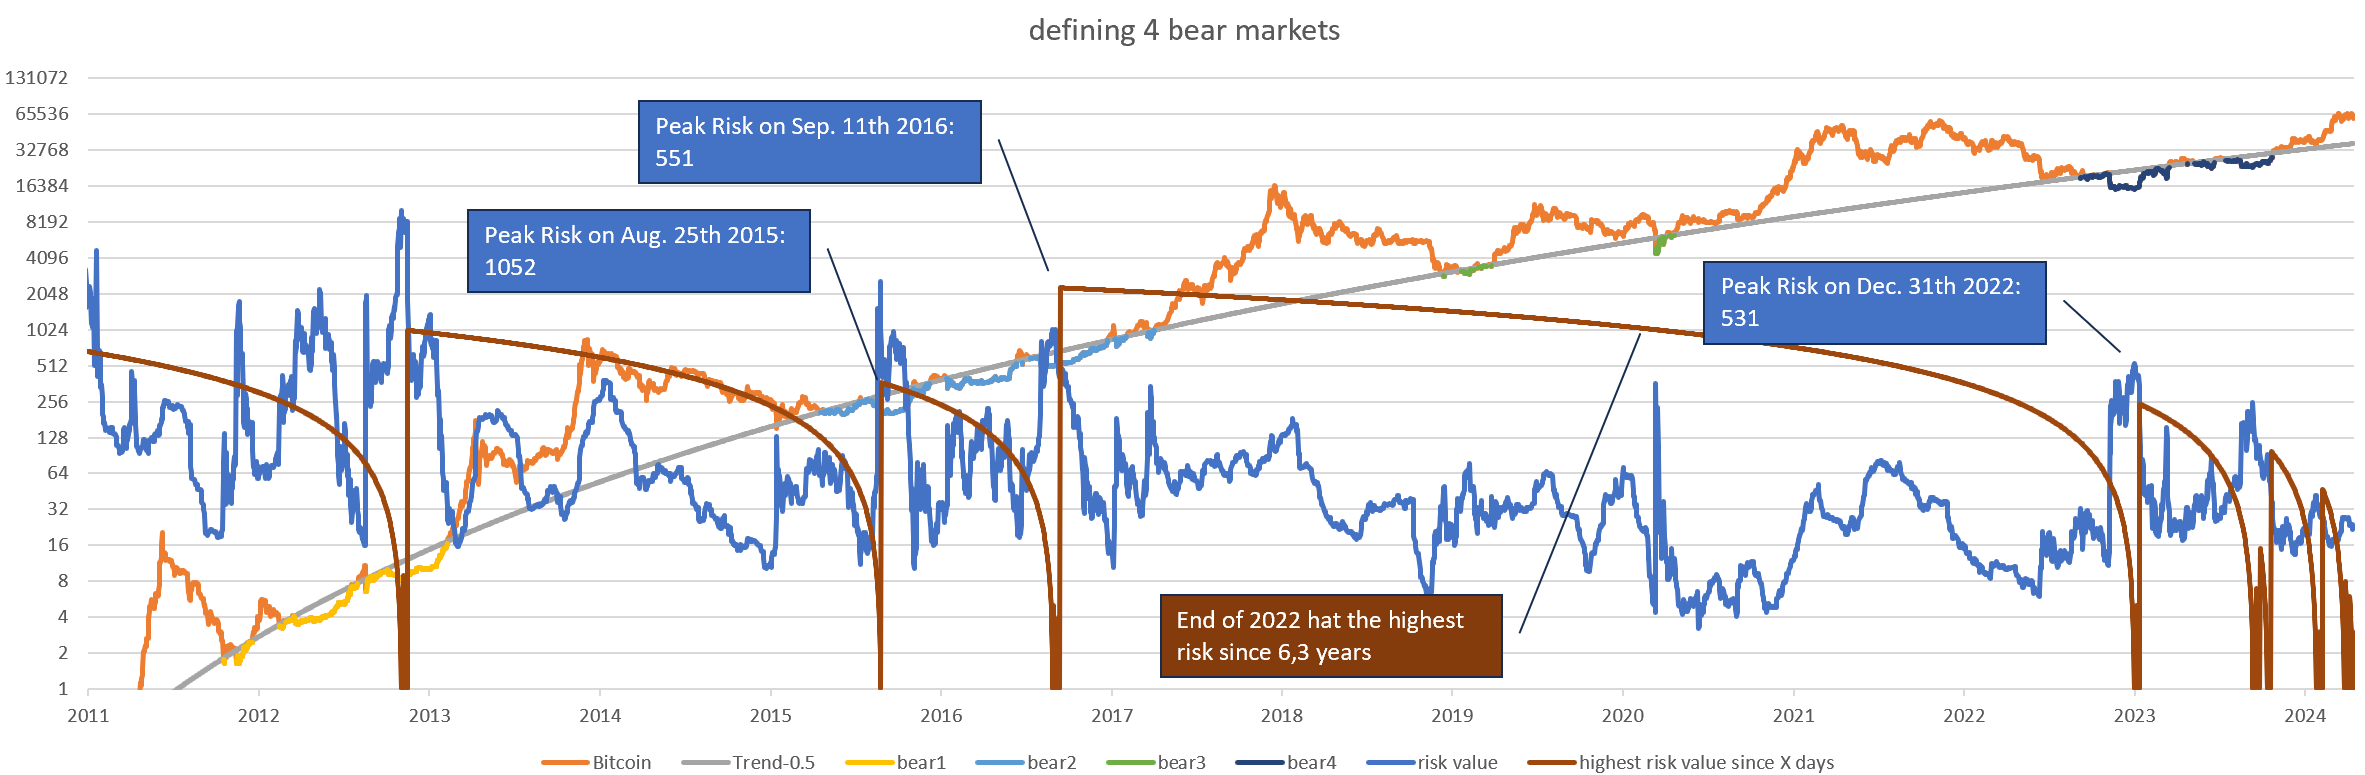 The highes recent risk value was 531 at Dec. 31th of 2022. This was the highest risk value since 551 on Sep. 11th 2016, which was 6.3 years earlier. The absolute risk value has not important meaning for our interpretation. However our risk value in comparison to previous risk values is important for our interpretation. Genrally Bitcoin's risk is declining. If on one day we exceed the risk of multiple prior years, we can for sure say is a sign of elevated risk. 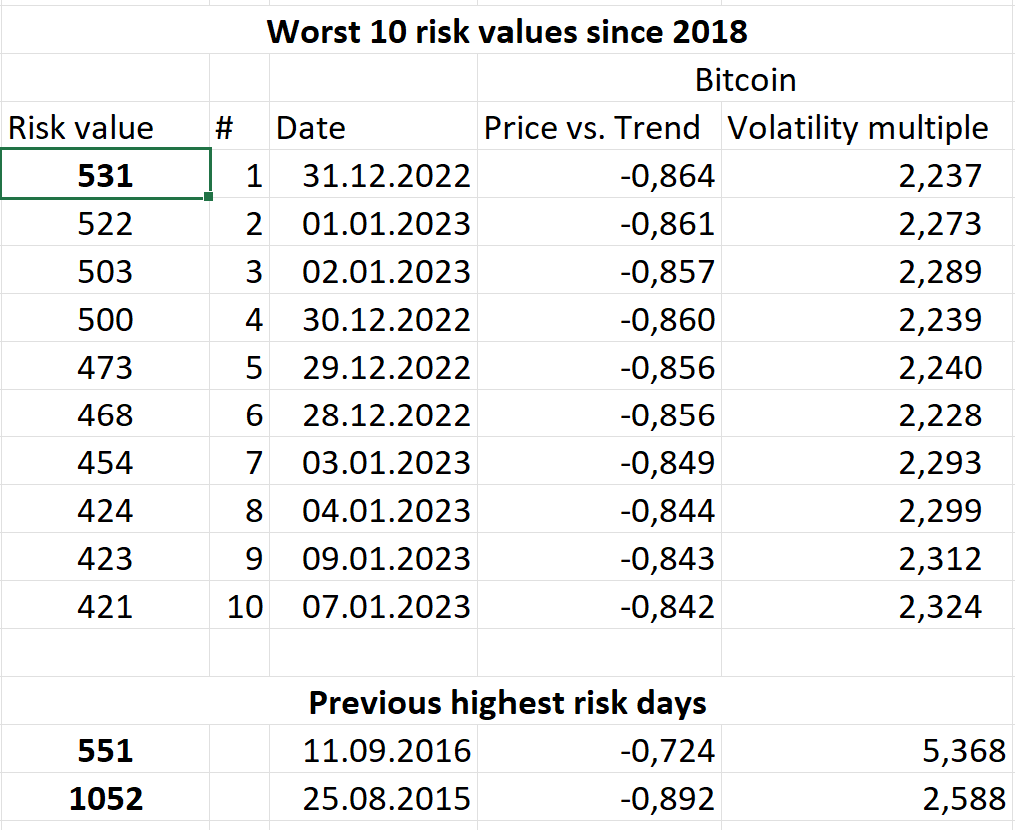 Our historical data enables us to set cutoff points for acceptable risk. I think a risk value 550 does not indicate a break down of our model, since we reached this neighborhood 2016, 2022, 2023 and 2020. A risk level of more then 1000 would indicate possible model breakdown, since we would reach the risk neighborhood of 2015 or even 2013. This would be surprising, since we would exceed the risk values of the previous decade and breaking the trend of decreasing risk in Bitcoin. Since now we have our risk levels (<550 for ● green light, >1000 for ● red light and ● yellow light for 550-1000) we can draw them into our plotter chart. 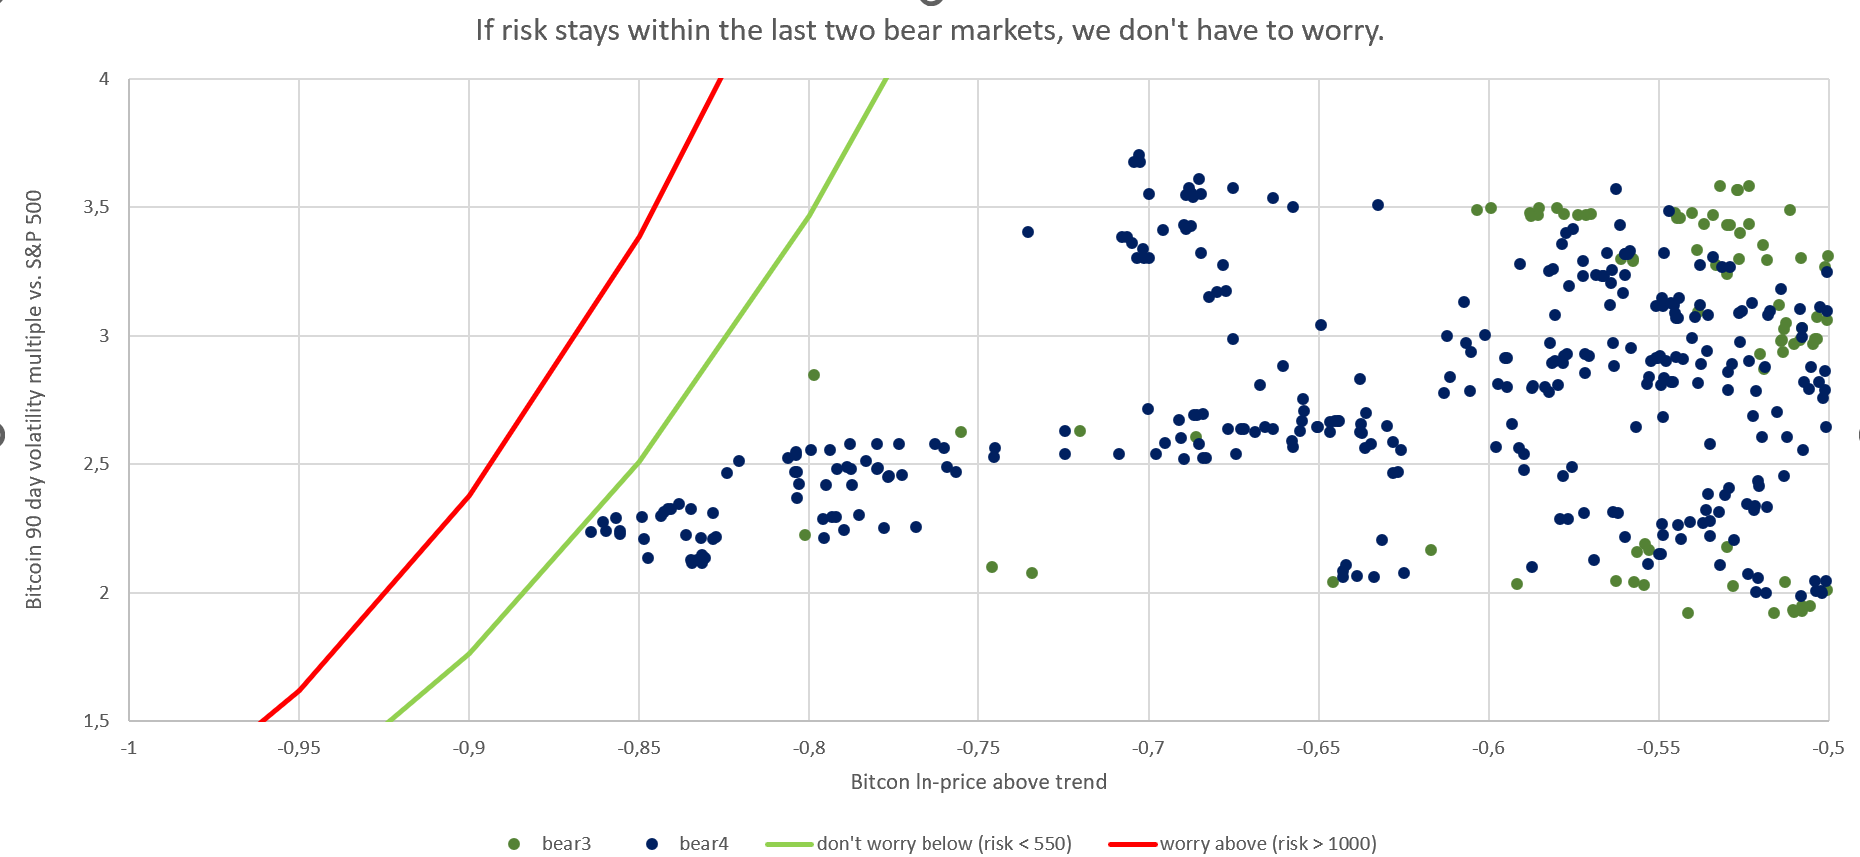 All datapoints for bear3 and bear4 are below the green line, which means we can sleep well and trust in our model (Bitcoin trend price growth and moving around cycle). While everybody is scared, we sleep like a baby. We have no data points above the red line, therefore on no days we had to question our model. Since we calibrated our at bear3 and bear4 this result is not surprising. 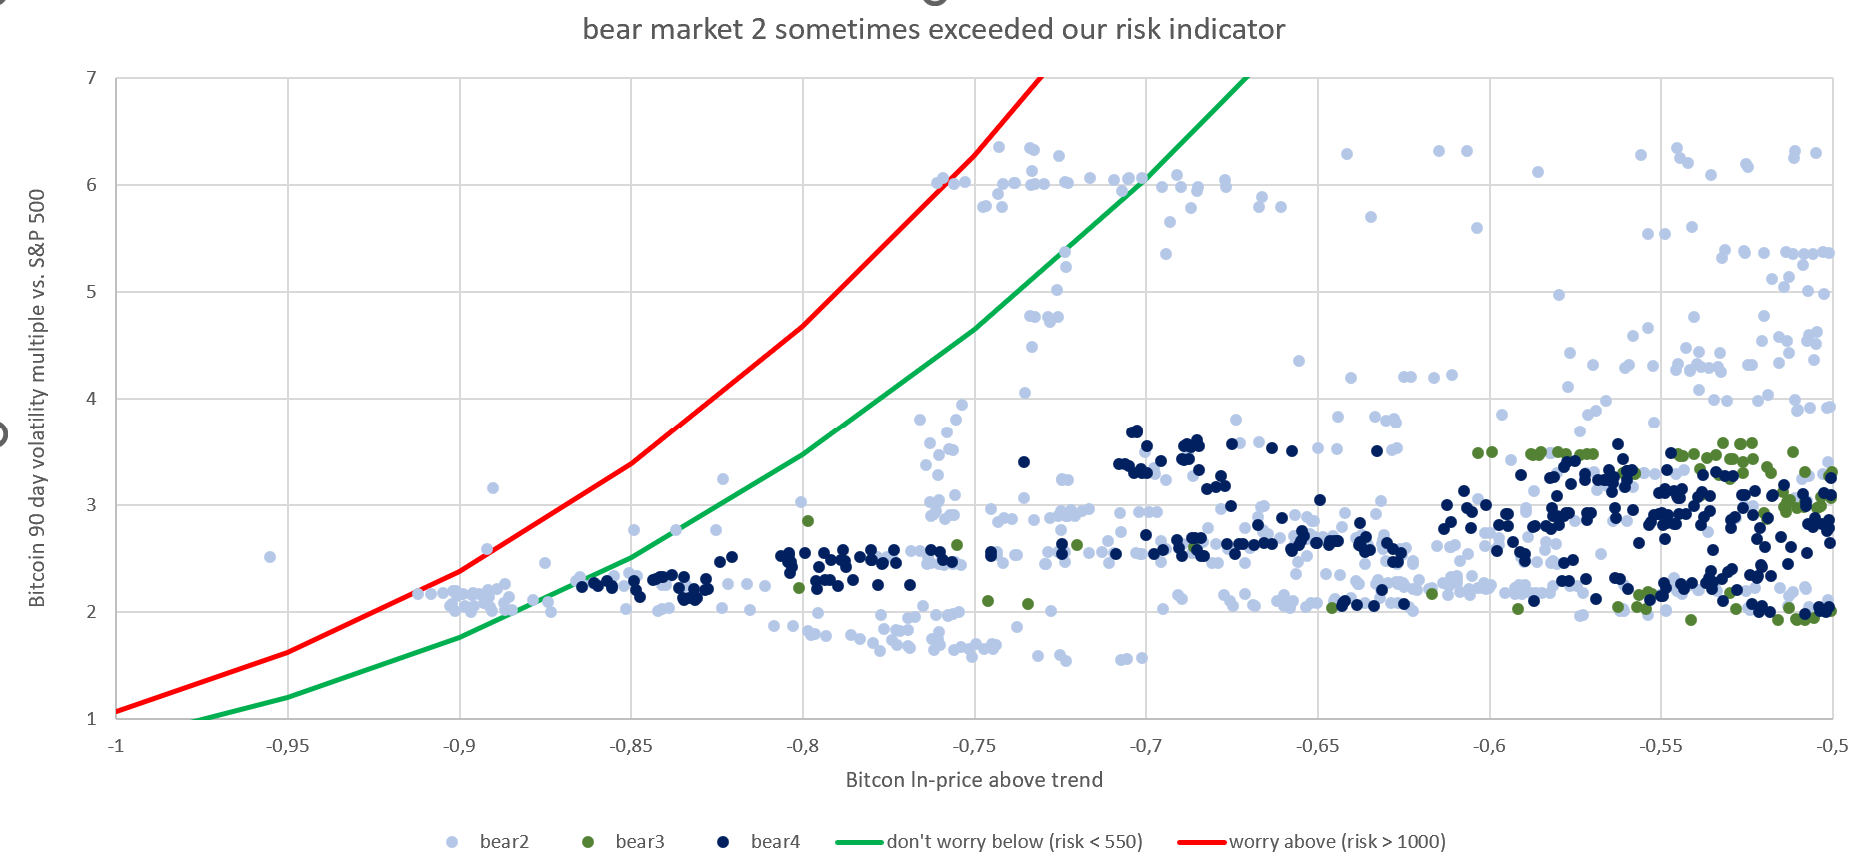 If we add bear2, we can see some dots get a yellow traffic light from us (those dots are between the green and the red line). A few dots are are even north of the red line meaning on those days we should check our model for possible break down. I think this calibration is reasonable, because getting risk values during bear market 5, which were last seen in bear3, should make us cautious. 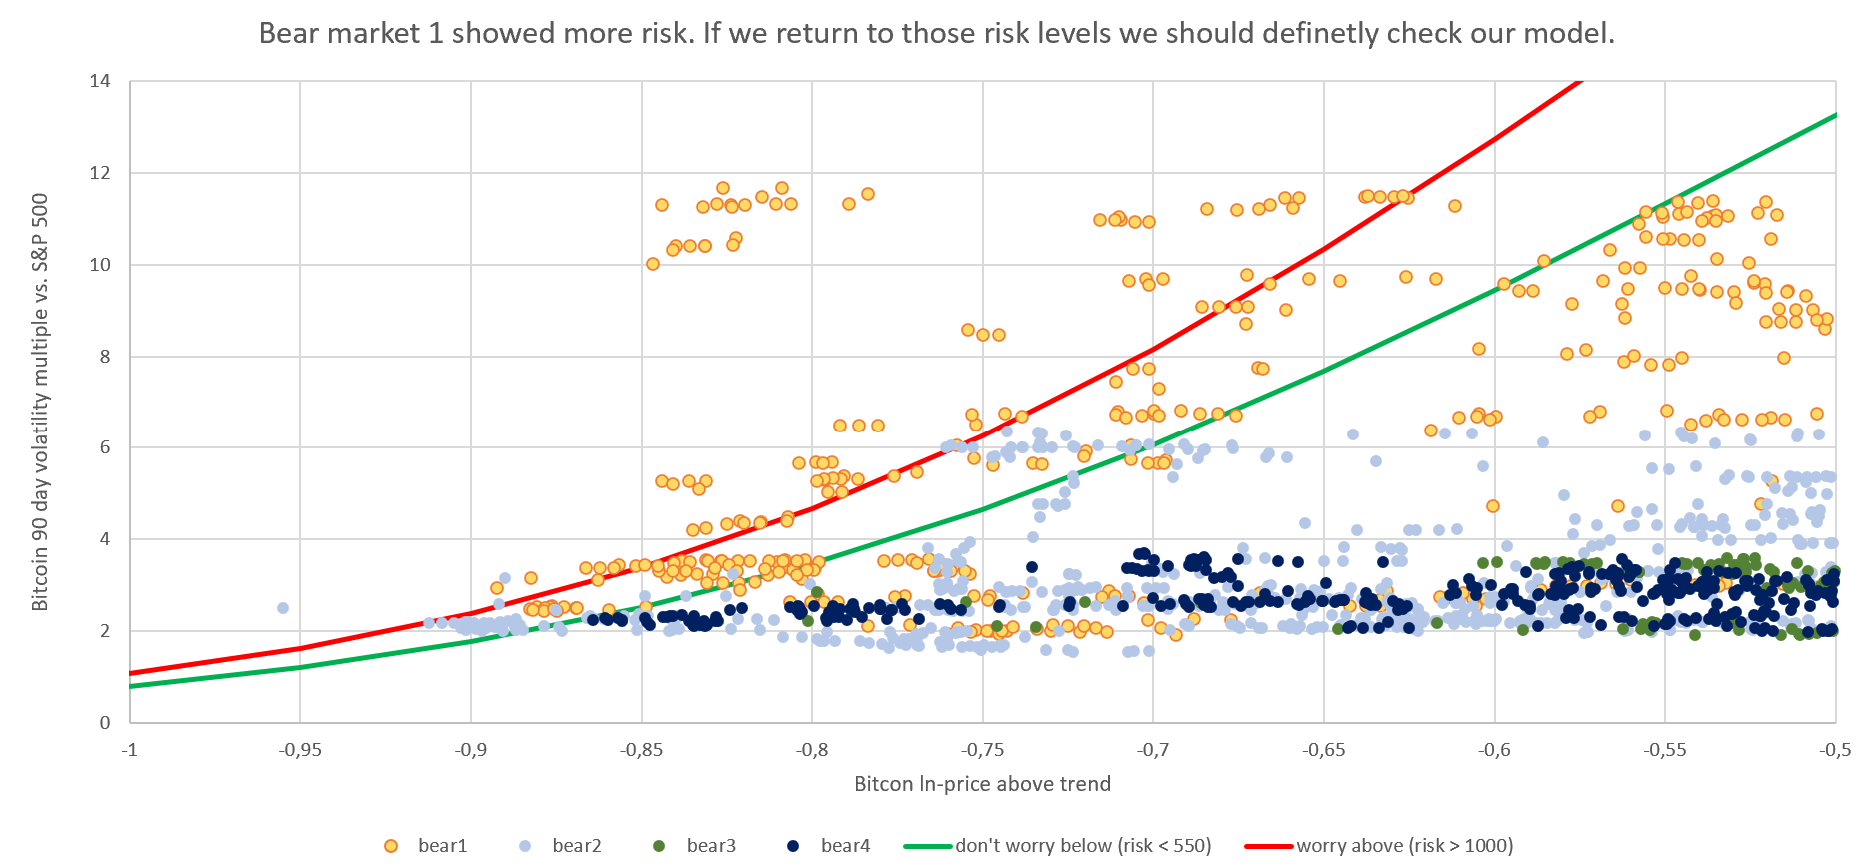 We add bear1, now we see multiple values exceeding our red line. Traffic light is ... - ● red, if Risk_value > 1000 - ● green, if Risk_value < 550 - ● yellow otherwise risk_value = risk_value_below_trend * risk_value_volatility
risk_value_below_trend = 1 / NORMSDIST(z)
z = (Bitcoin_vs_trend - Bitcoin_vs_trend_average) / Standarddeviation(all Bitcoin_vs_trend from bear3 and bear4)
Bitcoin_vs_trend = ln(Bitcoin_price) - ln(Bitcoin_price_trend)
risk_value_volatility = (Standarddeviation(daily Bitcoin price returns from previous 90 days) / Standarddeviation(daily S%P 500 price returns from previous 90 days)^2
|
|
|
|
TL;DR: Best to buy Bitcoin cheap and with low volatility. If Bitcoin becomes cheap in the future, but has high and rising volatility, despite low volatility in other asset classes, we might reconsider using our model.Our currently useful model ...Our model suggest we can outperform simple DCA, if ... (i) we become more cautious, if the Bitcoin becomes expensive (price exceeds Trend +750 days), (ii) we take a full position, if Bitcoin becomes cheap (price = Trend * e^-1) (iii) and otherwise simple DCA into Bitcoin. ... should not mislead us down the road.If we decide how much Bitcoin we buy or own based on this model, we should be reasonable confident, that our model continues to be correct. Every financial model will eventually break, therefore we should not follow our model blindly. There would be little pain for us, if Bitcoin price is outperforming our pretty optimistic model. Therefore we should be especially careful on the downside, if we suspect our model is breaking towards the downside. Hints, that our model is breaking towards the downside:a) Since 2011 the Bitcoin price never declined blow Trend*e^-1, falling below Trend*e^-1 or even Trend*e^-1.2 would a sign that our model is breaking. b) Another sign could be unusually high Bitcoin price volatility. So what kind of volatility would be unusual for Bitcoin?
Initially the Bitcoin price was pretty volatile (2011-2014). In general Bitcoin becomes less volatile as time goes on. 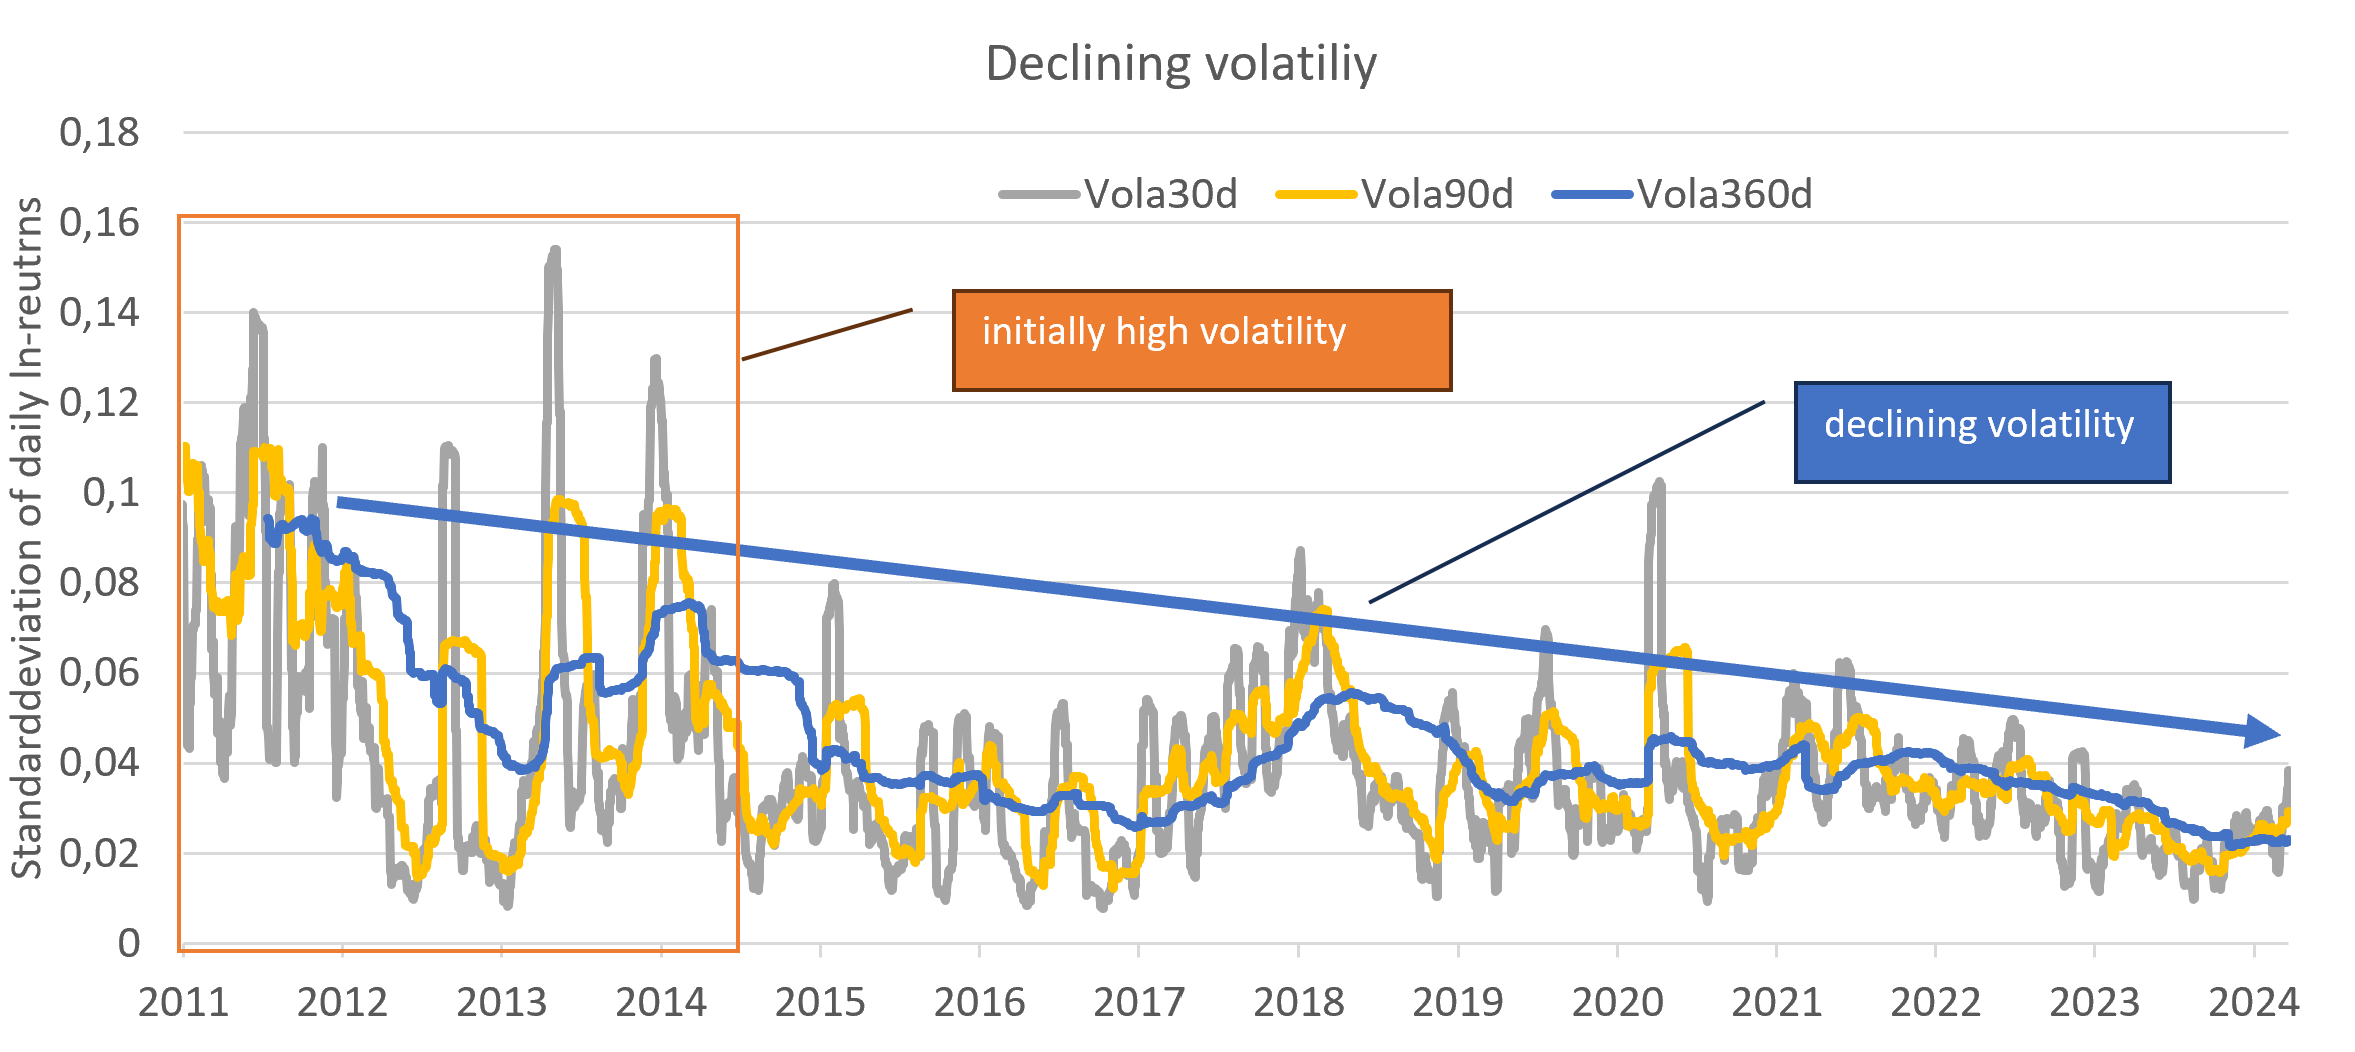 If you plot the Bitcoin price vs. Trend (x-axis) vs. the volatility (y-axis) you notice that Bitcoin is more volatile in the bull market than in a bear market. 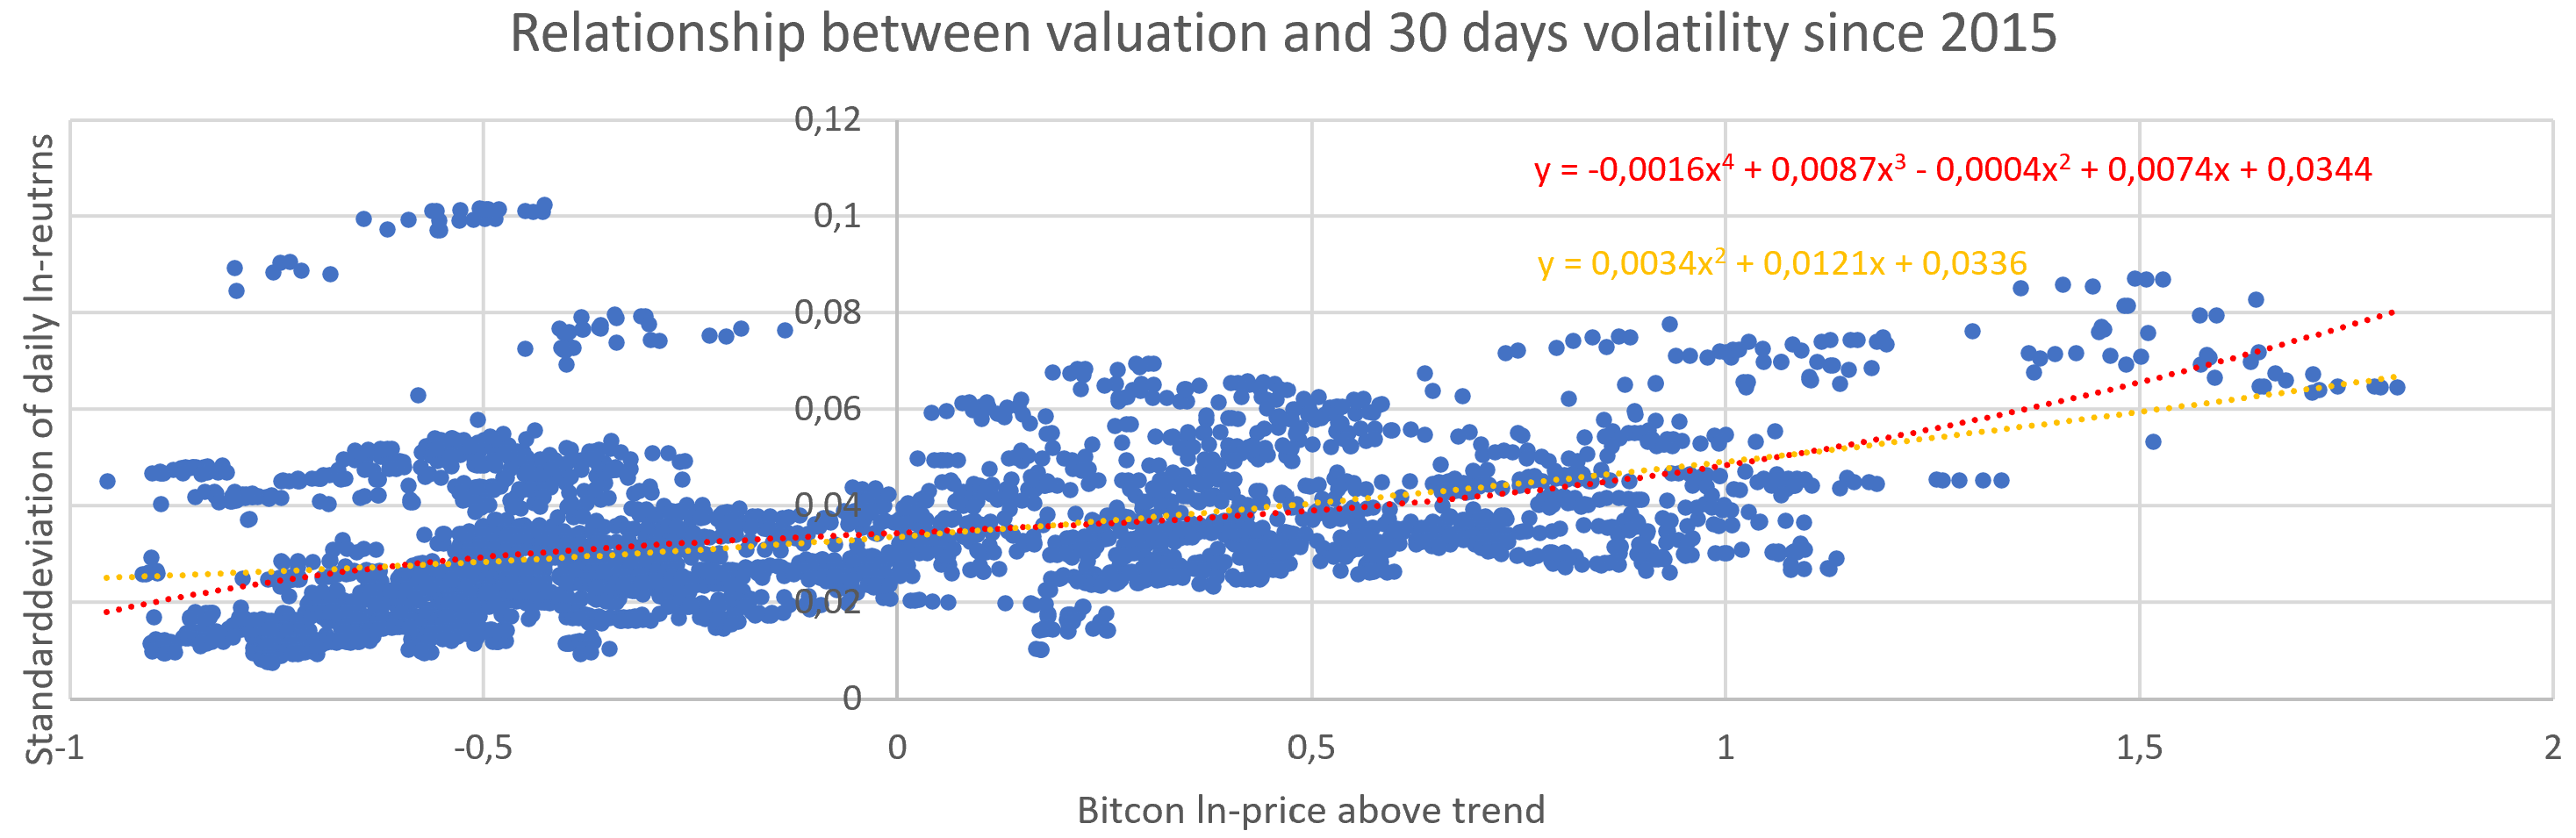 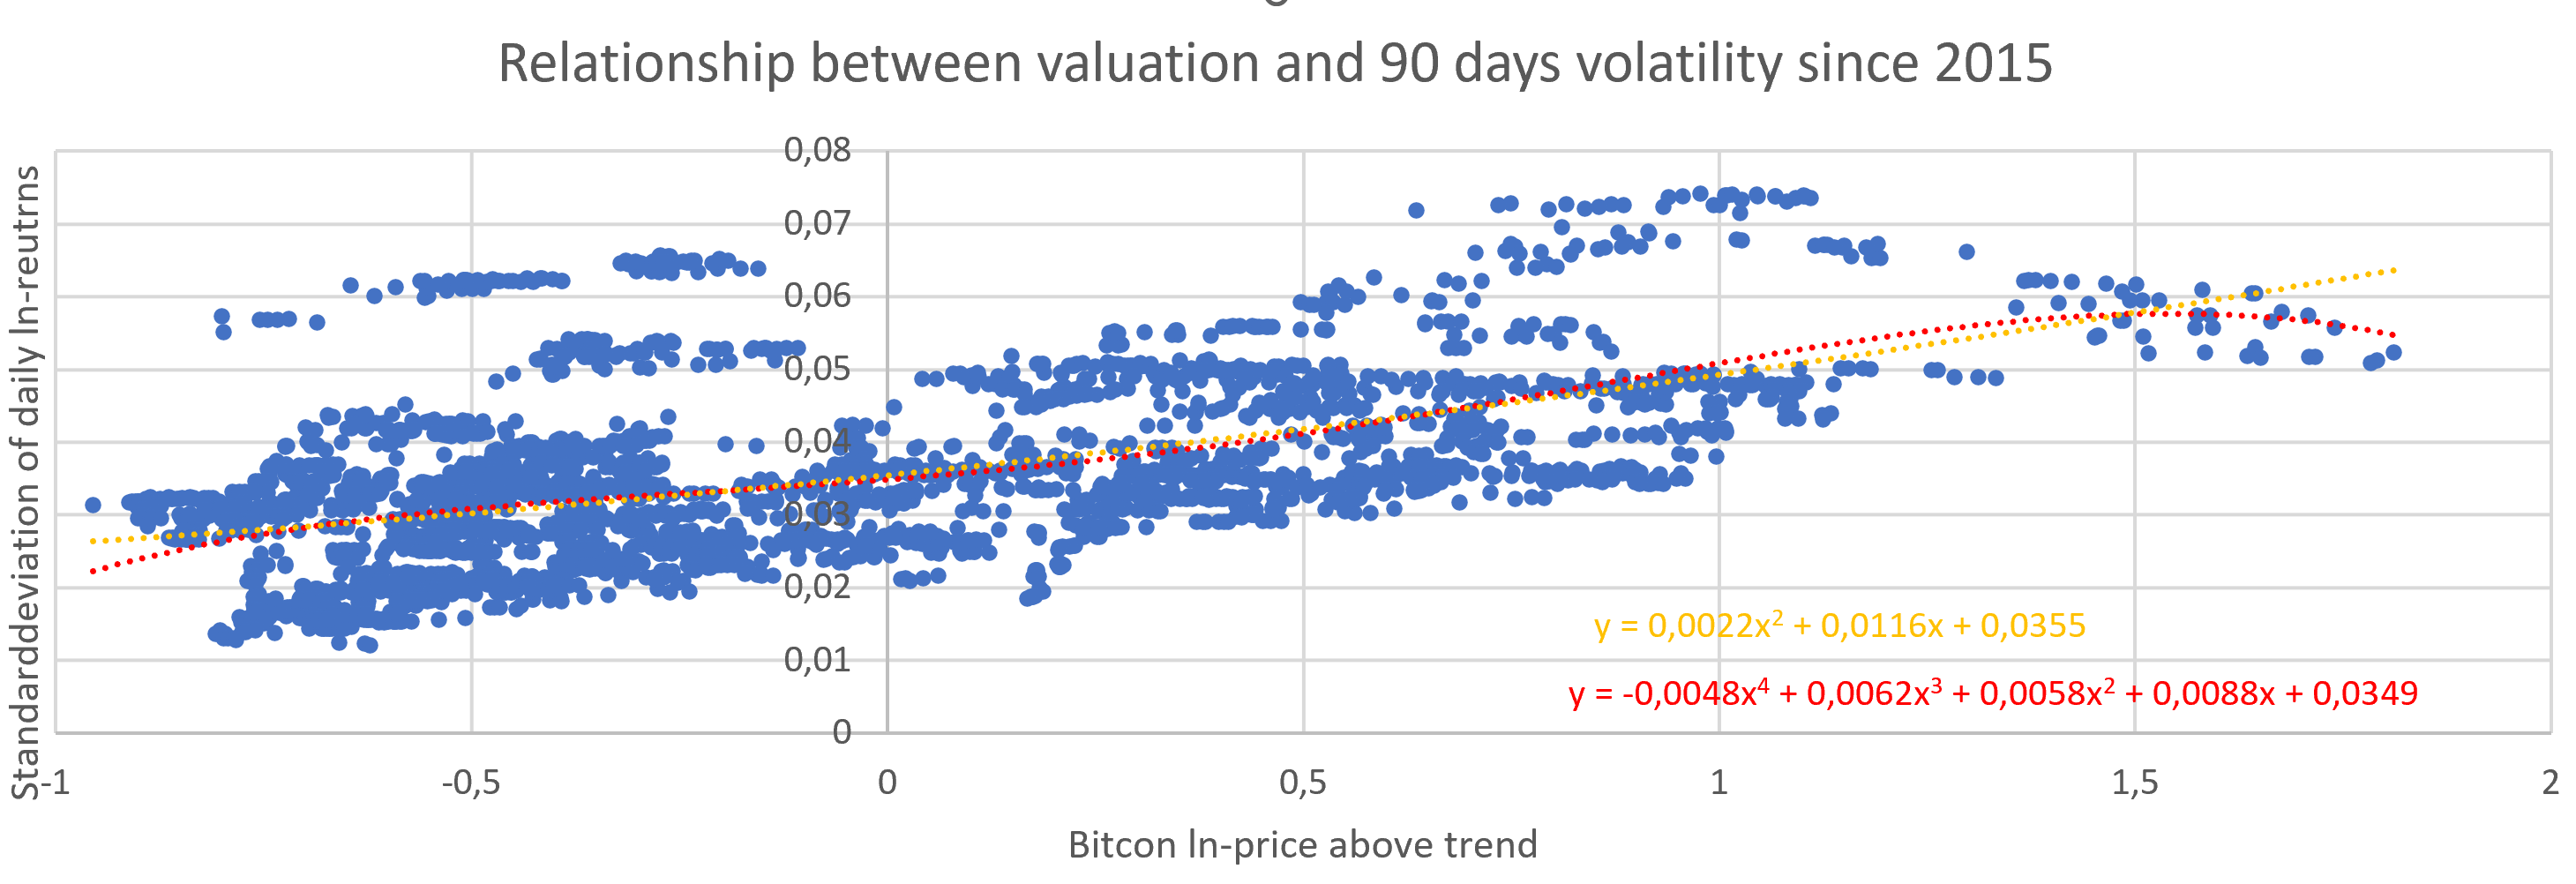 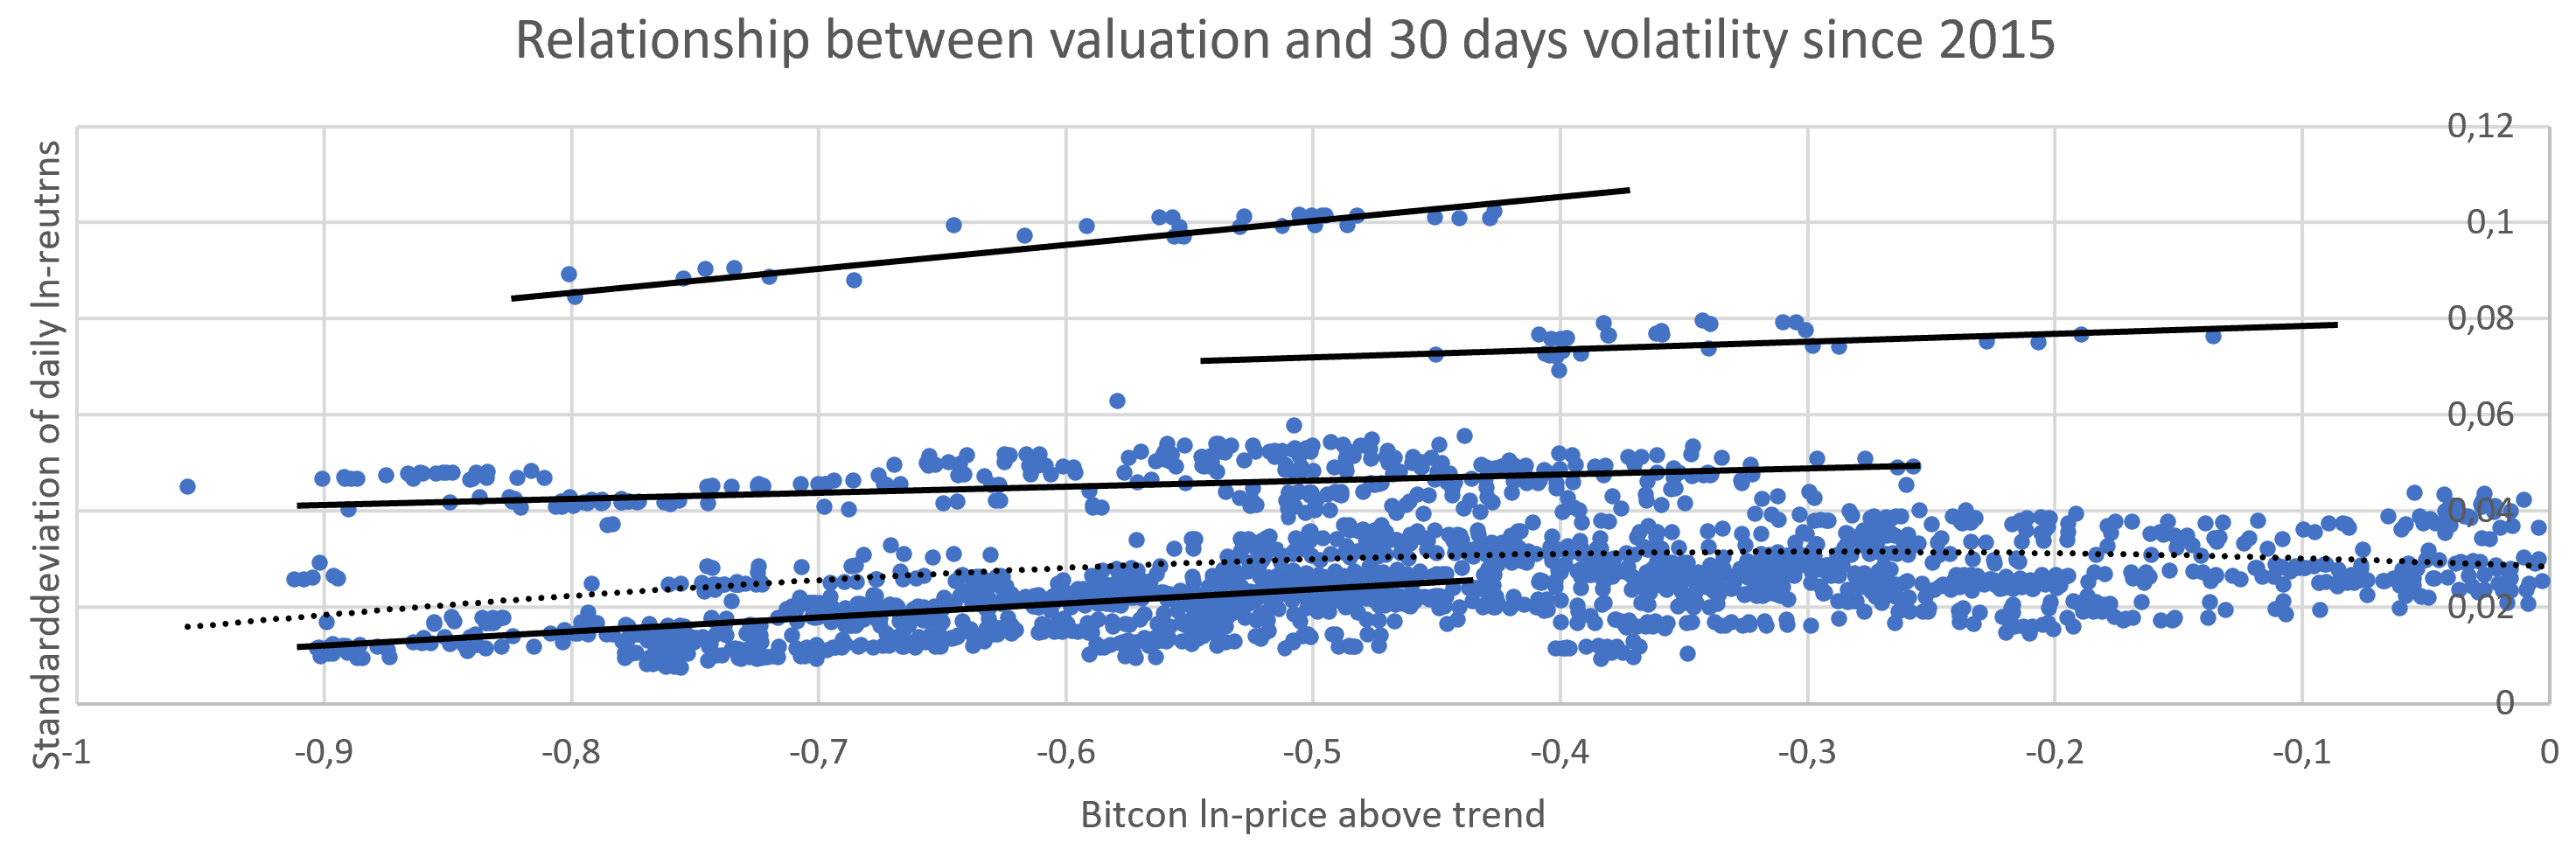 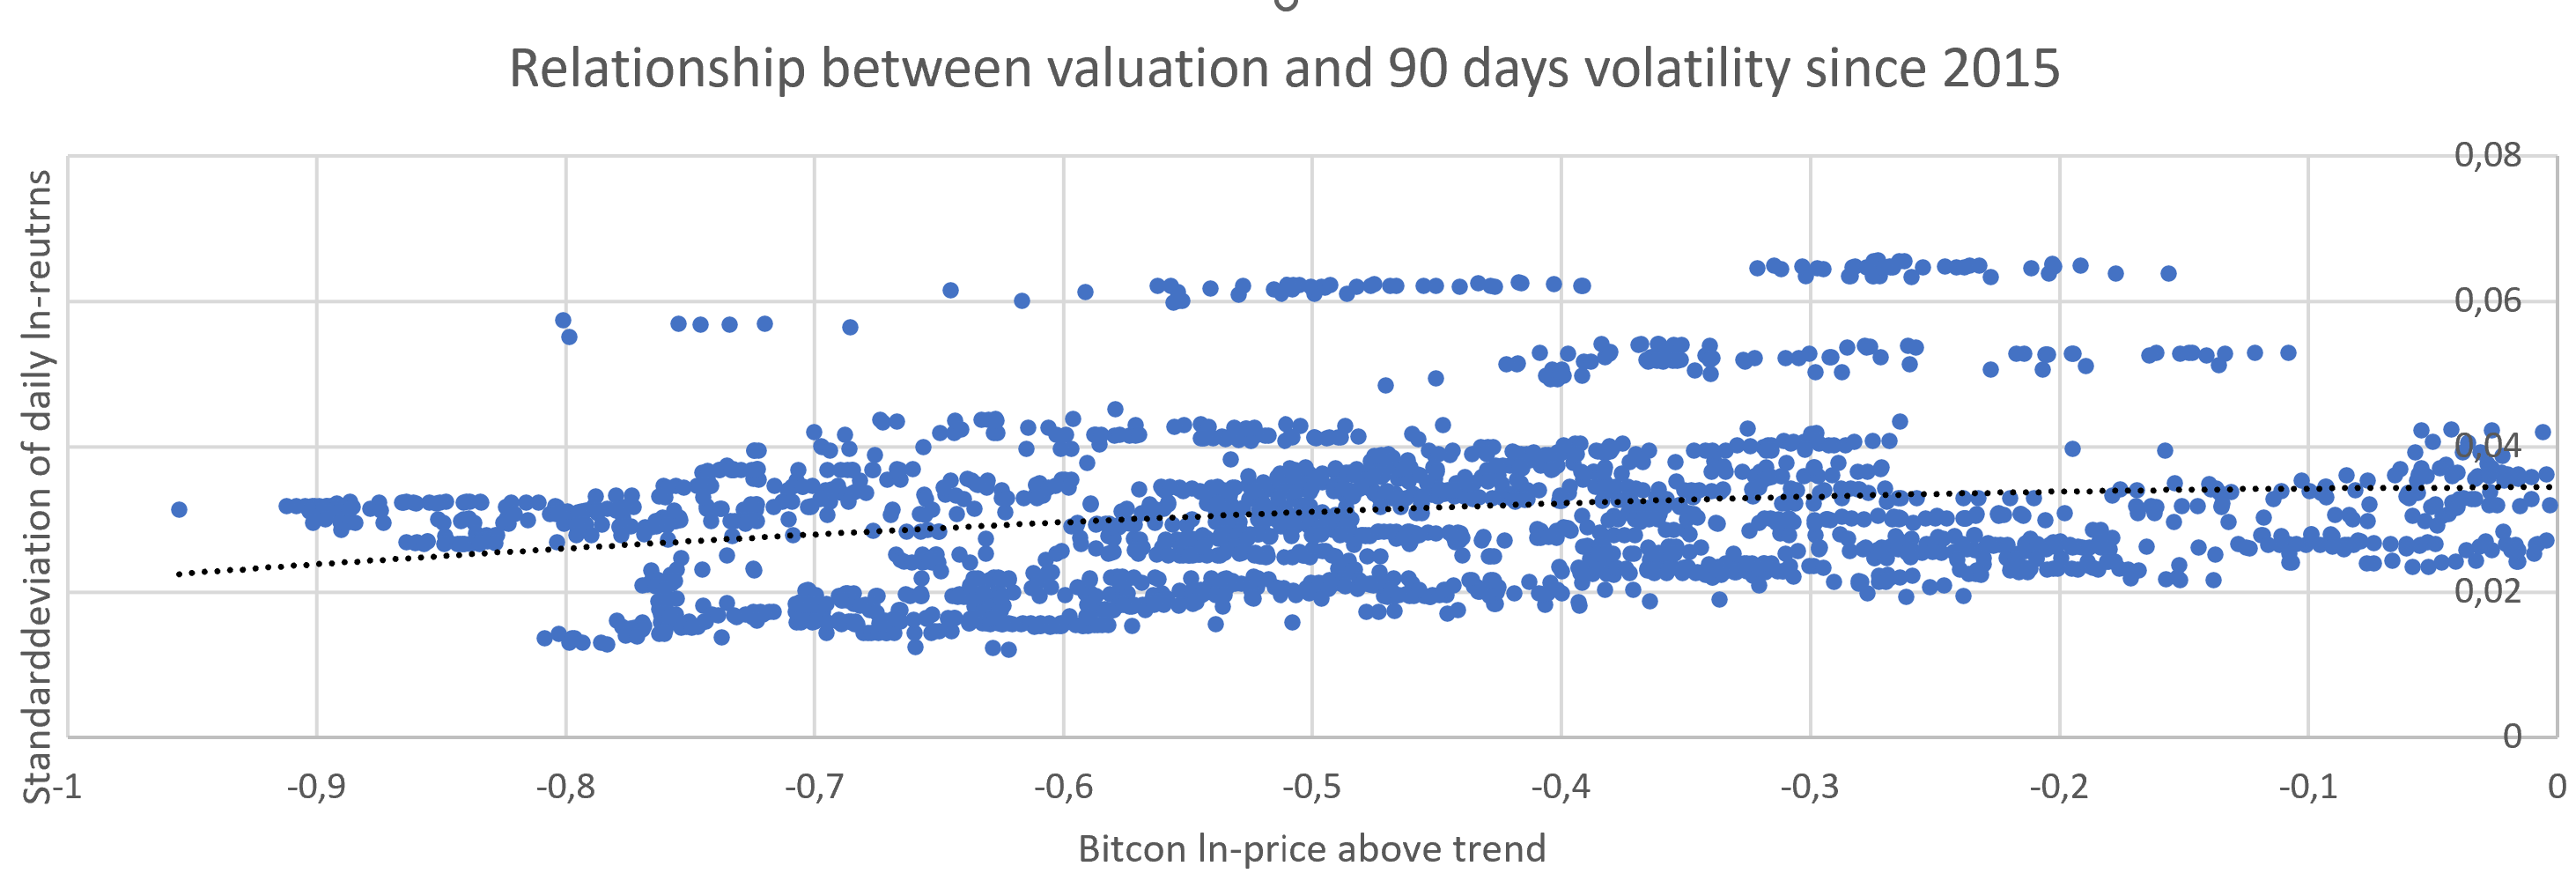 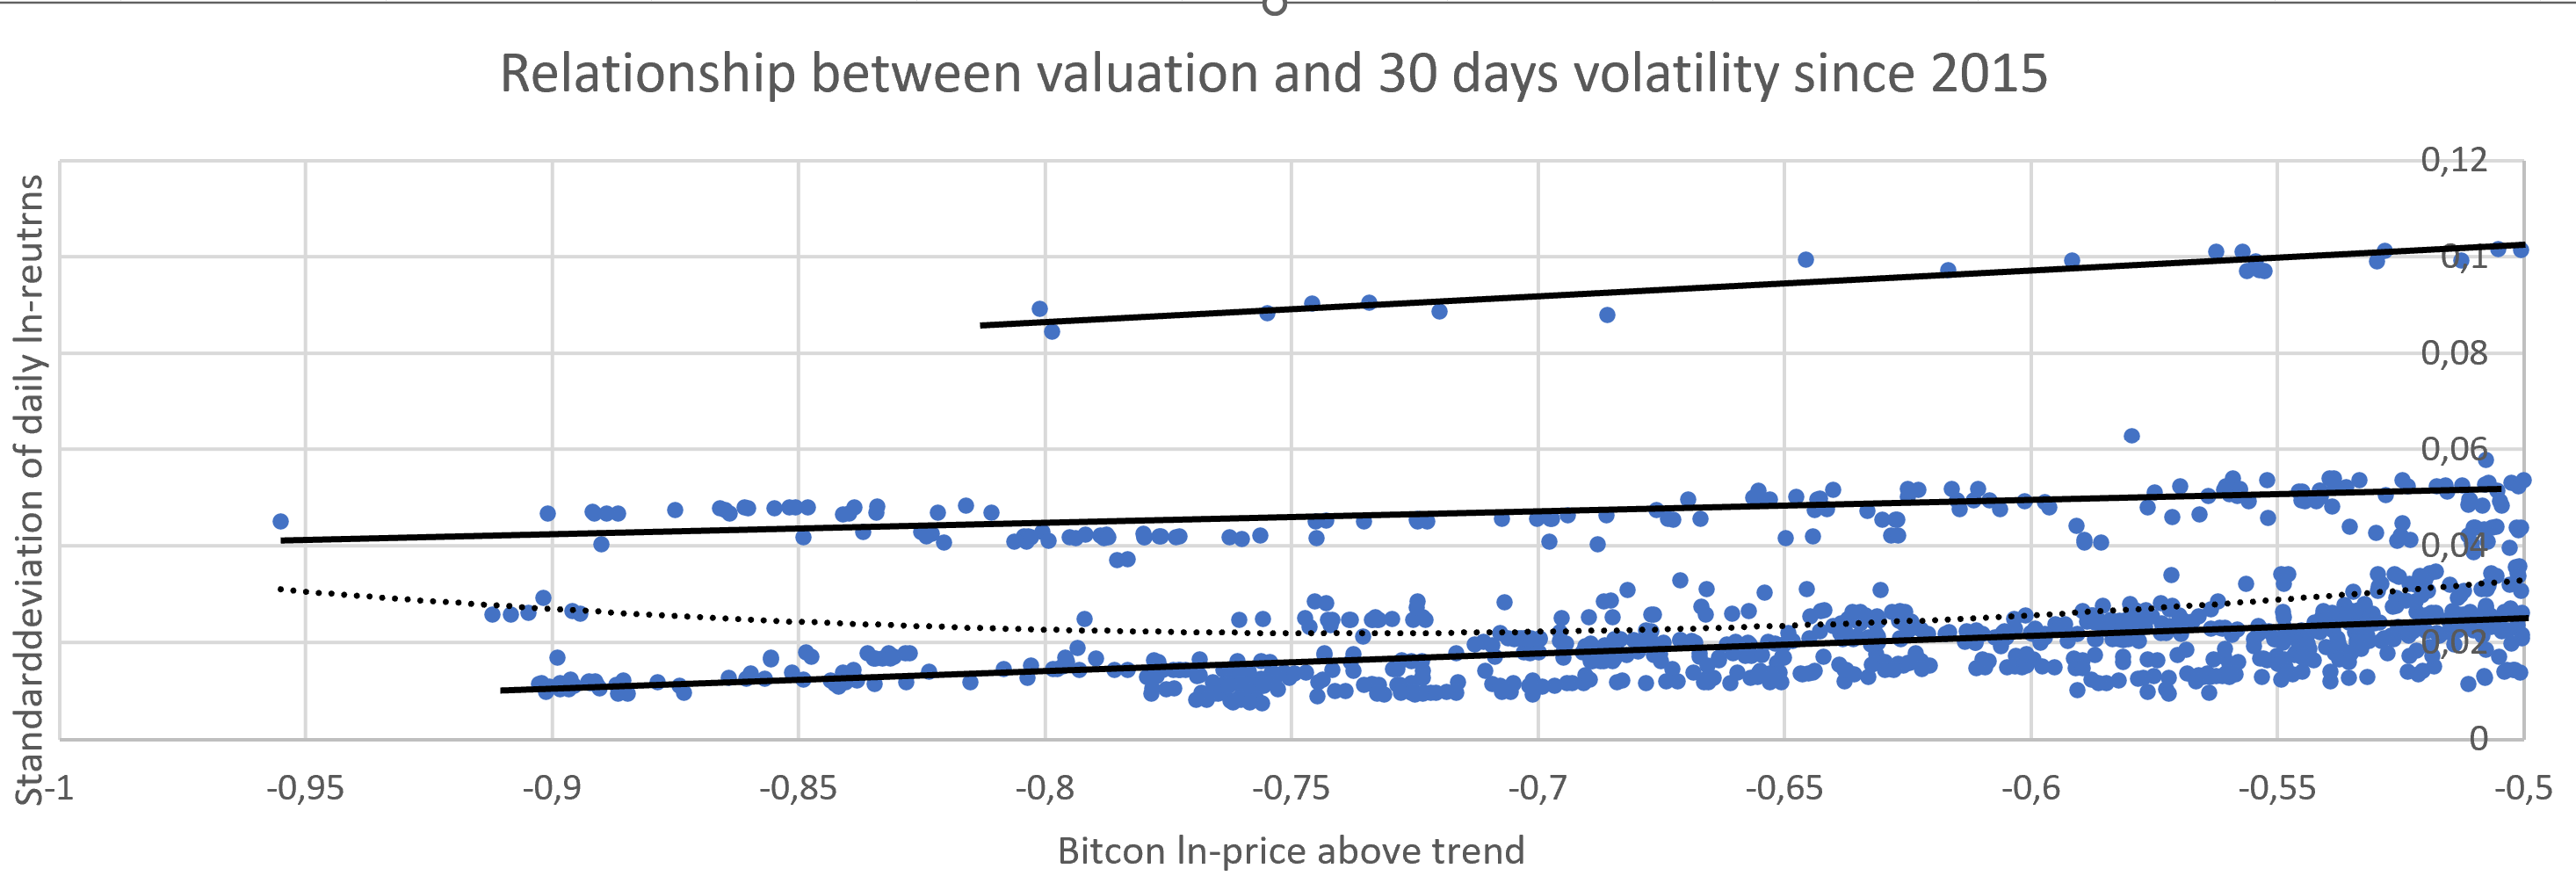 This is extremely unusual. All the other asset classes I know of, are more volatile, when they are cheaper. Let's take a look at the S&P 500 price index. 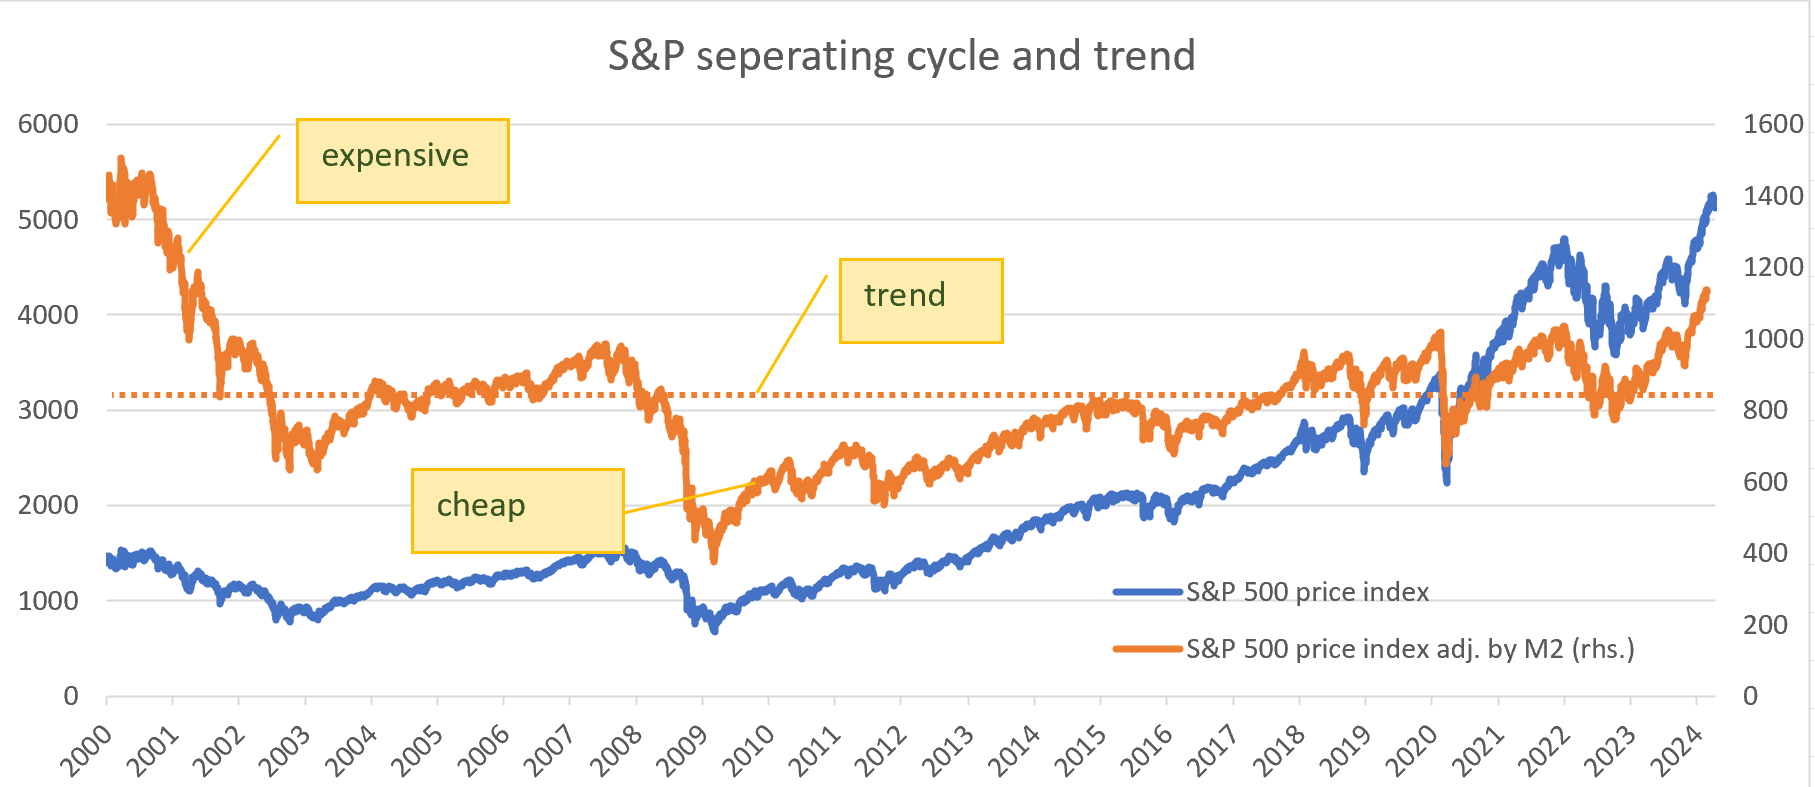 The blue line shows us the S&P 500 price index. The orange line shows us the S&P 500 price index adjusted for USD-M2 growth. The orange dotted line gives us the S&P trend growth. If the S&P (orange line) is below its trend (orange dotted line), then the stocks are cheap. If the S&P is above trend, stocks are expensive. The main long term price driver for the S&P 500 (but also for example gold) is M2-inflation. Adjusting for M2 gives us a flat trend for the S&P 500. 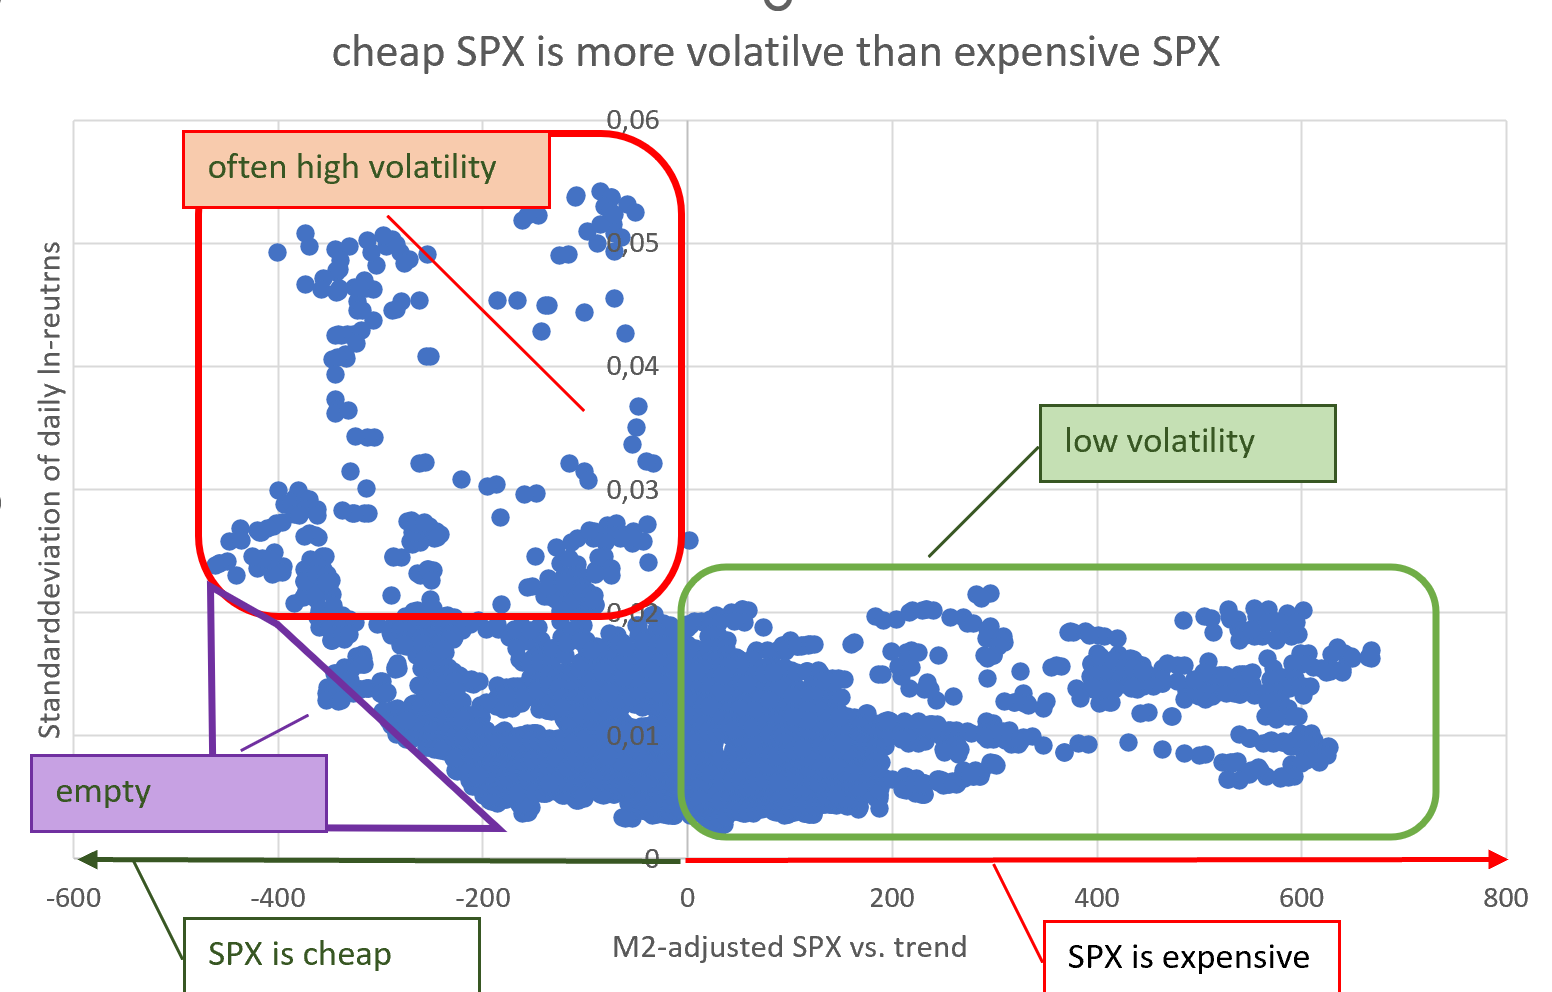 If we plot the S&P vs. trend against its volatility, we can see that expensive S&P has low volatility (green box). We only see high volatility for cheap S&P (red box). We can also see that very cheap S&P doesn't come with low volatility (purple triangle). But Bitcoin is different. For Bitcoin the combination of cheap and low volatiltiy is pretty common. However we can see that different cycles have different volatility levels. Lets plot our volatility after 2015. 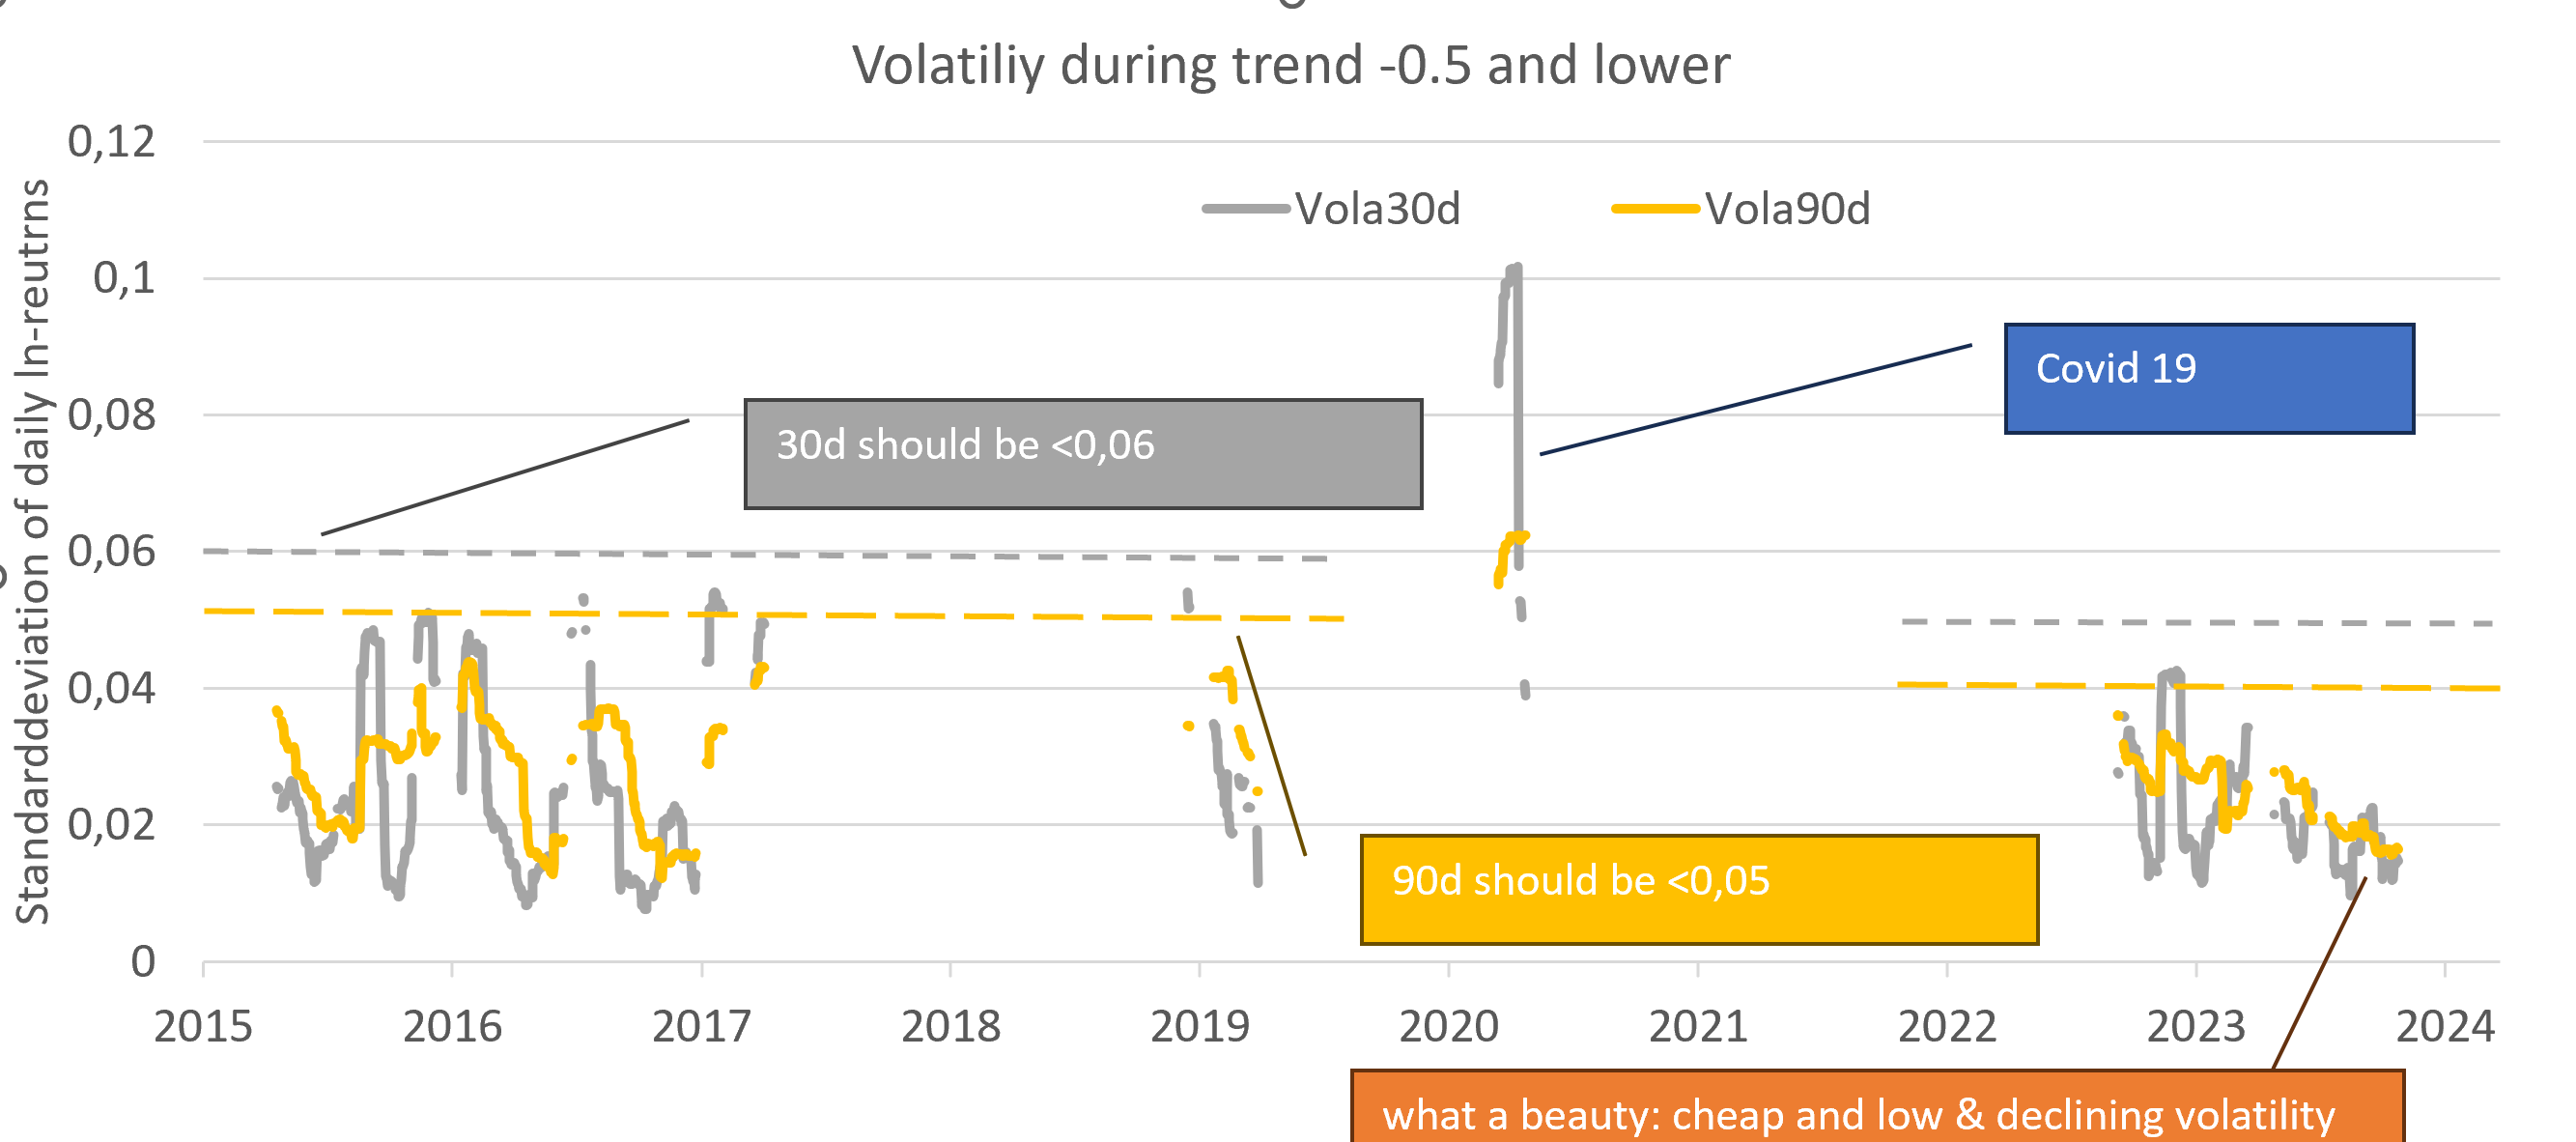 The grey lines is our volatility calculated over the daily returns over the previous 30 days. The yellow line is the 90 days volatility. To take out the noise I only displayed the volatility lines, if Bitcoin was cheap (Trend * e^-0.5 or blow). We can see that volatility is generally below 0,06 (30d) and below 0.05 (90d). The only exception is COVID 19 with high volatility in all markets. In the next bear market I would expect the Bitcoin's volatility to reamin below the dotted lines. A higher Bitcoin volatility I would only expect during times of weder market turmoil (like during COVID 19). The model would risk breaking down, if Bitcoin is cheap, but the volatility is high. Our last bear market was perfect. Bitcoin was cheap, volatility was low, volatility was declining. A very nice setup in hindsight. 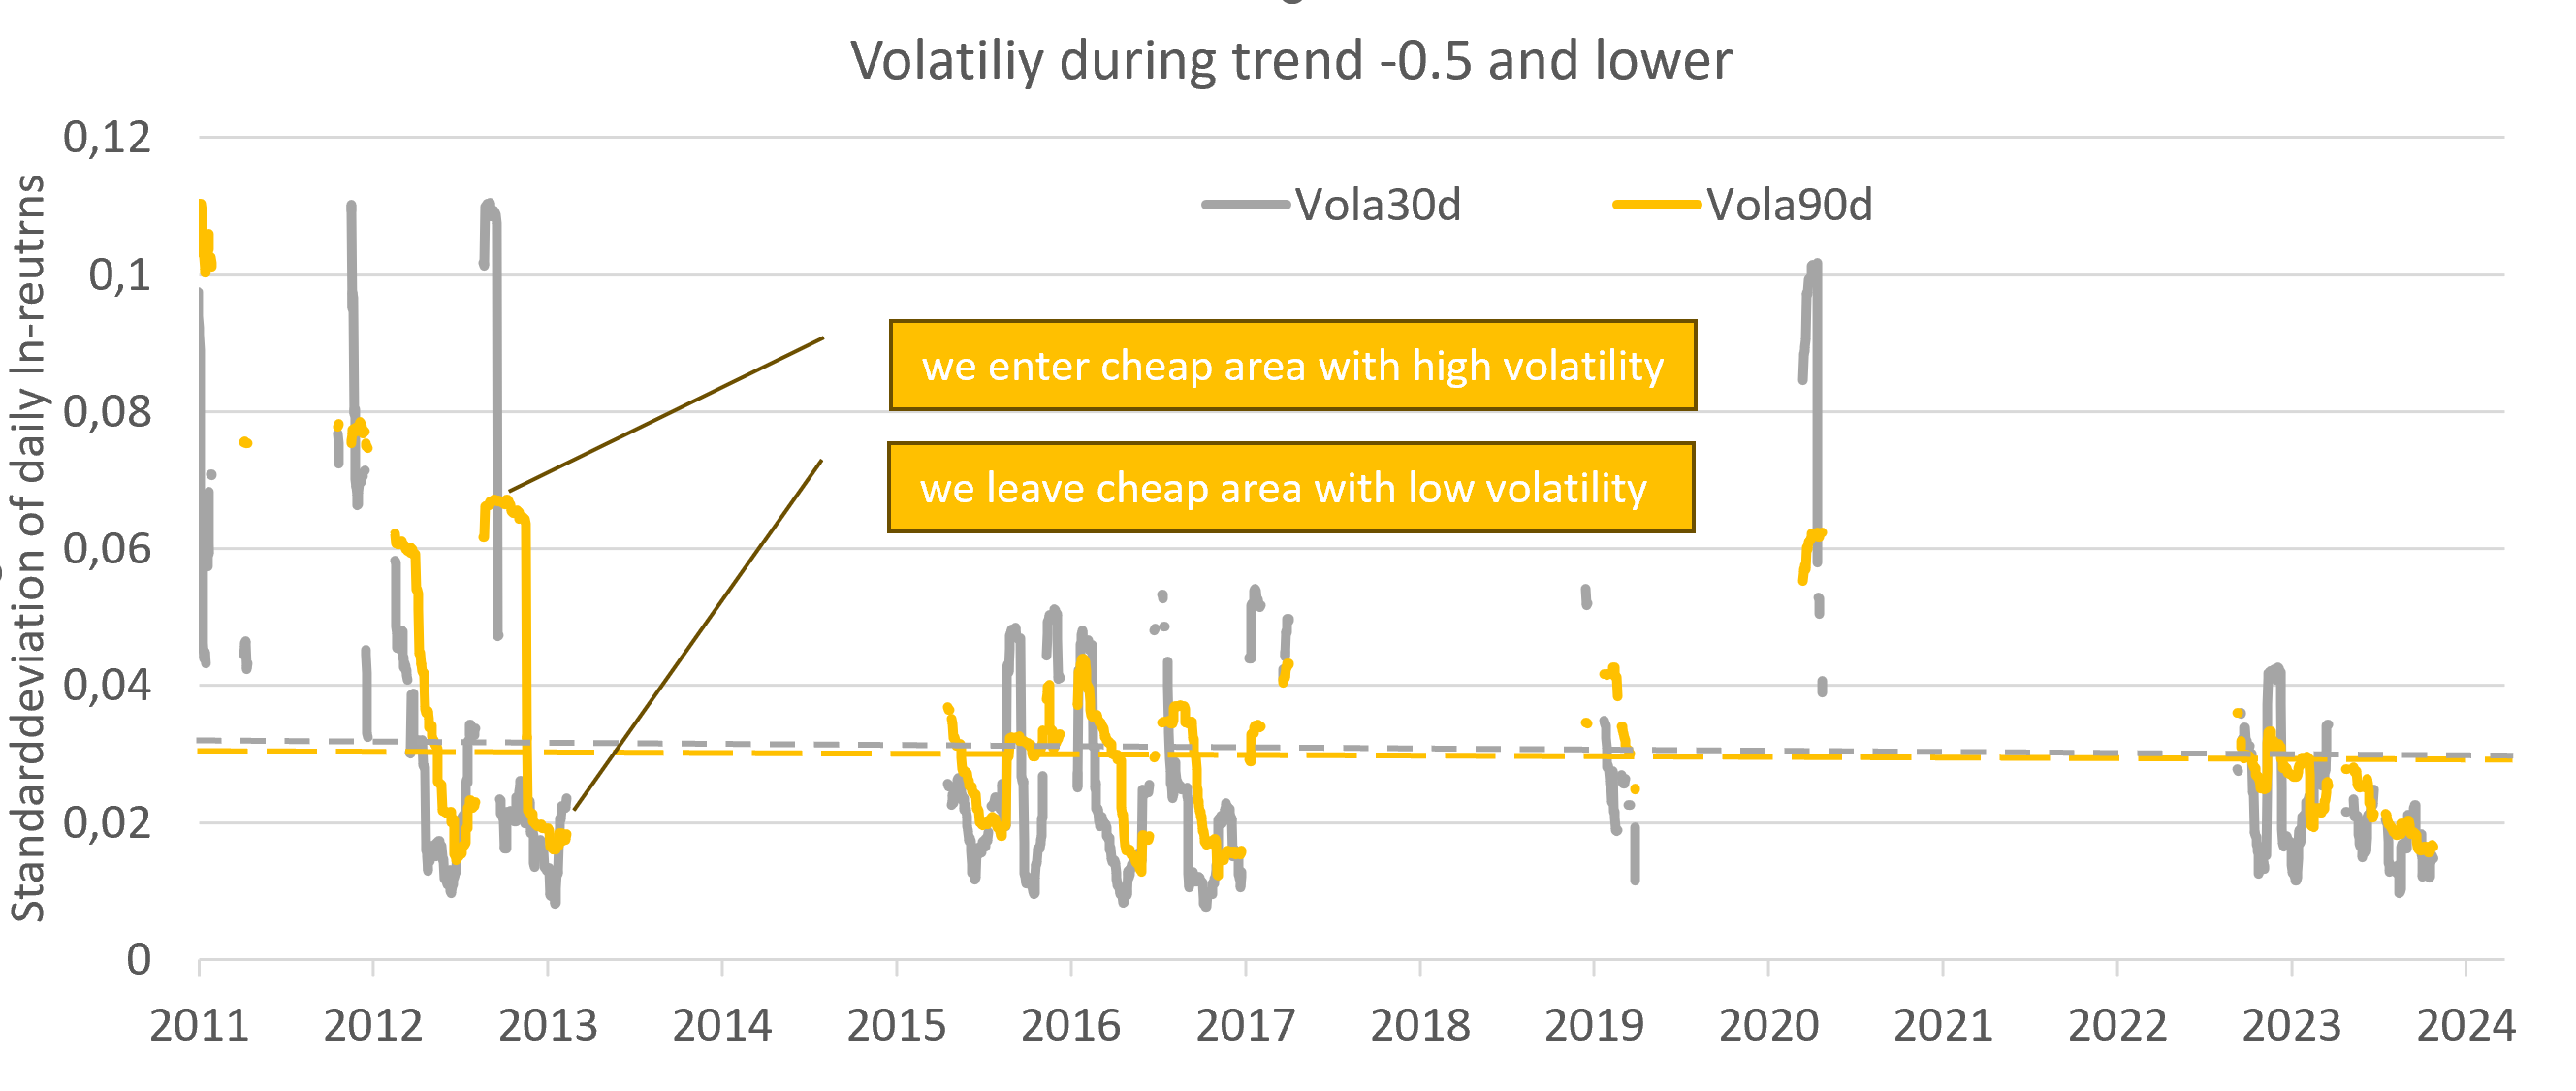 Over several cycles we can observe a declining volatility during bear markets. We enter the bear market with high volatility and leave the bear market with low volatility. If we had planed to time the market, we could have waited for volatility to come down, before taking our full Bitcoin position. This would have worked every time except COVID 19. Result: A low volatility during the bear market gives us additional confidence to invest into cheap Bitcoin.
|
|
|
|
Ich habe erarbeitet, wie viel Bitcoin und wie viel andere Vermögensgegenstände ich kaufe und in welcher Reihenfolge. ...
Ich habe zudem Erwartungen über den Bitcoinpreis (Trendwachstum und Zyklus) historisch abgeleitet. Jetzt frage ich mich: "Was muss mit Bitcoin passieren, damit ich meine Bitcoin-spar-Strategie ändere? Und wie ändere ich meine Strategie je nach Szenario?"
Ausgangslage:Bitcoin bietet Diversifikation und Krisenschutz. Deswegen würde ich 10%-20% meines Gesamtvermögens in Bitcoin halten, selbst wenn Bitcoin eine marginal negative Rendite aufweisen würde. Weil Bitcoin aber mit Abstand die beste Rendite aller verfügbaren Vermögensklassen hat, investiere ich mehr als 20% meines Lebensgesamtvermögens im Bitcoin. 100% meines Vermögen in Bitcoin zu stecken, wäre mir aber zu riskant, deswegen halte ich Gold/Aktien zur Liquditätssteuerung und perspektivisch auch zur Diversifikation. Mittel bis Langfristig strebe ich aktuell an, 66% meines Lebensgesamtvermögens in Bitcoin zu stecken. 66% meines Lebensgesamtvermögens ist eine ordentliche Wette, also sollte ich mir vorher festlegen, wie ich mich in Stress-Situationen verhalten werde. Was passiert wenn Bitcoin sich nicht so entwickelt, wie erwartet?Szenario 1: Im schlimmsten Fall wird Bitcoin über Nacht für immer wertlos. In diesem Fall verfüge ich über eine ausreichende Liquiditäskasse, um eine Privatinsolvenz zu vermeiden. Und ich habe noch genügend Lebensrestvermögen, damit meine Frau und meine Kinder nichts von unserem finanziellen Unglück erfahren müssen. Szenario 2: Bitcoin sinkt innerhalb von 3-6 Monaten um 99,9% und erholt sich in den nächsten 10 Jahren von -99.9% auf -99.5%. (z.B. USA und EU verbieten Bitcoin mit 10 Jahren Haft bei Nutzung, Bitcoin bleibt in wenigen 3. Welt Staaten erlaubt). Hier hätte ich ausreichend Zeit auf die Änderung der Situation zu regieren. 1.) Ich muss entscheiden, ob wir in einen normalen Bärenmarkt sind oder Bitcoin gerade scheitert. Trigger-Ereignis: Der Bitcoinpreis fällt auf unter [Trend * e^-1] und die (implizite) Volatilität ist höher als in vergangenen Bärenmärkten (z.B. über 100). 2a) falsche Reaktion: "Dump on believers" Wenn der Bitcoinpreis unter Trend * e^-1.5 fällt, dann ist klar "Irgendetwas stimmt mit Bitcoin nicht." Es ist aber zu diesem Zeitpunkt noch nicht klar, ob wir uns wieder erholen werden oder nicht. Sollte ich in diesem extremen Bärenmarkt Bitcoin gegen EUR verkaufen z.B. durchschnittlich zu Trend * e^-2 (= 87% unter Trend und 95% unter Peak), dann ist sowieso kaum noch etwas von meiner Investition zu retten. Ein Verkauf lohnt sich zu diesem Zeitpunkt nicht mehr. 2b) richtige Reaktion: Diversifikation in andere Kryptowährungen Aus dem Bauch heraus würde ich die Hälfte in Bitcoin lassen und die andere Hälfte in Monero tauschen, solange dies rechtlich legal ist. Konkret würde ich vor einer Diversifikation in andere Kryptowährungen die TOP 50 Altcoins durchsuchen nach Coins, die weniger stark als Bitcoin verlieren und fundamental einigermaßen Vernünftig aussehen. Hierhin würde ich versuchen zu diversifizieren. Szenario 3: Der Bitcoinpreis wächst viel langsamer Trigger-Ereignis: Wir kommen innerhalb von 4 Jahren im Hochpunkt nicht mehr über Trend+500 Tage oder wir sehen abnehmende Tiefpunkte im Bärenmarkt von z.B. e^-1.2 dann e^-1.4, dann e^-1,8. Der einzelne Bärenmarkt hätte allerdings eine normale oder sogar unterdurchschnittliche Bärenmarkt Volatilität. Hier würde ich in aller Ruhe eine neue Funktion für den Preistrend von Bitcoin schätzen. Mit der erwarteten Rendite von Bitcoin, der Verbotswahrscheinlichkeit, meinem Lebensvermögen und meiner Nutzenfunktion, würde ich eine neue nutzenoptimale Bitcoinallokation schätzen. Diese Allokation läge dann vermutlich unter 66% aber über 20%.
Kritik: KryptoArche, der Bitcoinpreis ist kein sinnvolles Kriterium Bitcoin zu beurteilen, Hauptsache Bitcoin funktioniert. Antwort: Wenn sich der Bitcoinpreis anders verhält als in den vergangenen 14 Jahren, dann hat das wahrscheinlich einen guten Grund. Zumindest müssen wir hier genauer analysieren. Wenn unsere Analyse lautet "Bitcoin ist top", aber der Preis den Bach herunter geht, dann hat der Preis ggf. unrecht aber evtl. haben wir mit unserer Analyse auch unrecht. Diese Lehre habe ich aus Wirecard gezogen. Die Bilanzkennzahlen waren gut, das Wachstum war gut, der Jahresabschluss war durch eine Wirtschaftsprüfungsgesellschaft testiert, die Bafin gab Rückendeckung nur der Aktienpreis wurde immer billiger. Gute Fundamentaldaten, billiger Preis, also habe ich gekauft. Am Ende waren die Jahresabschlüsse gefälscht, der Preis hatte recht und mein Geld war verloren. Monero ist fundamental gut, die Entwickler bemühen ihr Produkt technisch zu optimieren, es ist kein Scam. Auch wenn wahre Bitcoiner sagen es gibt Bitcoin und den Rest, gibt es innerhalb vom Rest Unterscheide. Monero wünsche ich viel Erfolg auf ihrem Weg. Ich bin aber nicht nennenswert in Monero investiert, weil sich der Preis schlecht entwickelt. Wenn dies drehen sollte, komme kann ich ja etwas Bitcoin in Monero tauschen.
Feedback:
Was haltet ihr von den Trigger-Marken und von den daraus abgeleiteten Strategien? |
|
|
|
Nun kam es 2021 aber zum Corona-Crash, der den Preis aufgrund eines außergewöhnlichen Ereignisses wesentlich tiefer fallen ließ als in vergleichbaren Marktsituationen. Der Corona-Crash könnte den Kursverlauf der folgenden Jahre negativ beeinflusst haben. So hatten viele Bitcoiner erwartet, dass 2021 schon die 100.000 gerissen werden könnten, das Top lag aber "nur" knapp unter 70.000. Stimmt diese Hypothese, dann hätte der Corona-Crash den Langfristtrend nach unten verzerrt, und eine Formel, die diesen Trend darstellen soll, wäre womöglich "zu konservativ".
Wir sind weder bei Corono noch später bei FTX/Luna tiefer ggü. Trend gefallen als in vergangenen Zyklen. Ich halte es daher nicht für erforderlich den Langfristtrend anzupassen. Es zwar korrekt, dass der letzte Peak 2021 ungewöhnlich niedrig ausgefallen ist, aber (i) wir haben weniger Peaks (4-6 Peaks vs. ca. 15 Tiefpunkte), (ii) die Peaks sind variabler (Peaks liegen bei e^1 bis e^2.6 vs. Tiefpunkte bei e^-1 bis e^-0.5) und (iii) die Peaks scheinen im Gegensatz zu den Tiefpunkten einem Abwärtstrend zu unterliegen. Deswegen würde ich niedrigere Hochpunkte nicht zum Anlass nehmen den Trend zu hinterfragen solange die Tiefpunkte nicht niedriger werden. Wie könnte der Trend verlaufen sein, wenn dieses Ereignis nicht eingetreten wäre? Wie groß ist demnach der mögliche Einfluss auf den Preis?
Bisher finde ich den Trend stabil. Eine Trendänderung würde ich erwarten wenn:- wir eine strukturell höhere Ausweitung der Geldmenge bekommen. Eigentlich müsste man den Bitcoinpreis um die Geldmengenausweitung M2 (USD, EUR, YPY) bereinigen. Wenn die Zentralbanken zur weg-Inflationierung der Staatsschulden eine deutlich höhere Geldmengen-Inflation erzielen, dann würde sich der Trend beschleunigen. Statt einem Wachstum von 5,8 (= Steigung der Geraden), liegt das Wachstum eher bei 5,2 plus M2-Inflation. - wenn wir im Tiefpunkt nicht mehr zwischen e^-0.5 und e^-1 landen. Sobald wir unter e^-1.2 fallen, ist das Modell gescheitert und der Trend deutlich unter 5,8. Sollten wir über vier Jahre nicht mehr unter e^-0.5 fallen, würde das für eine Beschleunigung des Trends sprechen. Ich erwarte aber eher ein Scheitern des Modells nach unten als nach oben. Eine Beeinflussung des Zykluses würde ich erwarten durch:- Liquiditätssituation, d.h. Geldmenge M2, Dollar-Index, QE, Höhe des Treasury General Accounts, Änderung des US-Staatsdefizits - Risikoaversion, d.h. VIX ist hoch, High Yield Bond Spreads hoch, Nasdaq im Bärenmarkt
A) 4-6 Peaks B) über 15 TiefpunkteC) Peaks sinken im Gegensatz zu den Tiefpunkten B) über 15 TiefpunkteC) Peaks sinken im Gegensatz zu den Tiefpunkten |
|
|
|
Glücklicherweise ist die Datensammlerei ja recht einfach zu umgehen: ...
Ich würde noch ergänzen, dass sich deine Walletsoftware mit einen Node verbindet, um abzurufen wie viele Bitcoin du mit deinem privaten Schlüssel kontrollierst. Der Node sieht deine IP-Adresse und welche Bitcoinadressen du abfragst. Die beste Lösung hierfür ist, einen eigenen Node zu betreiben. Die zweitbeste Lösung ist, die Sparrowwallet innerhalb einer Whonix-Virtuellen Maschine laufen zu lassen, damit alle Abfragen über TOR laufen. Ich führe einen Neustart der VM durch, wenn ich eine zweite Wallet abfrage. Als Node nutzte ich den Node von Seth for privacy. |
|
|
|
In Zusammenarbeit mit den klugen Rückmeldungen aus diesem Forum habe ich meine (Bitcoin)spar-Strategie überarbeitet.Eigentlich wollte ich nur meine Vermögensverteilung anhand adjustierter Volatilitätsziele vorstellen. Dank der konstruktiven Nachfragen aus diesem Forum habe ich meine Vermögensverteilung mit meiner Liquiditätsplanung verzahnt. Dank dem Feedback aus diesem Forum habe ich mir nochmal grundsätzlich Gedanken gemacht, welche Ziele ich anstrebe und die Stellschrauben meiner Vermögensverteilung optimiert. Besonders Dank gilt hier Turbartuluk.Grenzen / Disclaimer: Ich bin kein staatlich lizenzierter Finanzberater*in oder Steuerberater*in. Die Schätzung der Rendite der Vermögensklassen vor Steuer gilt zwar international, aber die geschätzten Zusammenhänge können sich im Zietverlauf auch ändern. Die Einschätzung der steuerlichen Situation gilt nur für deutsche steuerpflichtige Privatpersonen bis zur Änderung der Gesetzeslage. Der Einsatz von vermögensverwaltenden Gesellschaften wurde nicht berücksichtigt. Die Priorisierung von Liquidität vor Rentabilität ist universell ratsam. Die Diversifikation zwischen Bitcoin und anderen Vermögensklassen erfolgte aufgrund meiner persönlichen Vermögenssituation und meiner persönlichen Nutzensituation und unterstellt insbesondere auf absehbare Zeit positive monatliche Cashflows. Wenn deine Ausganssituation anders ist, dann ist deine optimale Bitcoinallokation auch anders.Du lernst:
- die Kombination von Steuerrecht und Inflation führt zu einer extrem ungleichen Behandlung verschiedener Vermögensklassen.
- eine vorausschauende Liquiditäsplanung.
- wie du anhand deiner Ausgangssituation (Nutzenfunktion, Ausgangsvermögen, erwartete Bitcoinpreisentwicklung) deine optimale Bitcoinallokation findest.
- wie du den Zyklus von Bitcoin zu deinem Gunsten nutzt.
Ggf. hilft dir der ein oder andere Punkt, deine eigenen Finanzplanung zu verbessern, deinen Prozess besser zu strukturieren und so unabhängiger von deinen Emotionen zu werden. So erwirtschaftest du für dich eine bessere Rendite mit geringem operativem Aufwand.
Ziel: Gehaltsüberschüsse als deutscher Privatanleger individuell wirtschaftlich optimal anlegen. In den meisten Monaten erwirtschafte ich finanzielle Überschüsse, die ich als Sicherheitspolster für die Zukunft sparen möchte. 1. Auswahl der richtigen Vermögensklasse1a) EUR ist zum Sparen ungeeignetEin Sparen in EUR oder USD halte ich für nicht klug, weil die EZB die EUR-Geldmenge stark ausweitet (seit 2000 durchschnittlich +6.5% p.a.) und die FED die USD-Geldmenge stark ausweitet (seit 2000 durchschnittlich +7.5% p.a.). Damit wird die Kaufkraft des Fiat-Geldes verwässert. Auf Sicht von Jahrzehnten verliere ich inflationsbereinigt einen Großteil meiner Ersparnisse. Diese mangelnde Eignung unseres Fiatgeldes zur Wertaufbewahrung zwingt mich meine Ersparnisse solange in Sachvermögen zwischenzuparken, bis ich sie wieder benötige. 1b) EUR zur Kreditaufnahme kann sich lohnenWenn ich die Gelegenheit habe, Kredite zu günstigen Zinsen, langer Laufzeit und planbaren Rückzahlungszeitpunkt aufzunehmen, nutzte ich diese Möglichkeiten. 1c) Sachvermögen schützt vor InflationDieses Zwischenparken von Ersparnissen kann u.a. in Immobilien, Aktien, Gold, Bitcoin oder Kunst erfolgen. Bei der Verteilung der Ersparnisse auf die verfügbaren Vermögensklassen müssen wir neben der Vorsteuerrendite auch Steuern berücksichtigen, evtl. auch das Verbotsrisiko, ein Enteignungsrisiko oder einen möglichen Kredithebel. 1d) Immobilien sind aktuell zu teuerImmobilien sind aufgrund günstiger Kredite und einer guten steuerlichen Behandlung oft eine attraktive Anlagemöglichkeit. Aktuell sind die Preise von Immobilien für das gestiegene Zinsniveau noch zu hoch, die regulatorische Unsicherheit ist angestiegen und ein höheres Inflationsrisiko in Verbindung mit Mietpreisgrenzen macht Immobilien aktuell zu einer schlechten Geldanlage. 1e) Gold und AktienGold hingegen hat nach Inflation und Steuern eine Rendite von 0 während Aktien nach Steuern und Inflation eine Rendite von 0 häufig gar nicht erst erreichen. Volkswirtschaftlich und auch betriebswirtschaftlich vor Steuern produzieren Unternehmen eine positive Rendite, während Gold keine Rendite abwirft. Nach Steuern und Inflation änder sich das Bild allerdings. Gold wird nicht besteuert, während die Gesamtsteuerlast von Aktien nach Inflation bei über 100% liegt. Selbst in einem Umfeld moderater Inflation ist die Steuer auf die inflationsbedingten Scheingewinne höher als der versteuerte Ertrag auf den Vermögensgegenstand. Aktienbesitz in Deutschland ist damit zum Teil eine Spende an den Staatshaushalt sowie an die Volkswirtschaft. Zum Erhalt seines Privatvermögens sind Aktien hingegen schlecht geeigent (aber immer noch besser als Anleihen oder Bankguthaben). Passives Einkommen für den deutschen Privatanleger ist ein Trugschluss. Nach Steuern und Inflation verdienen wir weniger passives Einkommen (z.B. Coupons bei Bonds und Dividenden bei Aktien) als wir durch Entwertung unserer Anfangsinvestition verlieren. Nur Bitcoin hat nach Steuern und Inflation eine erhebliche positive Rendite, selbst unter Berücksichtigung des höheren Risikos ( Prognose 1, Prognose 2). 1f) Priorisierung der Vermögensklassen1.) Bitcoin 2.) Gold 3.) Aktien Immobilien sind steuerlich attraktiv, aber aktuell zu teuer 2. Persönliche Obergrenze für Geldanlage Bitcoin findenWenn Bitcoin so viel besser ist, als alle alternativen Anlagemöglichkeiten, warum spare ich dann nicht zu 100% in Bitcoin? 2a) LiquiditätIch möchte nicht gezwungen sein, Bitcoin im Bärenmarkt zu sehr schlechten Preisen zu verkaufen. Deswegen brauche ich einen Liquditätspuffer für planbare Liquiditätsabflüsse (z.B. Kredite) plus etwas Liquiditäsreserve für ungeplante Liquiditätsunterdeckungen (z.B. Jobverlust oder Reparaturen). Für kurzfristige Fälligkeiten verwende ich meine Liquidität für Sondertilgungen oder packe sie in die Kasse. Ein mittelfristiger Liquiditätsbedarf wird durch ein Gold/Aktienportfolio mit möglichst geringen Drawdowns übredeckt. 2b) DiversifikationWeiterhin möchte ich erhebliche Einbußen in meinem Lebensstandard vermeiden, falls ich mein Bitcoinvermögen verlieren sollte (staatliches Verbot, Verlust des privaten Schlüssels). Deswegen möchte ich nicht nur Bitcoin kaufen, sondern auch in Gold und Aktien diversifizieren. Unter Berücksichtigung der erwarteten Renditen für Bitcoin, Gold und Aktien sowie unter Berücksichtigung meiner eigenen Nutzenfunktion schätze ich die optimale Bitcoinallokation auf 2/3 meines Lebens-Gesamtvermögens. Mein Lebens-Gesamtvermögens setzt sich zusammen aus meinem aktuellen Vermögen plus dem Barwert meiner zukünftigen erwarteten Gehaltsüberschüsse. Wenn ich die 2/3 Bitcoinallokation in Zukunft erreiche, werde ich langsam anfangen meine Bitcoin zu verkaufen. 2c Priorisierung der monatlichen Geldüberschüsse auf AnlageklassenFolglich ergibt sich eine strategische Priorisierung meiner Cashflows bei der Geldanlage, um Liquiditäts- Rendite- und Diversifikationsziele zu erreichen. 3. Taktische AllokationDer Bitcoinpreis schwankte bisher um einen ln-Trend. Selbst im Bärenmarkt sank Bitcoin nie mehr als 62% unter diesen Trend. Im Bullenmarkt ist Bitcoin seinem Trend 500-1250 Tage vorweg gelaufen. Ein Bitcoinpreis von 40% unter Trend ist eine günstige Kaufgelegenheit. Läuft der Bitcoinpries dem Trend 750 Tage vorweg ist dies eine günstige Verkaufsgelegenheit. Die meisten Bitcoin packe ich nicht an. Bei sehr günstigen Preisen würde ich monatlich für mehr EUR Bitcoin kaufen. Bei sehr teuren Bitcoinpries würde ich mein DCA pausieren und evtl. auch Verkäufe in geringer Höhe tätigen. 4. Das Fell des nicht erlegten Bären verteilenSollte ich in den nächsten Jahren mit dieser Strategie erfolgreich sein, dann plane ich mein Vermögen mit folgender mit folgender Priorisierung wieder auszugeben.
|
|
|
|
Regarding the graphics i am a little more optimistic. I guess i would set up my sell area rougly 0,5-0,75 above Trend (maybe in combination with price +200-250% within 1y).
To translate that into prices: Trend line will be at 80k by the end of 2024.
e^0,4 above would mean ~120k/130k$
e^0,5-0,75 above would mean ~130-170k/145-190k$
I agree, the model suggest trend at 80k at the end of 2024. My personal definition for "good time to sell" is a Bitcoinprice 750 days ahead of trend, which would be at 160k by then. A valuation of 200k would be pretty stretched. Those values are roughly in line with your sell area. A good time to sell depends on the date:Here is a chart with the values for the 1st of each month: lower bound = trend * e^-1 good time to buy = trend * e^-0.5 good time to sell = trend + 750 days top likely in = trend + 1000 days 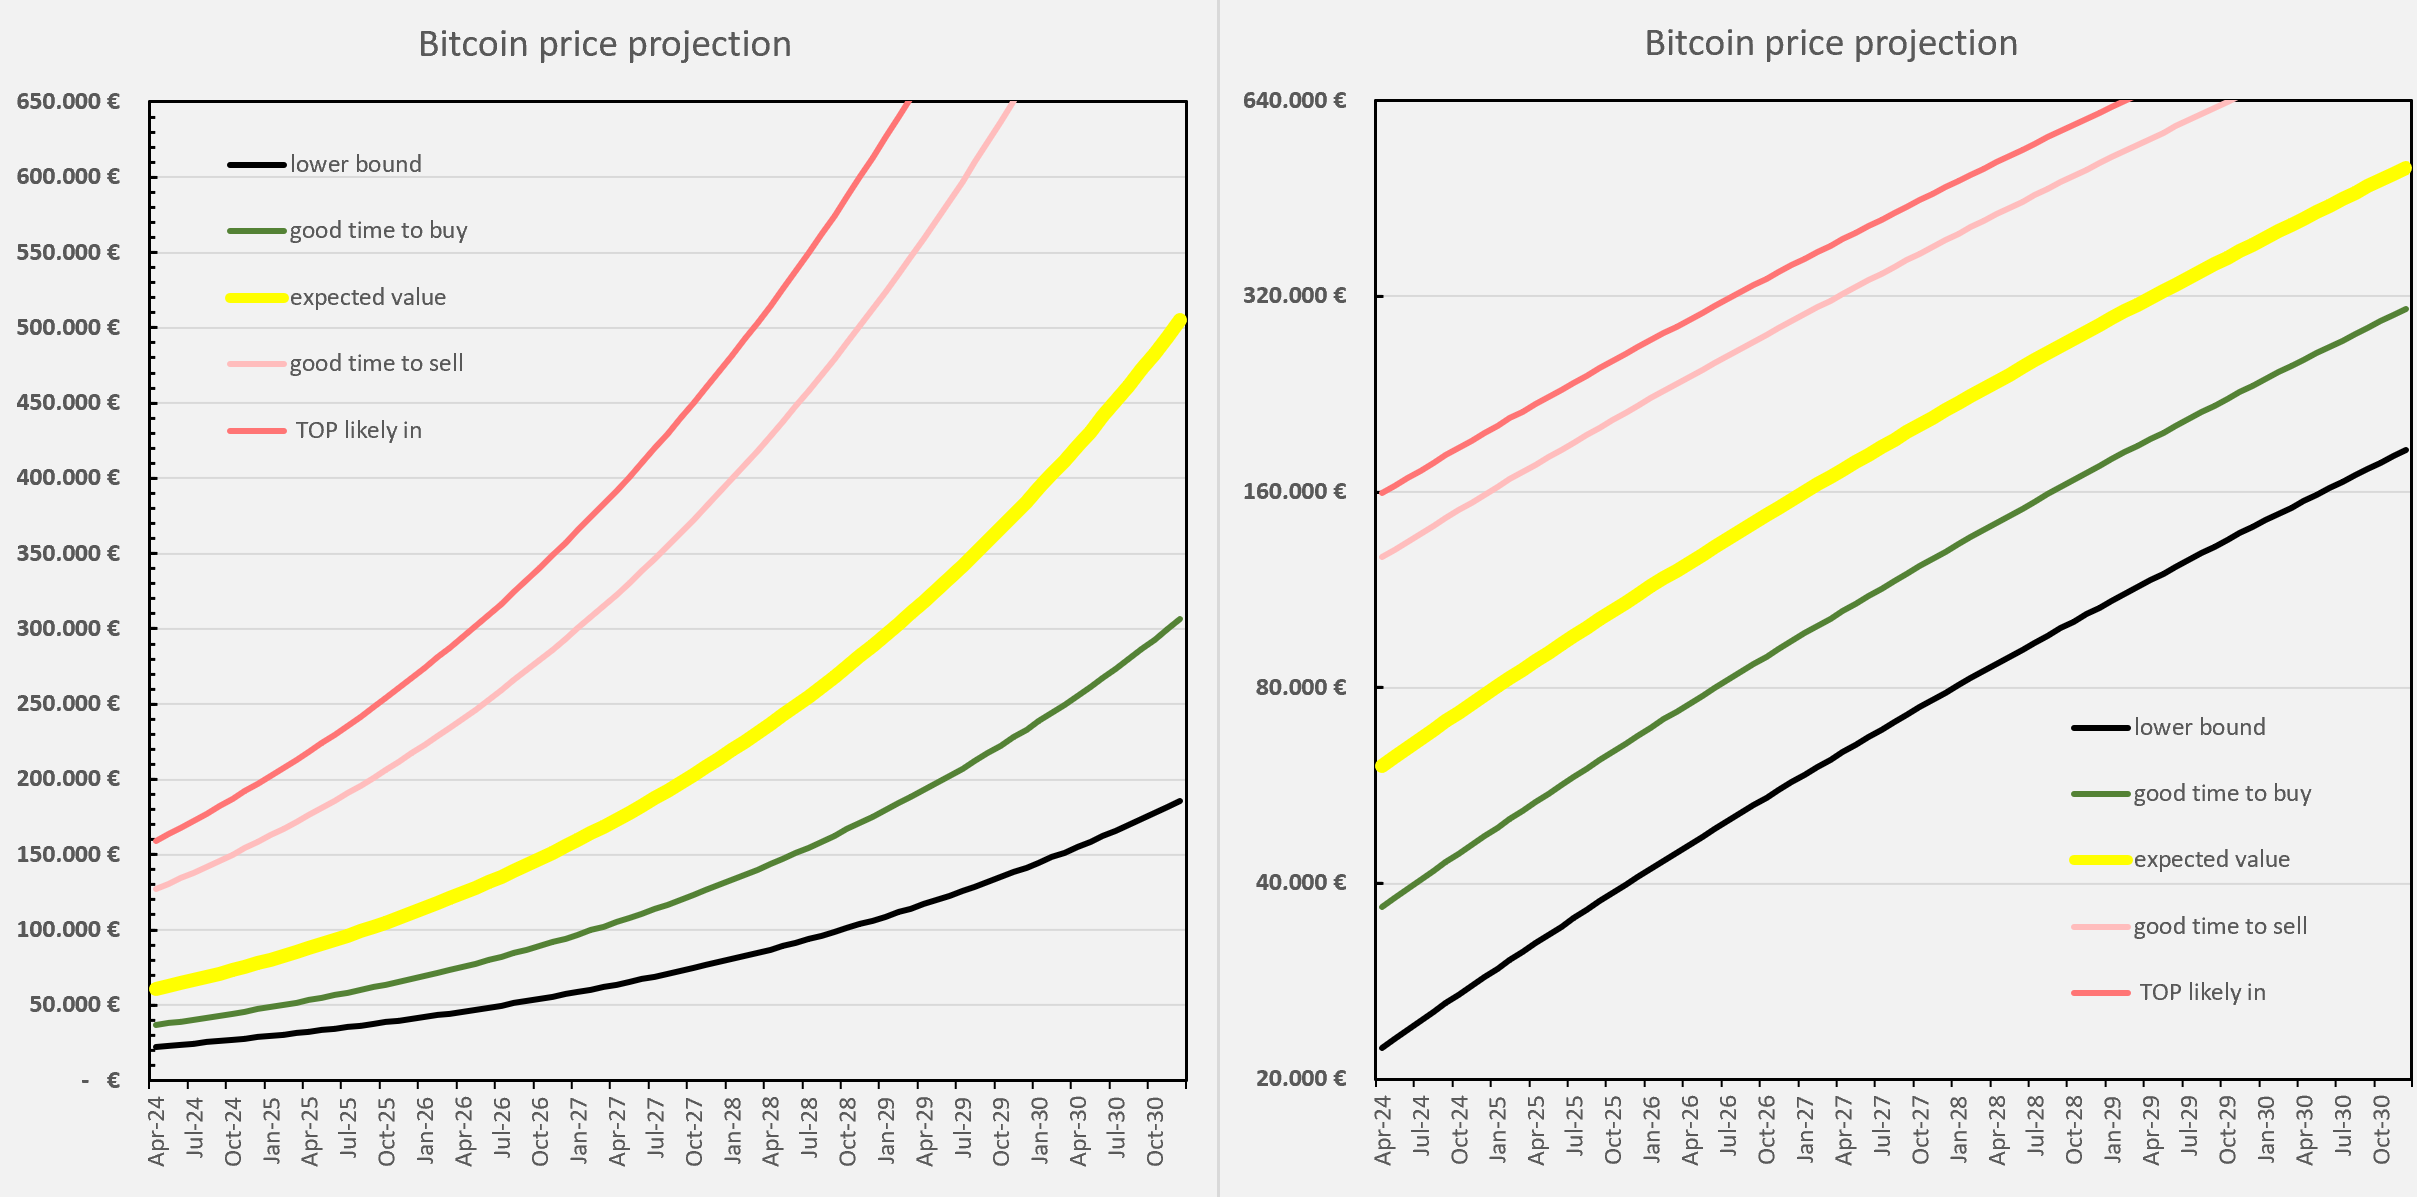 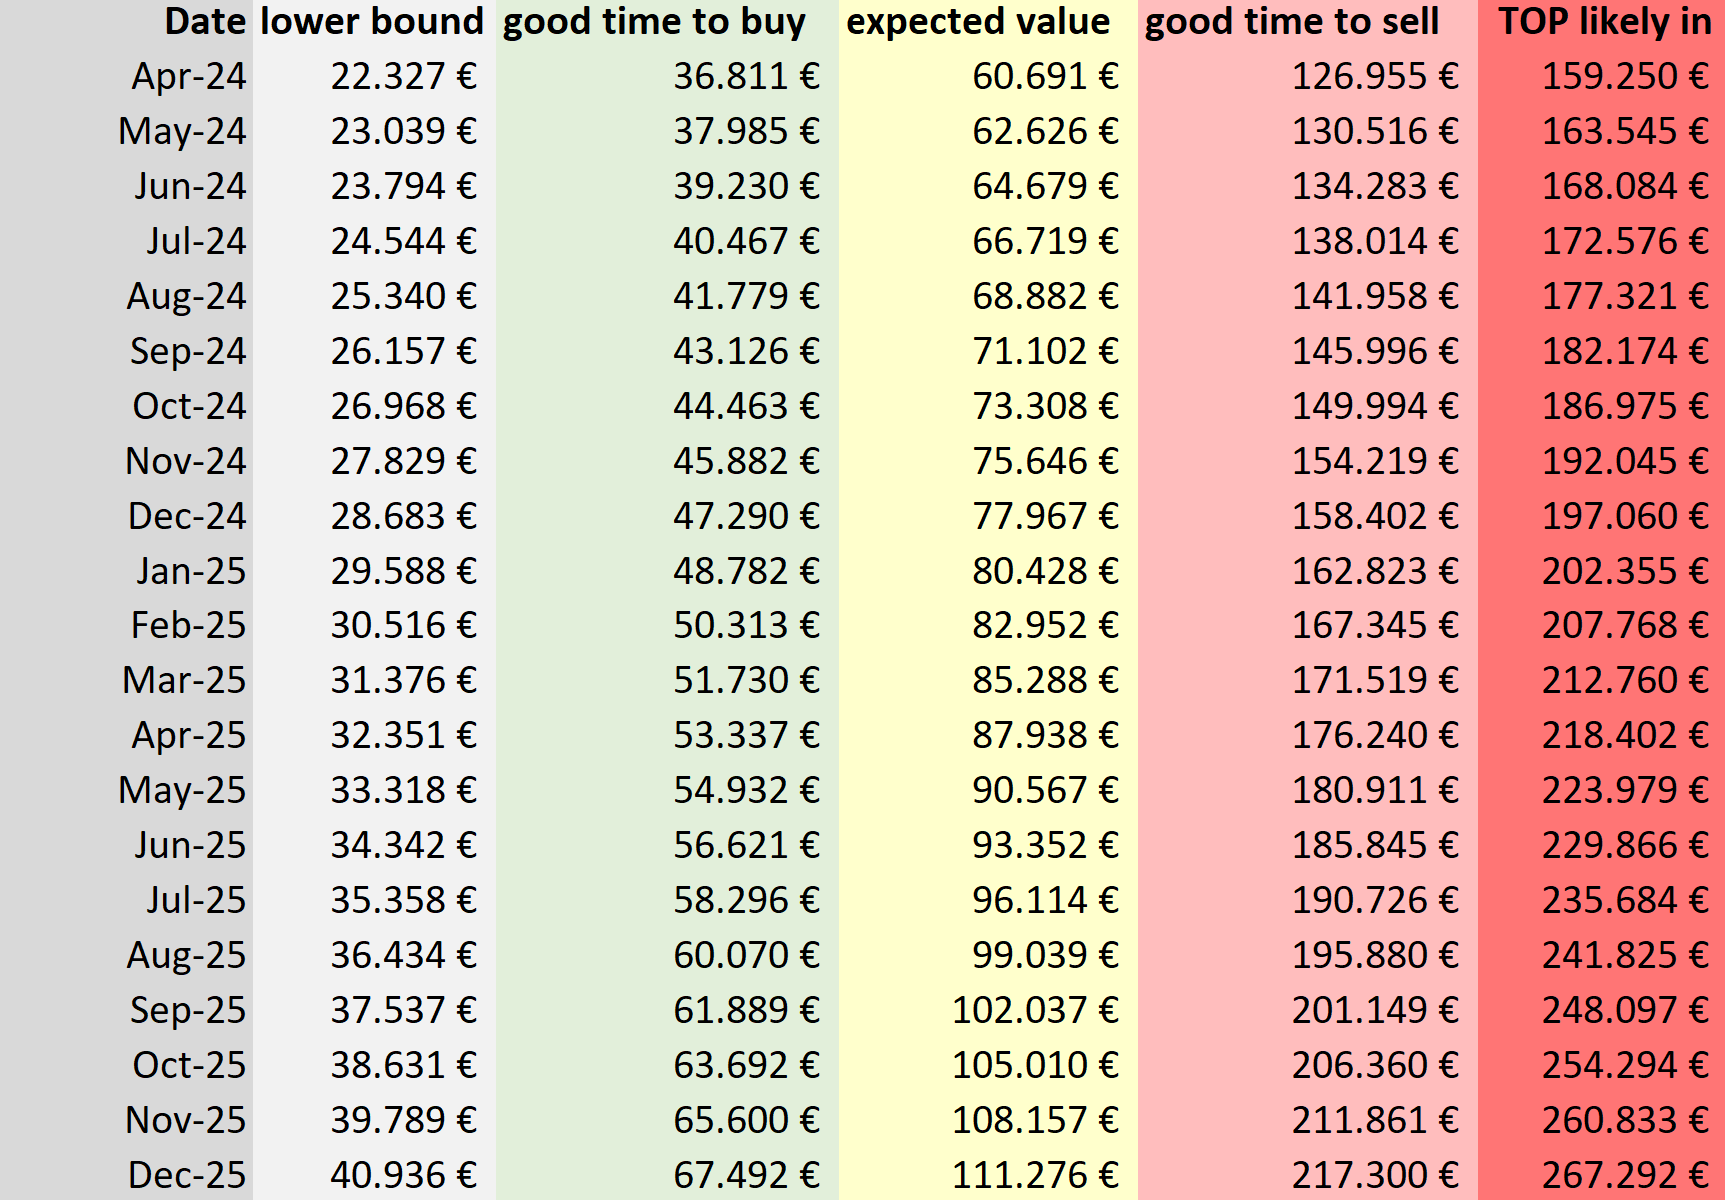 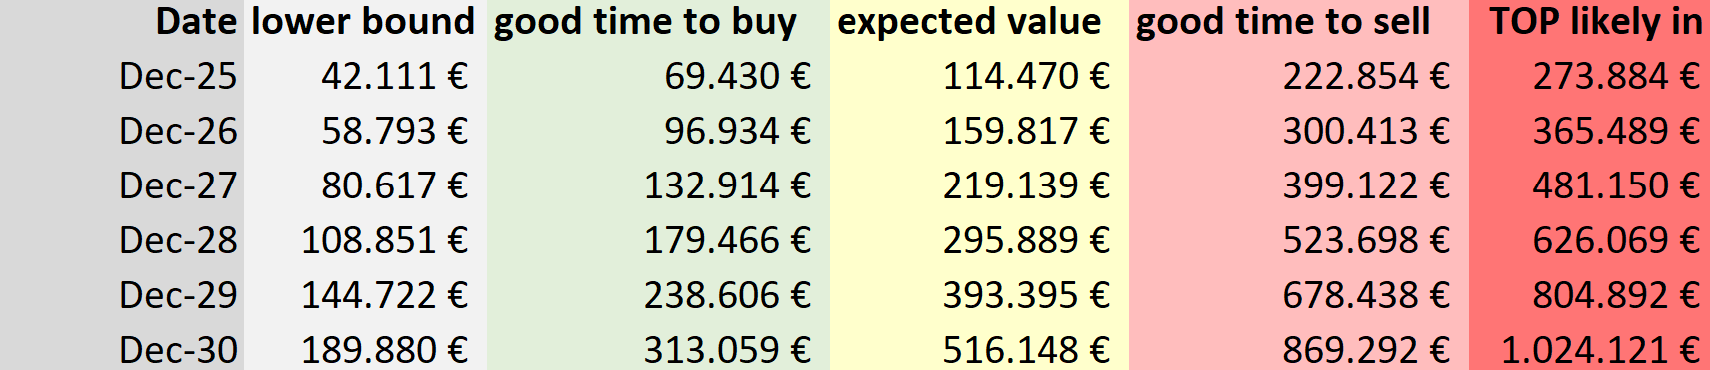 Please be aware, if you extrapolate multiple years into the future, it becomes more likely for the model to break down.
Regarding the avarages i guess you mean today +365-465 days?!
What do you think about using Monte-Carlo price simulation in Excel to close that gap and find a more precise X-Position for today?!
The yield is measured from today + 365 days, however for the purpose of smoothing we average over the last 100 days. As a results our circly charts show the average yield of [today vs. today+365 days], [today - 1 day vs. today+364 days], .... , [today - 99 days vs. today+266 days]. |
|
|
|
Evtl. könnte man sich die sterbenden Coins über längere Zeiträume auch günstiger leihen. Z.B. bei zentralisierten Lending Anbietern, wie BlockFi (die sind aber im Bärenmarkt insolvent gegangen) oder bei Defi-Protokollen auf ETH. FTX (auch pleite) hatte auch Indizes auf bestimmte Baskets von Coins angeboten, die man shorten könnte. https://cryptonary.com/ftxs-new-shitcoin-index-enables-traders-to-short-altcoins/Am besten man findet Leute für bilaterale Wetten. Es gibt ja Leute, die an Bitcoin Cash glauben. Diesen Leuten könnte man 5% Rendite in BTC-Cash versprechen. Du packst 10.000 Bitcoin in eine Multisig. Der andere packt 5.000 Bitcoin Cash in eine Multisig und man setzt einen Vertrag auf. Das wäre deutlich günstiger, aber wir hätten mehr Aufwand beim Suchen einer Gegenpartei und ein operationelles Risiko bei der Abwicklung. |
|
|
|
|
Haben wir historische Performance Zeitreihen für die CFDs? Mag sein, dass hier nochmal 20% p.a. Leihgebühren drin stecken. Man wird ja dem Verleiher die Stanking-rewards mitbezahlen müssen. Die Börse wird sich eine Marge rausschneiden. Und wir stehen im Wettbewerb mit anderen Shortstellern.
"Kraken offers stable and predictable fees for margin trades. Depending on the margin pair youre trading, you are charged between 0.01% and 0.02% to open a position. Rollover fees of the same amount occur every 4 hours the position remains open."
0.02% in 4 Stunden sind 44% im Jahr, das ist heftig.
Ich würde auch prüfen, wie die CFDs für die Steuer ausgewiesen werden. Futures muss man beispielsweise rollen. Das ist steuerlich unangenehm, weil man Gewinne auch dem Januar-Future mit Verlusten aus dem Februar Future verrechnen muss. Hier läuft man schnell in die 20.000 Verrechnungsgrenze.
Im worst case müssen wir die CFD-Gewinne von 0:00 - 4:00 Uhr mit dem CFD-Verlusten von 4:00 - 8:00 Uhr usw. verrechnen. Da kommen bereits ab einer shortposition von 2.000 über unsere 20.000 Verrechnungsgrenze.
|
|
|
|
|