|
BitDreams
|
 |
March 31, 2014, 11:43:26 PM |
|
Off w their heads! Hey I don't have any political opinions only economics. Just stating what happened. Why shoot the messenger?
Why would anyone give back their bonus when those were contractual obligations? Bailouts were repaid. Treasury received Citi stock or warrants (I forgot) and they made 2B in profit.
There were no criminal proceedings cause no crime was committed. You want argue ethics then I won't disagree w you. But cite me the law that was broken...
Im finished w this topic cause I don't want hijack this thread anymore
You don't have to be finished with the topic just yet. I want you to have the opportunity to have the last word. No crimes were committed, preposterous!  http://www.reuters.com/article/2013/12/24/us-banks-fines-idUSBRE9BN00I20131224 http://www.reuters.com/article/2013/12/24/us-banks-fines-idUSBRE9BN00I20131224 U.S. and European regulators fined banks record amounts this year, imposing penalties and settlements of more than $43 billion What were the fines for if not criminal actions? Marketing, legal and accounting discussion is where the dirt lies in any banking organization where the topic of conversation always begins with: is the crime worth the time? Or call it risk assessment if you need to sweep something under the rug. http://thinkprogress.org/economy/2014/01/21/3184401/banks-profits-2013-record The six largest banks made about $76 billion in combined profits in 2013, an annual haul second only to the $82 billion in total profits the banks recorded just before the financial crisis in 2006. So the banks paid big fines, whooped-de-do! That one or two bad profit years is now priced into the cost of doing business for future customers: Rotten to the core. |
|
|
|
|
|
|
|
|
|
"You Asked For Change, We Gave You Coins" -- casascius
|
|
|
Advertised sites are not endorsed by the Bitcoin Forum. They may be unsafe, untrustworthy, or illegal in your jurisdiction.
|
|
|
|
SlipperySlope (OP)
|
|
April 02, 2014, 02:28:00 AM
Last edit: April 02, 2014, 02:46:59 AM by SlipperySlope |
|
Summer 2014 Bitcoin Bubble - First ProjectionI hand fit this simple projection by copying the April 2013 bubble and the November 2013 bubble into the future, aligning both along the logistic model trendline. The vertical line separates the current Bitstamp price series from the future hypothesis. This first iteration of the 2014 Bitcoin bubble projection supposes that the peak occurs in July - August and that the ensuing collapse is underway in September. I project the peak at 6000 USD and the subsequent consolidation price at approximately 3000 USD through year end 2014. As the collapse of the current bubble resolves, perhaps further iterations of this projection can be more accurately placed. The crucial assumption of this projection is that the next bubble will be very similar to the previous two.
|
|
|
|
|
|
twiifm
|
|
April 02, 2014, 03:52:21 AM |
|
Seems like you are curve fitting along with selection bias. Are you a statician or trader?
|
|
|
|
|
|
SlipperySlope (OP)
|
|
April 02, 2014, 04:09:30 AM |
|
Seems like you are curve fitting along with selection bias. Are you a statician or trader?
Guilty as charged. The logistic model is hand fit according to my guess as to a maximum price value of one million USD, and my placement of the two previous bubbles into the future is biased by the supposition that the next bubble will be very similar to the previous two bubbles. I have an undergraduate degree in applied mathematics, which gives me a certain comfort with numbers. I last traded bitcoin back in the summer of 2013, mistiming the exact bottom and paying for it when I bought back in. My timing of the two previous bubble peaks has been satisfactory however, and I am considering a trade off the next bubble peak, or at a minimum a postponement of mining equipment purchases and other major bitcoin spending until the peak - which I will recognize by the simple method of counting the days for each doubling from the low. When the price looks to double in less than a week - I sell. Of course my posts are biased because I am a bitcoin holder and want others to participate in the economy and thus lift prices. Satoshi factored in the enthusiasm of early adopters as he designed the virtuous circle that has brought us this far. |
|
|
|
|
|
twiifm
|
|
April 02, 2014, 04:18:44 AM |
|
As a trader have you tried fibonacci retracement & extension on your charts?
I use fib numbers a lot on my charts for price guidance. Not necessarily for predictive value.
|
|
|
|
|
|
SlipperySlope (OP)
|
|
April 02, 2014, 05:06:10 AM
Last edit: April 03, 2014, 03:34:31 AM by SlipperySlope |
|
As a trader have you tried fibonacci retracement & extension on your charts?
I use fib numbers a lot on my charts for price guidance. Not necessarily for predictive value.
I have not used them much because my trading is very coarse grained. Back in April 2013, which was my best trade, I set a spread of sell orders as the prices appeared to double in the week leading up the peak. This was at Mt. Gox. Most of the sell orders got filled, I did not know where the first pullback would exactly be - who could - but I spread my buy-back orders around $120 which was a 50% retracement from $240 which was the last time I could reliably place an order on Gox that near the peak. Bitcoin Wisdom has a lovely Fibonacci line drawing feature that I may further explore. And I have come to depend on BitDreams' charts posted occasionally in this thread. |
|
|
|
|
|
BitDreams
|
|
April 02, 2014, 10:49:26 PM |
|
I'll take that as an invitation to post another chart: I tried my hand at a new bitcoin chart using an alternate ticker but I couldn't figure out how to plot it back to the low on the mtGox chart of 1 penny back in 2010 so I had to resort to some curve fitting on where to place the handle. I would recommend browsing the numerous other charting efforts @ https://www.tradingview.com/?q=BITCOINWhen I visited tradingview just now writing this post, this users chart was at the top of the page and I found it informative. https://www.tradingview.com/u/CoinCrack/I am just now to the point where pieces of Bitcoin are qualifying for capital gains here in the US so my tolerance for price decreases are high. I'm not predicting price into the $380's on these charts, but the price breakdown against the fibs as I have them fit places that as a fib retracement target. 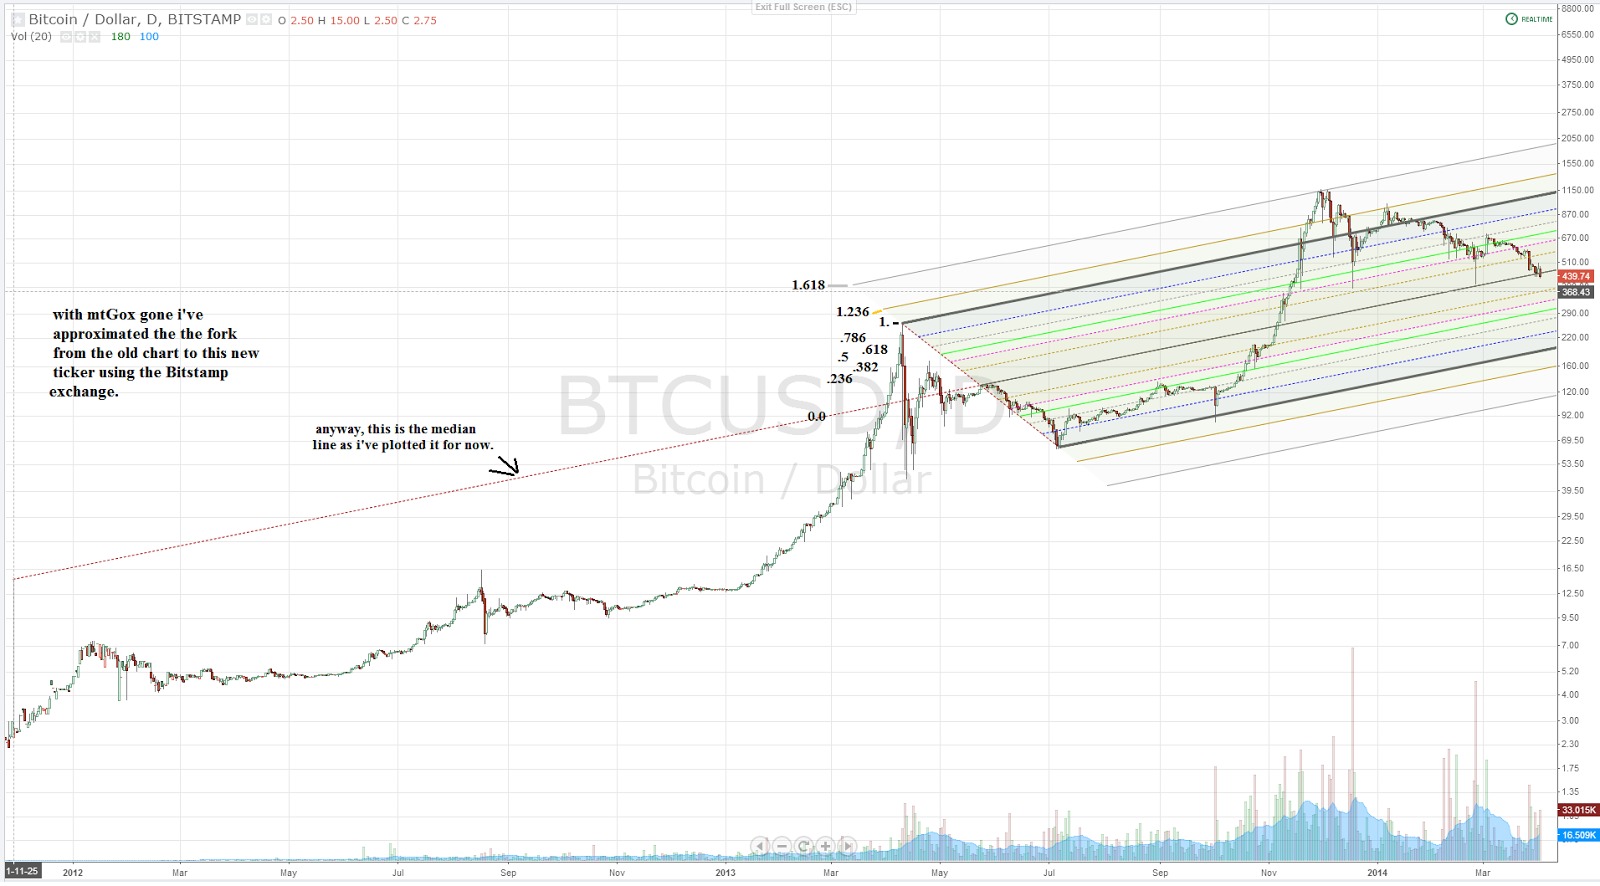 The chart above most closely approximates the mtGox chart posted earlier in this thread. 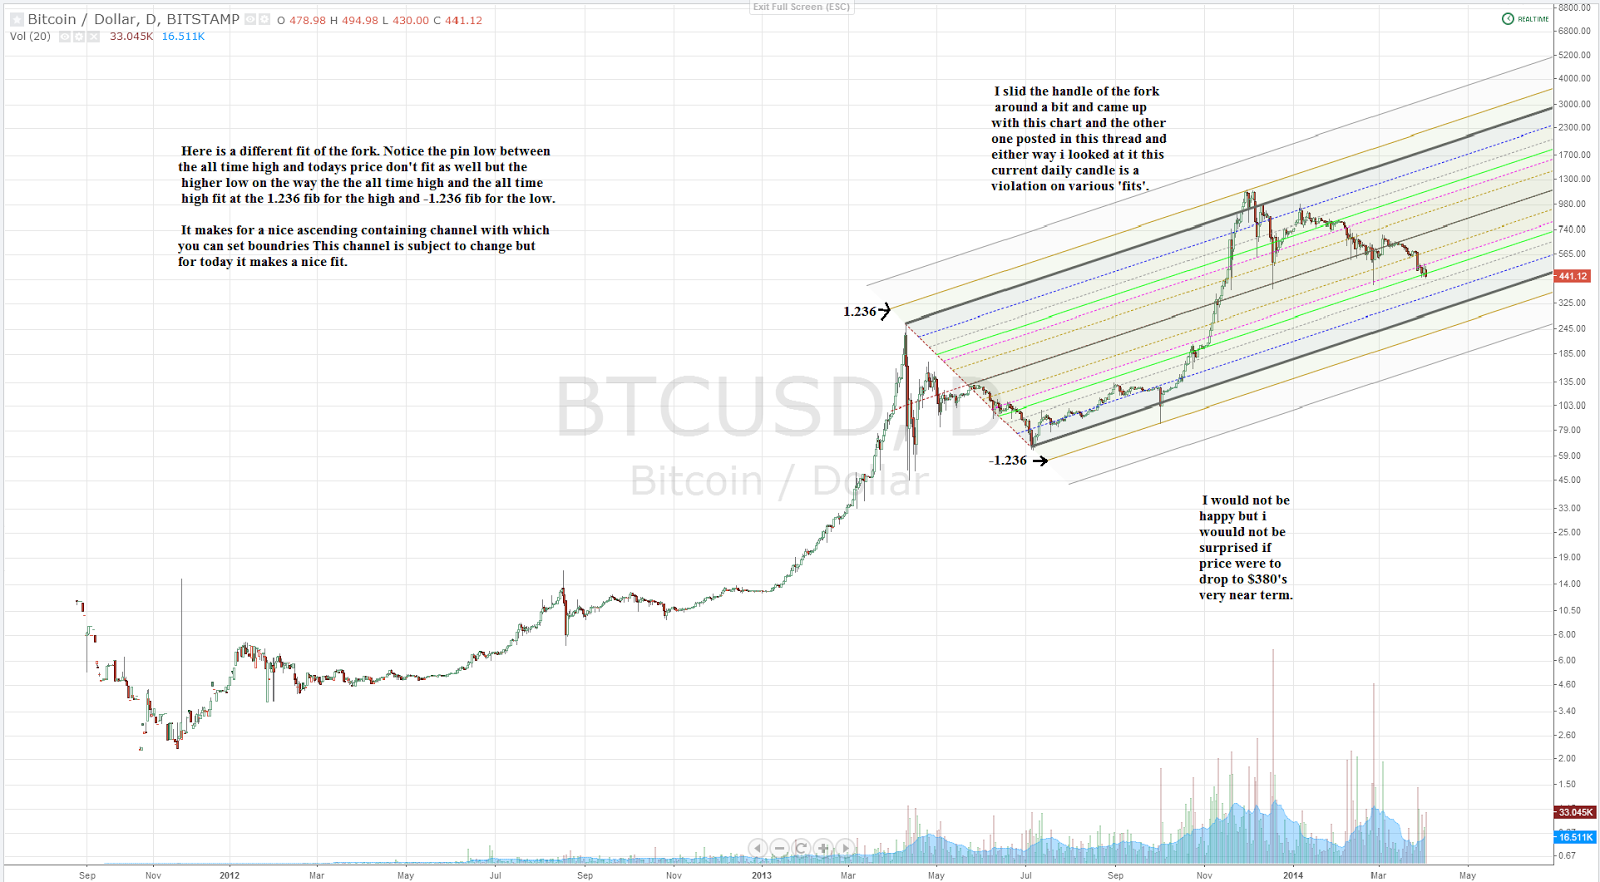 After some curve fitting by moving the handle around on the fork I might like the steeper channel better - time will tell, let's see where a few more lows and highs form. |
|
|
|
|
|
twiifm
|
|
April 03, 2014, 12:40:16 AM |
|
Why do you use logarithmic scale?
|
|
|
|
|
|
BitDreams
|
|
April 03, 2014, 02:30:40 AM |
|
With exponential growth already on the charts I'm not going to fight the trend.
|
|
|
|
|
|
twiifm
|
|
April 03, 2014, 02:47:39 AM |
|
With exponential growth already on the charts I'm not going to fight the trend.
I meant. Is there a technical reason? Why do you do Technical Analysis w log vs linear? |
|
|
|
|
marcus_of_augustus
Legendary

 Offline Offline
Activity: 3920
Merit: 2348
Eadem mutata resurgo

|
|
April 03, 2014, 03:15:08 AM |
|
With exponential growth already on the charts I'm not going to fight the trend.
I meant. Is there a technical reason? Why do you do Technical Analysis w log vs linear? He just said .. representing logarithmic growth on linear chart is nonsensical. 0.1 does not register on chart that has a scale to 1000. |
|
|
|
|
SlipperySlope (OP)
|
|
April 03, 2014, 03:40:08 AM |
|
With exponential growth already on the charts I'm not going to fight the trend.
I meant. Is there a technical reason? Why do you do Technical Analysis w log vs linear? Sure technical analysis could be performed on a linear chart, but then all the trend lines added the chart by the analyst would have to be exponential and no tool I know can do that. I suggest that linear charts are best used for brief time frames, e.g. days, in which the exponential curves are flatter, and might effectively be ignored. |
|
|
|
|
|
BitDreams
|
|
April 04, 2014, 02:22:52 PM |
|
Thanks for the analysis. While the Global GDP is 87 Trillion. Online Sales is just 1 Trillion.
Now I'm wondering how much bitcoin can grow online sales, increasing Global GDP along with it. |
|
|
|
|
|
SlipperySlope (OP)
|
|
April 04, 2014, 02:57:32 PM
Last edit: April 05, 2014, 03:39:14 AM by SlipperySlope |
|
Thanks for the analysis. While the Global GDP is 87 Trillion. Online Sales is just 1 Trillion.
Now I'm wondering how much bitcoin can grow online sales, increasing Global GDP along with it. Physical stores enjoy the same cost savings that online stores gain via bitcoin. However, online stores must overcome privacy and identity theft issues that customers are more likely to associate with them. Consequently, as trust in the bitcoin payment method attaches itself to online stores, then indeed a barrier to online sales growth diminishes. I believe global GDP growth will accelerate as bitcoin adoption removes the immense friction caused by the current financial infrastructure and reallocates the 10% of the developed nations' workforce who maintain that legacy. |
|
|
|
|
|
jamesc760
|
|
April 11, 2014, 10:21:15 PM |
|
This thread should be a sticky and a must-read for noobs and perma-bears.
|
|
|
|
|
|
SlipperySlope (OP)
|
|
April 16, 2014, 02:41:20 PM |
|
Log10 Differences From the Logistic Model TrendlineI added a column to the calculations sheet of the Bitcoin Logistic Model. This column subtracts the Log10 model price from the Log10 actual price. By using Log10, the result allows comparison of the relative price deviation from the trend regardless of the time frame. Buy, sell and hold technical indicators could be extracted from the data for the April 2013 and November 2013 bubbles that would be very useful assuming that the next bitcoin price bubble is similar in shape to the previous two. For example, suppose a value of +0.3 indicates an opportunity to sell near the bubble high, -0.3 indicates an opportunity to sell near the bubble low, and other values indicate hold. Buy October 26, 2012 at $10 Sell April 5, 2013 at $140 Buy October 3, 2013 at $110 Sell November 22, 2013 at $743 Buy April 1, 2014 at $478 
|
|
|
|
|
|
BitchicksHusband
|
|
April 16, 2014, 08:39:46 PM |
|
Log10 Differences From the Logistic Model TrendlineI added a column to the calculations sheet of the Bitcoin Logistic Model. This column subtracts the Log10 model price from the Log10 actual price. By using Log10, the result allows comparison of the relative price deviation from the trend regardless of the time frame. Buy, sell and hold technical indicators could be extracted from the data for the April 2013 and November 2013 bubbles that would be very useful assuming that the next bitcoin price bubble is similar in shape to the previous two. For example, suppose a value of +0.3 indicates an opportunity to sell near the bubble high, -0.3 indicates an opportunity to sell near the bubble low, and other values indicate hold. Buy October 26, 2012 at $10 Sell April 5, 2013 at $140 Buy October 3, 2013 at $110 Sell November 22, 2013 at $743 Buy April 1, 2014 at $478 This is a graph of what Risto (rpietila) has been saying all along. |
1BitcHiCK1iRa6YVY6qDqC6M594RBYLNPo
|
|
|
|
SlipperySlope (OP)
|
|
April 16, 2014, 09:39:41 PM |
|
This is a graph of what Risto (rpietila) has been saying all along.
This whole thread and this graph in particular are inspired by our Finnish Friend. |
|
|
|
|
bitebits
Legendary
Offline
Activity: 2211
Merit: 3178
Flippin' burgers since 1163.
|
|
April 16, 2014, 10:29:18 PM |
|
Thanks for adding the Log10 Differences From the Logistic Model Trendline Slipperyslope.
You and a few others are really adding some value to this forum!
|
- You can figure out what will happen, not when /Warren Buffett - Pay any Bitcoin address privately with a little help of Monero. |
|
|
|
SlipperySlope (OP)
|
|
April 17, 2014, 12:01:15 AM |
|
Thanks for adding the Log10 Differences From the Logistic Model Trendline Slipperyslope.
You and a few others are really adding some value to this forum!
I believe that Peter R today pointed out the value of contributing to the community. |
|
|
|
|
|


