dragonvslinux (OP)
Legendary

 Offline Offline
Activity: 1666
Merit: 2204
Crypto Swap Exchange

|
 |
June 14, 2020, 12:20:15 PM
Last edit: June 21, 2020, 12:31:08 PM by dragonvslinux |
|
While the community appears very split between bullish and bearish bias', as some analysts remain neutral, here's an in depth overview as to why this might be the case.
Indicators used: Moving averages (MAs), Volume Profile Volume Range (VPVR), TI Indicator (TD Sequential), Chaikin Money Flow (CMF) and Relative Strength Index (RSI).
See (TL:DR) overview near the bottom of this post for summary.
Daily chart - 60/40 bullish bias with ascending triangle pattern  Bulls are currently finding support from the 50 Day MA (after the golden cross of the 50 & 200 Day MA), the 50 MA being the first re-test of bullish support. Price found support from a bullish ascending triange formation, that statistically speaking has a 70% of breaking to the upside with a measured move to somewhere between $11.8-12.3K. The RSI remains neutral, the CMF is currently positive and maintaining momentum. Price has corrected with a 1-4 candle correction on the TD, as expected within bull markets, while sitting just below the VPVR (volume) point of control of $9468. See also alternative perspective of bull flag structure further down that remains relevant to the bullish bias perspective.
Weekly chart - 55-45 bearish bias with TD sell signal and Red 1 candle (unconfirmed)  The larger picture is more subjective, with many factors that come down to bullish or bearish perspectives. Firstly, the TD Sequential signalling a TD 9 Sell signal, however based on the previous two times this was signaled, price continued to move higher (April & June 2019). The difference this time is this weeks candle is threatening to close as a Red 1, which therefore would definitely signal a long-term sell signal if price moves below the lows of this weeks candle (next week) at $9,078. Breaking down from $9K would signal bearish trend change on the Weekly chart, based on this indicator alone. Depending on how you draw your long-term resistance trend-line - from the December 2019 highs of $20K with the 2019 $14K and 2010 $10K highs - price is arguably continuing to find support from this trend-line after closing two non-consecutive candles above it. This can be seen clearer from the 4hr chart (yellow line) also referenced below. However, given the subjectivity of these types of trend-lines, it's also possible to consider price finding strong resistance at this level with a bearish bias. The RSI remains in the neutral zone, while the CMF also remains more-or-less neutral. Apart from the potential bullish support from the long-term trend line, there are definite bearish factors arising from the TD and strong horizontal resistance. Shifting the mid-term VPVR point of control to $9,491 is inherently bullish, however price needs to close above this level for a bullish bias.
4hr chart - 50-50 no bias with bullish pattern and bear flag structure  While price found support from the bullish ascending triangle pattern, price is now struggling to find support from the 200 MA, despite the 50 MA remaining above the 200 - as well as failing to cross below the 200 last month - therefore remains in bullish formation until a bear cross is confirmed. Similar to the Daily and Weekly charts, price sits below the VPVR point of control at $9492. Price therefore needs to close back above the 200 MA and VPVR to return to a 60-40 bullish bias, but remains to be seen as of writing, hence current neutral bias. Moving back above $9.5K, in order to re-target the horizontal resistance of the ascending triangle pattern, would return my bullish bias. The RSI is within the neutral zone of 40-60 (after briefly becoming bearish for a few candles), however the CMF is turning bearish and gaining momentum which is a cause for concern. With price trading sideways, there is an argument for a bear flag structure that would target the $8.8K level. This would however remain within a bull flag structure on a Daily time frame, as also referenced below. With price otherwise trading within the ascending triangle structure, there is still the 70% probability price will break upwards, despite short-term bearish factors. Next weeks candle is likely to be critical in determining the long-term trend of Bitcoin in the coming weeks.
Daily chart - 55-45 bullish bias alternative bull flag perspective (lacks confirmation of three touch-points per support/resistance)  Of concern on the Daily chart now referenced above is the confirmation of bearish divergence on the RSI, that would need to be broken in order to confirm stronger bullish bias: 
Overview (TL:DR) - 60-40 bullish bias likely to be reduced to 55-45 bullish bias next week - While in the past Week I've been 60-40 bullish bias overview, closing the Weekly candle on a TD on a Red 1 would shift this to 55-45 slight bullish bias.
- A move below $9K (on a Red 2 candle moving below a Red 1) would give me a 60-40 bearish bias, as a strong sell signal would be confirmed.
- A break below $8.8K (bull flag structure) would confirm a 70-30 bearish bias, with the target of around an $8K Bitcoin to the 100 & 200 Day MAs.
Although still remaining slightly bullish for now, until the end of the day at least, I don't believe price will find support from the 100/200 Day MAs around $8K if price breaks down from the bull flag structure, instead finding it more likely to return to somewhere between the 100 Week MA around $7.25K and the VPVR point of control of $6.5K. Re-testing the 200 Week MA around $6K I find unlikely, instead I'd expect the market to front-run those trying to buy this reliable long-term "line in the sand" price support MA.
Monthly chart - remains fully bullish as per usual  While only half way through the month, therefore overlooking this month's current candle that has two weeks to go, the TD sequential is on a Green 3, after the long bullish wick of March 2020. Price is otherwise above the 20, 50 & 100 MAs - that are all bullish formation ( as always). Strong volume support is at the VPVR point of control of $6,569. The RSI is currently neutral while the CMF is negative but with bullish divergence based on recent months price action, pointing towards a long-term bull-run by the end of the year: 
|
|
|
|
|
|
|
|
|
If you want to be a moderator, report many posts with accuracy. You will be noticed.
|
|
|
Advertised sites are not endorsed by the Bitcoin Forum. They may be unsafe, untrustworthy, or illegal in your jurisdiction.
|
|
|
|
|
dragonvslinux (OP)
Legendary
Offline
Activity: 1666
Merit: 2204
Crypto Swap Exchange
|
|
June 14, 2020, 02:05:38 PM |
|
For reference sake, here would be a setup for a short trade using the TD Sequential 9 Sell signal next week, based on the current candle closing as a Red 1: - Entry: $9,078: a Red 2 moving below the Red 1 candle after a TD 9 Sell signal
- Target: $7,250: 100 Week MA support and 0.382 fib retracement level
- Stop: $10,012: a move above the Red 1 candle
- Risk/reward: 1.95. 10% risk, 20% reward.
 Given the strong volume support (VPVR POC) around $8,699, as well as the 50 Week MA at $8,735, it'd be wise to move a stop loss to break even entry ($9,078) or slightly higher ($9,200, depending on your risk tolerance) to re-test ascending triangle support turned resistance, in order to reduce risk. The trade could then alternatively be moved over to the Daily chart with a target of the 100/200 Day MA around $8K with a much better risk/reward ratio. Given that this trade would be a 1.95 risk/reward ratio at setup, while most traders prefer a minimum of 2:0 risk/reward, I'd consider it a medium to high risk trade. It's worth noting that despite the bullish conditions at present with price above the 50 Week MA, this important MA - as well as the 21 Week MA - have begun to roll over with a slightly declining trajectory due to the March capitulation that occurred, consequently the 21 MA has therefore failed to move above the 50 MA in recent weeks. This implies that long-term price is not yet fully bullish, with MAs not in bullish formation while shorter-term MAs are beginning to decline: therefore a pull-back is to be anticipated. In contrast, the 100 & 200 Week MAs are still rising, implying that they should act as strong support should price correct, and long-term price is likely to continue moving higher. Depending on how this week closes, I'd consider allowing this trade to trigger with a small position size (smaller than usual). |
|
|
|
Dollar_Hunter
Member
 Offline
Activity: 1078
Merit: 21
COMBONetworkio
|
|
June 14, 2020, 03:18:20 PM |
|
means that if a conclusion is drawn, it seems that Bullish is still winning,
I also analyze it like that, because Long in futures trading is more than Short
|
|
|
|
dragonvslinux (OP)
Legendary
Offline
Activity: 1666
Merit: 2204
Crypto Swap Exchange
|
|
June 15, 2020, 02:24:58 PM |
|
4hr chart - 50-50 no bias with bullish pattern and bear flag structure While price found support from the bullish ascending triangle pattern, price is now struggling to find support from the 200 MA, despite the 50 MA remaining above the 200 - as well as failing to cross below the 200 last month - therefore remains in bullish formation until a bear cross is confirmed. Similar to the Daily and Weekly charts, price sits below the VPVR point of control at $9492. Price therefore needs to close back above the 200 MA and VPVR to return to a 60-40 bullish bias, but remains to be seen as of writing, hence current neutral bias. Moving back above $9.5K, in order to re-target the horizontal resistance of the ascending triangle pattern, would return my bullish bias. The RSI is within the neutral zone of 40-60 (after briefly becoming bearish for a few candles), however the CMF is turning bearish and gaining momentum which is a cause for concern. With price trading sideways, there is an argument for a bear flag structure that would target the $8.8K level. This would however remain within a bull flag structure on a Daily time frame, as also referenced below. With price otherwise trading within the ascending triangle structure, there is still the 70% probability price will break upwards, despite short-term bearish factors. Next weeks candle is likely to be critical in determining the long-term trend of Bitcoin in the coming weeks. 4hr bear flag has played out by the looks of it, but notably still within an ascending triangle pattern after re-alligning with the new lows forming. The new lows formed on the 4hr chart look suspiciously like a short-term bear trap, if price can stay above $9K and close the day above the 50 Day MA at $9.3K to re-test $9.5K levels.  Price is otherwise still within in the bull flag with a long wick forming on the Daily chart that looks bullish for now:  Will remain 55-45 bullish bias with price above $9K, despite last Week closing as a Red 1. |
|
|
|
dragonvslinux (OP)
Legendary
Offline
Activity: 1666
Merit: 2204
Crypto Swap Exchange
|
|
June 18, 2020, 11:42:35 AM |
|
4hr bear flag has played out by the looks of it, but notably still within an ascending triangle pattern after re-alligning with the new lows forming. The new lows formed on the 4hr chart look suspiciously like a short-term bear trap, if price can stay above $9K and close the day above the 50 Day MA at $9.3K to re-test $9.5K levels. Short-term on the 4hr another bearish factor is emerging, the 50 MA is now crossing below the 200 MA for a 4hr death cross. While only emerging on the 4hr (given price is still above the 50 & 200 Day MAs that are in bullish formation), this would be the sell signal for MA traders from the April 7th buy signal around $7,300. Given we are still within the ascending triangle structure referenced above, I'll remain neutral on this time-frame until the ascending triangle structure is broken. This could be another bear trap, although decreasing volume is another cause for concern. The CMF remains positive and rising, the RSI is currently neutral. We are otherwise struggling to stay above the VPVR point of control: 
Daily chart - 55-45 bullish bias alternative bull flag perspective (lacks confirmation of three touch-points per support/resistance) On the Daily chart, we are finding support from the 50 Day MA which is encouraging, but price needs to keep moving higher in the near future to remain above it, otherwise a re-test of the 200 Day MA around $8,300 appears inevitable, if the 50 Day MA flips to resistance overtime. On the candle-stick chart, we otherwise more-or-less confirmed the support level of the bull flag structure with a third point of confirmation, while creating the bear trap of the ascending triangle merely shifting it's support trend-line:  Based on the line chart perspective, we are currently forming a short-term bear flag on the Daily time-frame that would re-target the strong support level of the marco bull flag structure around $8,800. While a re-test of the bull flag structure wouldn't be inherently bearish if price finds support at this level, it would instead be even more bullish to further confirm this trading range (at the highs), as long as price bounces strong and doesn't get trapped below the 50 Day MA afterwards. Similar to the 4hr perspective, price is struggling to move back above the VPVR point of control and strengthening resistance of $9.5-$9.6K. A 100 & 200 Day bull cross looks set for this month around $8,300 which is positive development however, that would align all relevant MAs into bullish formation: 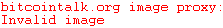 The bearish divergence on the RSI remains in tact, as referenced in the OP, price needs to move higher in order to breach this bearish signal:  Regardless, while remaining within an ascending triangle structure on the 4hr, as well as a macro-sized bull flag on the Daily chart, I'll remain 55-45 bullish until proven otherwise. Nothing to add on the Weekly charts for now. |
|
|
|
dragonvslinux (OP)
Legendary
Offline
Activity: 1666
Merit: 2204
Crypto Swap Exchange
|
|
June 19, 2020, 04:01:51 PM
Last edit: June 19, 2020, 08:46:59 PM by dragonvslinux Merited by cryptoperkele (1) |
|
Short-term on the 4hr another bearish factor is emerging, the 50 MA is now crossing below the 200 MA for a 4hr death cross. While only emerging on the 4hr (given price is still above the 50 & 200 Day MAs that are in bullish formation), this would be the sell signal for MA traders from the April 7th buy signal around $7,300. Given we are still within the ascending triangle structure referenced above, I'll remain neutral on this time-frame until the ascending triangle structure is broken. This could be another bear trap, although decreasing volume is another cause for concern. The CMF remains positive and rising, the RSI is currently neutral. We are otherwise struggling to stay above the VPVR point of control: Price got rejected by the 50 & 200 MA death cross on the 4hr (pink hammer) as anticipated, the last death cross was seen in February 2020 before price crashed by 50+% - hence profit taking occurring due to this risk-reduction selling pressure. Bitcoin is now re-testing the 50 MA (purple line, yellow hammer) that becomes the entry for the short signal on this time-frame: selling the re-test of the 50 MA that's sloping downwards with bearish momentum after crossing below the 200 MA. Despite being within the ascending triangle structure, it's hard not to start leaning bearish with a 55-45 bias. Price will need to find support from the ascending triangle support trend-line, otherwise all hell could break lose.  I'm still remaining 55-45 bullish on the Daily time-frame, but closing below the 50 Day MA would put me back on the 50-50 fence, as long as we hold $8,800 macro bull flag / trading range support. The 50 Day MA now sits at $9,387 and is rising indicating bullish momentum, but price needs to maintain this momentum by closing above this MA in order to avoid breaking down further to the $8.8K bull flag support target, or potentially lower to re-test the 200 Day MA around $8,3K (for the first time since the golden cross) if bears follow through with volume: On the Daily chart, we are finding support from the 50 Day MA which is encouraging, but price needs to keep moving higher in the near future to remain above it, otherwise a re-test of the 200 Day MA around $8,300 appears inevitable, if the 50 Day MA flips to resistance overtime. On the candle-stick chart, we otherwise more-or-less confirmed the support level of the bull flag structure with a third point of confirmation, while creating the bear trap of the ascending triangle merely shifting it's support trend-line: Based on the line chart perspective, we are currently forming a short-term bear flag on the Daily time-frame that would re-target the strong support level of the marco bull flag structure around $8,800. While a re-test of the bull flag structure wouldn't be inherently bearish if price finds support at this level, it would instead be even more bullish to further confirm this trading range (at the highs), as long as price bounces strong and doesn't get trapped below the 50 Day MA afterwards. The bearish divergence on the RSI remains in tact, as referenced in the OP, price needs to move higher in order to breach this bearish signal: Regardless, while remaining within an ascending triangle structure on the 4hr, as well as a macro-sized bull flag on the Daily chart, I'll remain 55-45 bullish until proven otherwise. |
|
|
|
dragonvslinux (OP)
Legendary
Offline
Activity: 1666
Merit: 2204
Crypto Swap Exchange
|
|
June 20, 2020, 06:10:28 AM |
|
Price got rejected by the 50 & 200 MA death cross on the 4hr (pink hammer) as anticipated, the last death cross was seen in February 2020 before price crashed by 50+% - hence profit taking occurring due to this risk-reduction selling pressure. Bitcoin is now re-testing the 50 MA (purple line, yellow hammer) that becomes the entry for the short signal on this time-frame: selling the re-test of the 50 MA that's sloping downwards with bearish momentum after crossing below the 200 MA. Despite being within the ascending triangle structure, it's hard not to start leaning bearish with a 55-45 bias. Price will need to find support from the ascending triangle support trend-line, otherwise all hell could break lose. Price is continuing to get knocked down by MA resistance, as previously referenced. We also appear to be in a bear channel that could target a breakdown of the macro sized bull channel around $8,650. The $9,250-$9.300 horizontal support is weakening, without a strong bounce soon, lower lows seem the most likely outcome. RSI price strength has bounced twice from 40, but is failing to move higher and remains in a clear downtrend. The CMF has flat-lined again and threatening to turn negative, it's therefore not looking good for the bulls anymore on this time-frame, now leaning 60-40 bearish, despite being within an ascending triangle, predominantly due to the MA death cross that occurred:  I'm still remaining 55-45 bullish on the Daily time-frame, but closing below the 50 Day MA would put me back on the 50-50 fence, as long as we hold $8,800 macro bull flag / trading range support. The 50 Day MA now sits at $9,387 and is rising indicating bullish momentum, but price needs to maintain this momentum by closing above this MA in order to avoid breaking down further to the $8.8K bull flag support target, or potentially lower to re-test the 200 Day MA around $8,3K (for the first time since the golden cross) if bears follow through with volume On the Daily chart, we are still within an ascending triangle and above Weekly long-term resistance for now, so there is still hope, but we closed below the 50 Day MA that is likely to act as resistance if price doesn't break back above it in quickly. Zooming out, the fib retracements levels from the March 16th low to the June 1st high leaves a lot of room to the downside is the main concern here. While the 0.618 could act as strong support with the 100 & 200 Day MAs bull-crossing, anywhere between the 0.382 and 0.5 becomes fair game ($6.7-7.5K) for a longer-term "bullish" correction, if a breakdown is to occur. I'm back on the fence 50-50 on this time-frame, until a clearer picture emerges:  Will wait for the end of the Week before re-considering any further the longer-term picture. |
|
|
|
dragonvslinux (OP)
Legendary
Offline
Activity: 1666
Merit: 2204
Crypto Swap Exchange
|
|
June 20, 2020, 11:51:12 AM |
|
Trading bots taking over by the looks of it. Price broke down perfectly to the Weekly long-term resistance to test it as support (yellow line), bulls then pushed price back up to the 50 MA and VPVR point of control. Indecisive candle means price could continue in either direction:  The candle slightly favors the bulls on smaller time-frame given the fake breakdown, as well as the majority of volume coming from buying pressure as opposed to selling:  |
|
|
|
dragonvslinux (OP)
Legendary
Offline
Activity: 1666
Merit: 2204
Crypto Swap Exchange
|
|
June 20, 2020, 11:39:55 PM
Last edit: June 21, 2020, 12:27:02 AM by dragonvslinux |
|
The candle slightly favors the bulls on smaller time-frame given the fake breakdown, as well as the majority of volume coming from buying pressure as opposed to selling: The bullish ascending triangle was well-defended with a second confirmation, this is definitely a bullish sign, but requires more confirmation. I'm expecting more upside now, as long as price can break through the 50 & 200 MA that has been acting as recent resistance. While this could be a bull trap on this time-frame, as we've already had a few bear traps, the ascending triangle still has a 70% chance of breaking to the upside. 55-45 bullish for now. Another rejection from the 50 MA would make me slightly bearish again however:  On the Daily time-frame, it isn't looking quite as bullish as the 4hr imo, despite the ascending triangle remaining in tact, as well as the recent trading pattern. The 50 Day MA at $9,397 is now acting as resistance, as previously anticipated. We need to break through quick, ideally overnight or tomorrow, instead of confirming it as new resistance. While the CMF is maintaining momentum, volume is continuing to decline which is a concern, while RSI remains neutral with bearish divergence. Currently 50-50 on this time-frame, but closing back above $9,400 would swiftly return by 55-45 bullish bias, above $9,510 VPVR would return my bias to 60-40:  My previous TA of the Daily remains more-or-less the same: I'm still remaining 55-45 bullish on the Daily time-frame, but closing below the 50 Day MA would put me back on the 50-50 fence, as long as we hold $8,800 macro bull flag / trading range support. The 50 Day MA now sits at $9,387 and is rising indicating bullish momentum, but price needs to maintain this momentum by closing above this MA in order to avoid breaking down further to the $8.8K bull flag support target, or potentially lower to re-test the 200 Day MA around $8,3K (for the first time since the golden cross) if bears follow through with volume: On the Daily chart, we are finding support from the 50 Day MA which is encouraging, but price needs to keep moving higher in the near future to remain above it, otherwise a re-test of the 200 Day MA around $8,300 appears inevitable, if the 50 Day MA flips to resistance overtime. The bearish divergence on the RSI remains in tact, as referenced in the OP, price needs to move higher in order to breach this bearish signal: Regardless, while remaining within an ascending triangle structure on the 4hr, as well as a macro-sized bull flag on the Daily chart, I'll remain 55-45 bullish until proven otherwise. Otherwise waiting for the Weekly candle to close, it's the weekend so there is only more noise to come. |
|
|
|
exstasie
Legendary
Offline
Activity: 1806
Merit: 1521
|
|
June 21, 2020, 12:04:48 AM |
|
Otherwise waiting for the Weekly candle to close, it's the weekend so there is only more noise to come.
That's all that big hourly doji was, weekend noise. BTC is waiting for the stock markets to reopen and make their move. The positive correlation is in full effect, there's no denying it:   |
|
|
|
dragonvslinux (OP)
Legendary
Offline
Activity: 1666
Merit: 2204
Crypto Swap Exchange
|
|
June 21, 2020, 12:13:56 PM
Last edit: June 21, 2020, 12:26:04 PM by dragonvslinux |
|
The bullish ascending triangle was well-defended with a second confirmation, this is definitely a bullish sign, but requires more confirmation. I'm expecting more upside now, as long as price can break through the 50 & 200 MA that has been acting as recent resistance. While this could be a bull trap on this time-frame, as we've already had a few bear traps, the ascending triangle still has a 70% chance of breaking to the upside. 55-45 bullish for now. Another rejection from the 50 MA would make me slightly bearish again however: We're getting rejected by the 50 MA yet again as traders continue to sell the re-test after the death cross  A 1-4 candle TD correction to the upside has completed, setting up for up more downside. Looks like price is trying to find support from the bull flag resistance trend-line that we were in, but ultimately this leads to lower lows and re-testing the ascending triangle support for a third time. As previously referenced, despite confirming this triangle trend-line as support, I'm leaning bearish again 55-45 due to the MA resistance overhead, as well as the VPVR POC that price is failing to move back above. A break below the ascending triangle support would increase this to 60-40 or higher: 
On the Daily time-frame, it isn't looking quite as bullish as the 4hr imo, despite the ascending triangle remaining in tact, as well as the recent trading pattern. The 50 Day MA at $9,397 is now acting as resistance, as previously anticipated. We need to break through quick, ideally overnight or tomorrow, instead of confirming it as new resistance. While the CMF is maintaining momentum, volume is continuing to decline which is a concern, while RSI remains neutral with bearish divergence.
On the Daily chart we are struggling to move back above the 50 Day MA, while the bear flag structure targeting $8,850 and strong VPVR support remains in tact. The 100 & 200 Day MA bull cross should act as some support if price fails to hold the macro bull channel price has been trading within for the past 6 weeks:  The bearish divergence on the RSI remains in tact, as referenced in the OP, price needs to move higher in order to breach this bearish signal:
Otherwise waiting for the Weekly candle to close, it's the weekend so there is only more noise to come.
That's all that big hourly doji was, weekend noise. BTC is waiting for the stock markets to reopen and make their move. The positive correlation is in full effect, there's no denying it: You're probably right yes, I was leaning bullish on the bassis of getting back above MA resistance, but alas this did not occur. |
|
|
|
dragonvslinux (OP)
Legendary
Offline
Activity: 1666
Merit: 2204
Crypto Swap Exchange
|
|
June 22, 2020, 10:03:14 AM
Last edit: June 22, 2020, 10:38:13 AM by dragonvslinux |
|
We're getting rejected by the 50 MA yet again as traders continue to sell the re-test after the death cross A 1-4 candle TD correction to the upside has completed, setting up for up more downside. Looks like price is trying to find support from the bull flag resistance trend-line that we were in, but ultimately this leads to lower lows and re-testing the ascending triangle support for a third time. As previously referenced, despite confirming this triangle trend-line as support, I'm leaning bearish again 55-45 due to the MA resistance overhead, as well as the VPVR POC that price is failing to move back above. A break below the ascending triangle support would increase this to 60-40 or higher: We managed to find a weak bounce (declining volume) from the short-term bull channel, but now facing resistance from the 200 MA while trying to hold the VPVR POC. The expected outcome would be a rejection from this resistance, followed by a re-test of the ascending triangle support, Moving above $9,500 would gives the bulls a chance however: 
On the Daily time-frame, we are currently testing the bearish divergence, the anticipated outcome would be this longer-term divergence holding and price moving further down:  We are otherwise testing the 50 Day MA around $9,400, however price really needs to move back above the VPVR POC ($9,500) and mid-level of the bull channel ($9,600) to be given another chance, otherwise this is merely a dead cat bounce before lower lows, continuing to form the bear flag targeting $8,800 as previously referenced:  On the Daily chart we are struggling to move back above the 50 Day MA, while the bear flag structure targeting $8,850 and strong VPVR support remains in tact. The 100 & 200 Day MA bull cross should act as some support if price fails to hold the macro bull channel price has been trading within for the past 6 weeks:
Despite closing the Week with a red candle (-0.47%), the candle itself was an indecisive doji with a slight bullish bias (despite anyone else's opinions on price structure). The low of the wick to the body was +4.23%, while the top of the wick to the candle body was only -2.69%, this gives it a ratio of being around 60% bullish and 40% bearish:  Does this mean price will now definitely move higher? Absolutely not, 60:40 is not good odds. it merely confirms the indecision in the Bitcoin market right now, as opposed to definitively bullish or bearish longer-term outlook. While the 4hr and Daily lean bearish 60-40, they remain in bullish structures (ascending triangle and bull flag), the Weekly remains relatively neutral. The 21 & 50 MAs have started sloping downwards indicating bearish momentum, while the 100 & 200 Week are moving upwards with bullish momentum. Price is however above all of these MAs, 3/4 are in bullish formation (21MA is below the 50MA), while price continues to make higher highs and lower lows on a macro scale. The bearish concerns are the RSI creating a slight bearish divergence from being rejected twice from the bullish conditions >60, while the CMF is gaining selling momentum:  Whether we are finding rejection from the long-term resistance trend-line, or in fact finding support for a third week, remains a matter of opinion and subjectivity.
To all the bears out there based on the Weekly close, learn to read and measure the candle, especially dojis  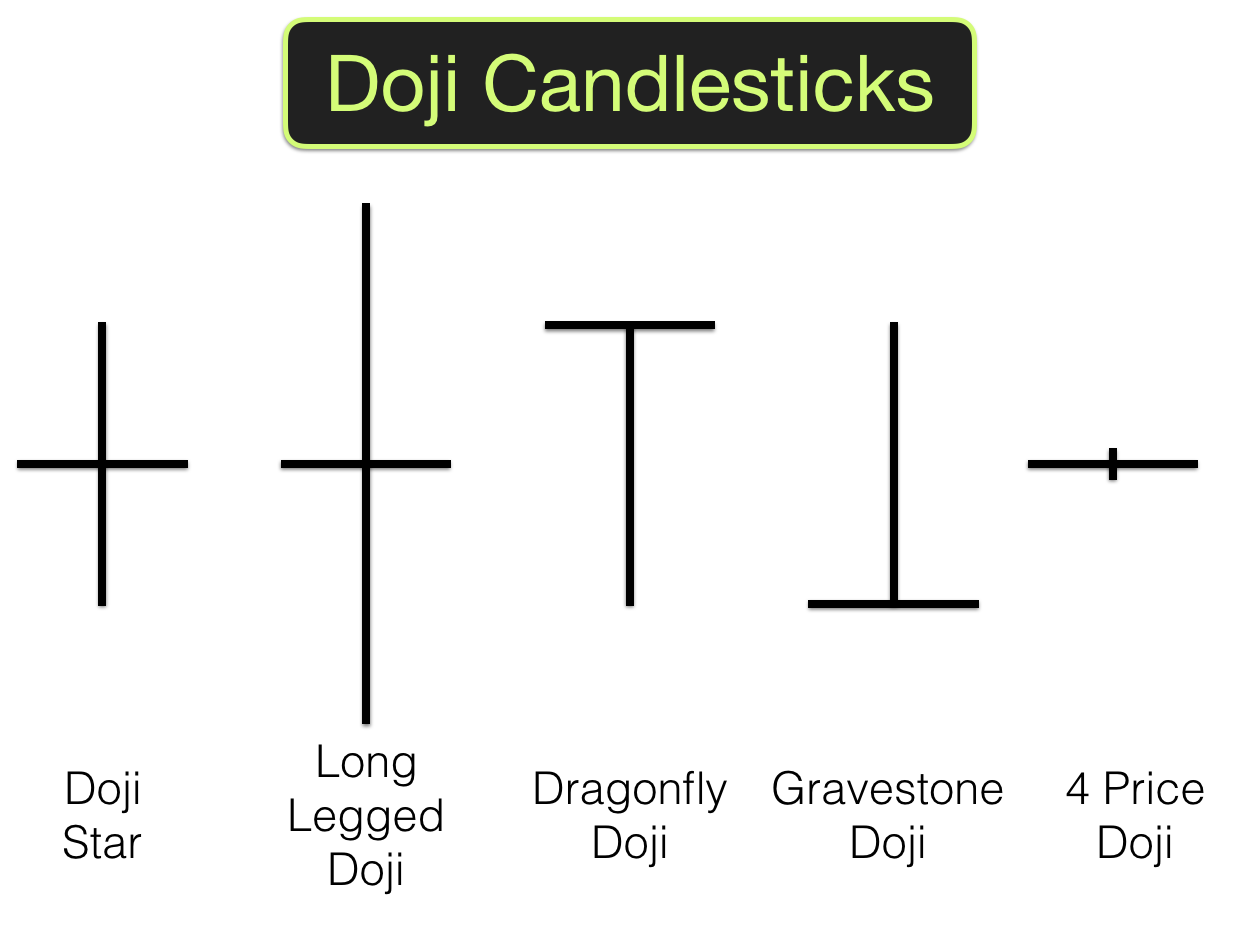 Source: excellenceassured.com Source: excellenceassured.com
What is a Long-Legged Doji?
The candlestick signals indecision about the future direction of the underlying security.
It is used by some traders to warn that indecision is entering the market after a strong advance. It may also warn that a strong downtrend may be experiencing indecision before making a move to the upside.
Long-legged dojis may also mark the start of a consolidation period, where the price forms one or more long-legged dojis before moving into a tighter pattern or breaks out to form a new trend. |
|
|
|
dragonvslinux (OP)
Legendary
Offline
Activity: 1666
Merit: 2204
Crypto Swap Exchange
|
|
June 23, 2020, 12:28:03 AM |
|
The bullish ascending triangle was well-defended with a second confirmation, this is definitely a bullish sign, but requires more confirmation. I'm expecting more upside now, as long as price can break through the 50 & 200 MA that has been acting as recent resistance. We managed to find a weak bounce (declining volume) from the short-term bull channel, but now facing resistance from the 200 MA while trying to hold the VPVR POC. The expected outcome would be a rejection from this resistance, followed by a re-test of the ascending triangle support, Moving above $9,500 would gives the bulls a chance however: Despite anticipating further rejection from the 200 MA on the 4hr, price broke through $9,500 returning the bullish sentiment. A golden cross of the 50 & 200 MA looks imminent in the coming candles, returning the bullish sentiment. I'm now returning to my 60-40 bullish bias and anticipating a move back to $10K resistance, as long as the $9.5-$.9,6K area can be flipped into support: 
On the Daily time-frame, we are currently testing the bearish divergence, the anticipated outcome would be this longer-term divergence holding and price moving further down We just broke the bearish divergence on the RSI with a close on the Daily, negating this bearish sentiment: [img width=10000]https://www.tradingview.com/x/BnBebE7Z/[/img]
We are otherwise testing the 50 Day MA around $9,400, however price really needs to move back above the VPVR POC ($9,500) and mid-level of the bull channel ($9,600) to be given another chance, otherwise this is merely a dead cat bounce before lower lows, continuing to form the bear flag targeting $8,800 as previously referenced Price successfully broke through the $9,600 resistance with an engulfing candle that moved above the previous 10, the mid-level of the bull flag, even closing back above the 21 Day MA as well as the 50. I'm back to 60-40 bullish again. Now expecting a move back up-to $10,500 resistance level, in order to confirm this pattern with a third touch-point: 
Despite closing the Week with a red candle (-0.47%), the candle itself was an indecisive doji with a slight bullish bias (despite anyone else's opinions on price structure). The low of the wick to the body was +4.23%, while the top of the wick to the candle body was only -2.69%, this gives it a ratio of being around 60% bullish and 40% bearish: Base on the TD Sequential, a long trade was activated today on the Weekly chart with a Green 2 moving above a Green 1 at $9,592 after a 1-4 candle correction from the 9 sell signal, despite price being in the middle of the bull flag and ascending triangle pattern on smaller time-frames (that on the Daily chart should remain a no-trade zone): 
|
|
|
|
dragonvslinux (OP)
Legendary
Offline
Activity: 1666
Merit: 2204
Crypto Swap Exchange
|
|
June 24, 2020, 01:58:03 PM |
|
Despite anticipating further rejection from the 200 MA on the 4hr, price broke through $9,500 returning the bullish sentiment. A golden cross of the 50 & 200 MA looks imminent in the coming candles, returning the bullish sentiment. I'm now returning to my 60-40 bullish bias and anticipating a move back to $10K resistance, as long as the $9.5-$.9,6K area can be flipped into support: Price is finding support for the third time in recent days from the ascending triangle support, which appears to be a crucial level to defend on this time-frame. The bulls failed to flip the $9.5-$9.6K level into support, putting a pause on the $10K target for now; hence only being 60-40 bullish (not worth the risk) and now I'm now back to 50-50. Despite anticipating the 50 MA to move above the 200 MA, in order to create a death cross fake-out, this failed to happen and now Bitcoin will need to move back above these MAs to avoid rejection: 
We just broke the bearish divergence on the RSI with a close on the Daily, negating this bearish sentiment:  Yesterday I referenced the bearish RSI divergence being successfully broken. While this is still true, it's worth noting the previous time this divergence was broken but led to a bullish fake-out and lower lows. While this may not be the case this time around, it's worth remaining cautious until price can move back above key resistance: 
Price successfully broke through the $9,600 resistance with an engulfing candle that moved above the previous 10, the mid-level of the bull flag, even closing back above the 21 Day MA as well as the 50. I'm back to 60-40 bullish again. Now expecting a move back up-to $10,500 resistance level, in order to confirm this pattern with a third touch-point: Similar to the 4hr, the Daily chart isn't looking as bullish either now. For reference sake, I've adjusted the bull channel to be drawn from the three touch-points of support (better late than never), as opposed to the two touch-points of resistance - in order for more accuracy. Notably this shows price being rejected from the mid-level, as opposed to closing above it as I had previously considered. The key level remains moving back above the 50 Day MA and VPVR POC (now lowered to $9,,450) to return the bullish sentiment, but until price moves back above the mid-level of the bull channel (now considered to be $9.7K), then the trend remains slightly bearish within a bullish pattern. Back on the 50-50 fence again! 
|
|
|
|
dragonvslinux (OP)
Legendary
Offline
Activity: 1666
Merit: 2204
Crypto Swap Exchange
|
|
June 26, 2020, 05:01:30 PM |
|
Price is finding support for the third time in recent days from the ascending triangle support, which appears to be a crucial level to defend on this time-frame. The bulls failed to flip the $9.5-$9.6K level into support, putting a pause on the $10K target for now; hence only being 60-40 bullish (not worth the risk) and now I'm now back to 50-50. Despite anticipating the 50 MA to move above the 200 MA, in order to create a death cross fake-out, this failed to happen and now Bitcoin will need to move back above these MAs to avoid rejection: Since recent price action, I've re-alligned the ascending triangle to include as many candle bodies and wicks as possible. While some may consider this cheating, this is well within the requirements of an ascending triangle (apart from the $10.4K head fake). Despite creating new candle body closes at lower levels and bearish RSI & CMF, based on the bullish pattern and structure and recent confirmations of support, I'll remain 50-50 until there is further confirmation. If $9K is convincingly broken, then I'll turn bearish. 
Yesterday I referenced the bearish RSI divergence being successfully broken. While this is still true, it's worth noting the previous time this divergence was broken but led to a bullish fake-out and lower lows. While this may not be the case this time around, it's worth remaining cautious until price can move back above key resistance: As referenced recently, the RSI breaking through bearish divergence could be a bull trap, which seems to of transpired as price strength moves lower and closer to the support of the neutral level at 40: 
Similar to the 4hr, the Daily chart isn't looking as bullish either now. For reference sake, I've adjusted the bull channel to be drawn from the three touch-points of support (better late than never), as opposed to the two touch-points of resistance - in order for more accuracy. Notably this shows price being rejected from the mid-level, as opposed to closing above it as I had previously considered. The key level remains moving back above the 50 Day MA and VPVR POC (now lowered to $9,,450) to return the bullish sentiment, but until price moves back above the mid-level of the bull channel (now considered to be $9.7K), then the trend remains slightly bearish within a bullish pattern. Back on the 50-50 fence again! Since shifting this bull channel to include the 15th June wick, price has since twice tested this bull flag support (that now lines up with the ascending triangle, depending on how you want to view things). Bears are starting to struggle to push price lower and out of the channel. I can see an argument for a high risk long-trade, with a good risk/reward ratio, however given the shorter-term MAs beginning to trend downwards, it's not a trade I'd take.  I otherwise moved the resistance trend-line on this chart to include recent candle rejecting the price, from the January 2018 peak of $17K, instead of $20K. My 4hr chart with the ascending triangle (more bullish pattern), shows the resistance trend-line as support. I thought a bit of subjectivity while remaining patient could be useful for me. |
|
|
|
dragonvslinux (OP)
Legendary
Offline
Activity: 1666
Merit: 2204
Crypto Swap Exchange
|
|
June 28, 2020, 04:18:50 PM
Last edit: June 28, 2020, 05:53:16 PM by dragonvslinux |
|
Since recent price action, I've re-alligned the ascending triangle to include as many candle bodies and wicks as possible. While some may consider this cheating, this is well within the requirements of an ascending triangle (apart from the $10.4K head fake). Despite creating new candle body closes at lower levels and bearish RSI & CMF, based on the bullish pattern and structure and recent confirmations of support, I'll remain 50-50 until there is further confirmation. If $9K is convincingly broken, then I'll turn bearish. While $9K was swiftly taken out again, this time by falling out of the ascending triangle structure, it was pretty unconvincing to say the least. The 4hr chart undoubtedly remains bearish with a plethora of resistance overhead; the Weekly resistance trend-line, the 50 & 100 MAs that are all sloping downwards in bearish formation, the VPVR POC around $9,500, as well as the flat looking 200 MA around $9,460. On the upside, price broken out of a short-term bear flag to the upside, suggesting another bear trap. If bears break down and close candles below the ascending triangle again, I'll be 60-40 bearish. For now, I'm leaning beairsh 55-45 unless bulls can prove otherwise. Nothing trade-able on this time-frame without conclusive confirmation, see Daily chart for further reasons why. Others are pointing to a head & shoulders pattern, that would confirm with a break-down from triangle support. Technically it already did confirm, but was unsustainable, only highlighting the danger of shorting into strong support. 
Since shifting this bull channel to include the 15th June wick, price has since twice tested this bull flag support (that now lines up with the ascending triangle, depending on how you want to view things). Bears are starting to struggle to push price lower and out of the channel. I can see an argument for a high risk long-trade, with a good risk/reward ratio, however given the shorter-term MAs beginning to trend downwards, it's not a trade I'd take. Despite the overwhelming bearish sentiment in the markets right now, the Daily isn't looking that bad to me anymore. We remain in the bullish channel with yet another short-term bear trap (RIP shorts) after finding support from the strong volume area and previous lows around $8,800. In case it wasn't obvious, we just made a higher low. The concern structurally is failing to create a new higher high within the bull channel, but instead continuing to test support after failing to move above the mid-line. Bulls really need to move back above the 50 Day MA (that will soon be shedding it's bearish bias of sloping downwards, see trajectory), as well as the obvious mid-level resistance of $9,750. The CMF has more or less maintained it's buying pressure, instead of turning negative to selling pressure, this is additionally a good sign.  As referenced recently, the RSI breaking through bearish divergence could be a bull trap, which seems to of transpired as price strength moves lower and closer to the support of the neutral level at 40: While the bearish divergence remains, we did find RSI support from from the recent "correction". Also bear in mind this was a low (decreasing) volume -1.67% drop, this was not a dump. A dump would be 5-10% on high volume, the recent candle means very little apart from confirming bull channel support and avoiding bearish RSI conditions. I'm therefore leaning 55-45 bullish on the Daily now (in contrast to the slightly bearish 4hr), a move back above the 50 MA would shift this to 60-40, back above $9.75K, easily 70-30 bullish. 
Will otherwise wait until the Weekly close before any TA on this time-frame, given the weekend noise. |
|
|
|
buwaytress
Legendary
Offline
Activity: 2800
Merit: 3447
Join the world-leading crypto sportsbook NOW!
|
|
June 29, 2020, 01:45:27 PM |
|
Just saw your other one on hash ribbons buy signals, so if I were a believer in hash rate extrapolation, I'd definitely be firmly on medium term bullish right now, though I might want to wait for another adjustment before taking a dip.
But I'm not, so I'm like you, leaning towards bearish as I have been in this tight range for weeks, but not unopposed to changing my mind if something spectacular shows up.
So much calm in the markets. Something has to give.
|
|
|
|
dragonvslinux (OP)
Legendary
Offline
Activity: 1666
Merit: 2204
Crypto Swap Exchange
|
|
June 29, 2020, 03:15:49 PM
Last edit: September 10, 2023, 01:41:40 PM by dragonvslinux |
|
Just saw your other one on hash ribbons buy signals, so if I were a believer in hash rate extrapolation, I'd definitely be firmly on medium term bullish right now, though I might want to wait for another adjustment before taking a dip.
But I'm not, so I'm like you, leaning towards bearish as I have been in this tight range for weeks, but not unopposed to changing my mind if something spectacular shows up.
So much calm in the markets. Something has to give.
On shorter time-frames 4hr I'm more bearish, Daily I'm more neutral right now: Inverse Head & Shoulders Fractal - Deadcat to $9.4K?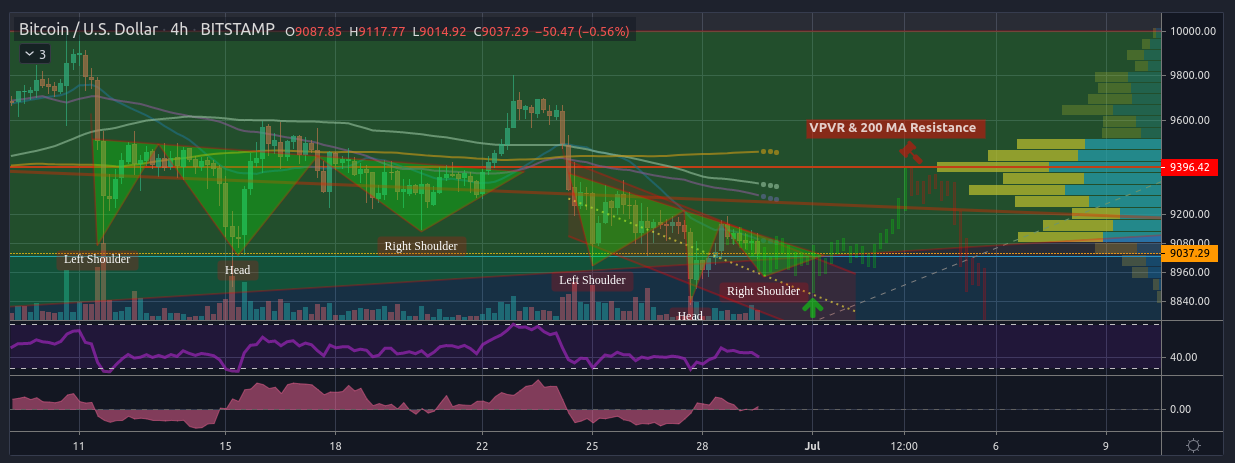 A few possible scenarios A few possible scenarios
On the Weekly I'm arguably still slightly bullish. Pending confirmation to be more bullish: Just saw your other one on hash ribbons buy signals, so if I were a believer in hash rate extrapolation, I'd definitely be firmly on medium term bullish right now, though I might want to wait for another adjustment before taking a dip. Bearish price actions lacks confluence with bullish hash rate imo, hence no buy signal given yet. Could take some time to get it, but more likely to signal than not eventually. On the Daily time-frame at least, this signals has always confirmed after hash rate recovery usually within a few days days. The exceptions to the rule was after the second halving in 2016, which was delayed by around 10 days, as well as 2015, that took 4 weeks to confirm. Most notable all 11 buy signals (blue) have appeared within a month of recovery in hash rate (green), followed by making new hash rate ATH within a short number of days. It's hard not to see the obvious nature of the similarities between these halvings, price aside. To me it therefore seems any dips will be well-defended as the next bullish cycle for Bitcoin will be ready. 2012 - First Halving 2016 - Second Halving 2016 - Second Halving 2020 - Third Halving 2020 - Third Halving |
|
|
|
buwaytress
Legendary
Offline
Activity: 2800
Merit: 3447
Join the world-leading crypto sportsbook NOW!
|
|
June 30, 2020, 08:15:14 AM |
|
On shorter time-frames 4hr I'm more bearish, Daily I'm more neutral right now:
Inverse Head & Shoulders Fractal - Deadcat to $9.4K?
If we can even see 9.4k! Not so much a bounce atm but a lazy attempt to recover lost ground. I think the "wait for Friday" feeling has been consistently keeping traders grounded for much of the past weeks. Bearish price actions lacks confluence with bullish hash rate imo, hence no buy signal given yet. Could take some time to get it, but more likely to signal than not eventually. On the Daily time-frame at least, this signals has always confirmed after hash rate recovery usually within a few days days. The exceptions to the rule was after the second halving in 2016, which was delayed by around 10 days, as well as 2015, that took 4 weeks to confirm.
Most notable all 11 buy signals (blue) have appeared within a month of recovery in hash rate (green), followed by making new hash rate ATH within a short number of days. It's hard not to see the obvious nature of the similarities between these halvings, price aside. To me it therefore seems any dips will be well-defended as the next bullish cycle for Bitcoin will be ready.
Absolutely on hash rate confirmation, every argument I've seen has been pretty convincing not so much for the piling of historic signals, but for the lack of opposing signals. I get that hash rate should be pure economics. You're mining because you can turn a profit. But I know for sure also that miners are at least partially sentiment: they'll switch it on at a loss now if they believe they can turn a profit down the line soon. That miners are also hedging in options (apparently) proves they're playing on sentiment. So I'm also confident your buy signal on this will trigger. |
|
|
|
dragonvslinux (OP)
Legendary
Offline
Activity: 1666
Merit: 2204
Crypto Swap Exchange
|
|
June 30, 2020, 01:11:46 PM
Last edit: June 30, 2020, 02:01:27 PM by dragonvslinux |
|
On shorter time-frames 4hr I'm more bearish, Daily I'm more neutral right now:
Inverse Head & Shoulders Fractal - Deadcat to $9.4K?
If we can even see 9.4k! Not so much a bounce atm but a lazy attempt to recover lost ground. I think the "wait for Friday" feeling has been consistently keeping traders grounded for much of the past weeks. True story, Seeing price getting rejected by the mid-level of the current bear channel and not even get back close to its MAs, is a very bearish sign:  Edit: Edit: However, I'm still not ruling out the potential for another bear trap based on current adjusted/scaled fractal, followed by dead cat bounce to $9.4-9.5K levels: 
Bearish price actions lacks confluence with bullish hash rate imo, hence no buy signal given yet. Could take some time to get it, but more likely to signal than not eventually. On the Daily time-frame at least, this signals has always confirmed after hash rate recovery usually within a few days days. The exceptions to the rule was after the second halving in 2016, which was delayed by around 10 days, as well as 2015, that took 4 weeks to confirm.
Most notable all 11 buy signals (blue) have appeared within a month of recovery in hash rate (green), followed by making new hash rate ATH within a short number of days. It's hard not to see the obvious nature of the similarities between these halvings, price aside. To me it therefore seems any dips will be well-defended as the next bullish cycle for Bitcoin will be ready.
Absolutely on hash rate confirmation, every argument I've seen has been pretty convincing not so much for the piling of historic signals, but for the lack of opposing signals. I get that hash rate should be pure economics. You're mining because you can turn a profit. But I know for sure also that miners are at least partially sentiment: they'll switch it on at a loss now if they believe they can turn a profit down the line soon. That miners are also hedging in options (apparently) proves they're playing on sentiment. So I'm also confident your buy signal on this will trigger. Indeed, it's hard to counter-argue these hash rate based signals, and I'm 91% (11/12) confident the buy signal will trigger again even if it takes a month at a considerably lower price. Many don't like these signals because they feel hash rate follows price, but this seems irrelevant to me. Hash rate could easily be following price and making the decisive moves to either capitulate or making new ATHs. It's easier to identify the correlation between hash & price, rather than explore the "who is following who" rabbit hole. The point is, these sentimental miners affect the price of the market in the longer-term much more than we care to believe. We all know whales control the shorter-term movements, but in the longer run, a healthy growing network leads to long-term investments, a weakening network leads to less confidence. This much should be obvious and clear imo. I'm not sure miners are as sentimental as they used to be though, if they switch off at a loss and switch on for a profit, then this seems purely economical to me (emotions removed). The sentimental strategy would be to stay on at a loss, on the basis of personally investing into Bitcoin at "good prices", even though each coin would cost you more than the actual price. To me it seems like in the past, particularly around the second halving, miners were a lot more sentimental (hence weren't capitulating as much as they should have been) because of the "bigger picture". But in reality they could of just invested mining profits into Bitcoin at market price, rather than mining it for a premium lol. Miners are getting smarter, consistent and more reliable in this sense, from my perspective. |
|
|
|
dragonvslinux (OP)
Legendary
Offline
Activity: 1666
Merit: 2204
Crypto Swap Exchange
|
|
July 01, 2020, 02:13:33 PM
Last edit: September 10, 2023, 01:41:02 PM by dragonvslinux |
|
Finding a bounce from a symmetrical triangle break-out that targets the $9,400 level, possibly even $9,500. This now has potential to develop into an interesting bull trap:  To provide a clearer picture, the bearish pattern is the month-long bear channel we have been stuck in, therefore re-testing the resistance of this downtrend around $9,500 seems reasonable before moving lower. The low volume signals a lack of confidence from the bulls buying at lower levels, even as price moves above the mid-level of the channel: 
As previously referenced, expecting price to find rejection from overhead resistance on this time-frame: This is no time to be shorting in my opinion, am still eyeing up a move to $9.4K - $9.5K on the 4hr based on the current fractal in play before heavy rejection and the shorts piling up at this level. On a brighter note, the long-term bearish divergence of the RSI appears to be breaking on the Daily time-frame while bouncing off the neutral level of 40:  Price is overwise attempting to form a v-shaped recovery that would confirm with a close above $9,350. Meanwhile, the 50 Day MA at $9,425 could be difficult enough to close above, as well as the VPVR point of control around $9.5K. Hence the strong possibility of a bull trap incoming on both the 4hr and Daily time-frames: 
Longer-term, it's difficult not to remain slightly bullish right now: |
|
|
|
buwaytress
Legendary
Offline
Activity: 2800
Merit: 3447
Join the world-leading crypto sportsbook NOW!
|
|
July 01, 2020, 04:47:38 PM |
|
I'm not sure miners are as sentimental as they used to be though, if they switch off at a loss and switch on for a profit, then this seems purely economical to me (emotions removed). The sentimental strategy would be to stay on at a loss, on the basis of personally investing into Bitcoin at "good prices", even though each coin would cost you more than the actual price. To me it seems like in the past, particularly around the second halving, miners were a lot more sentimental (hence weren't capitulating as much as they should have been) because of the "bigger picture". But in reality they could of just invested mining profits into Bitcoin at market price, rather than mining it for a premium lol.
Miners are getting smarter, consistent and more reliable in this sense, from my perspective.
I have to say I don't know about miners beyond the small-time near-hobbyists I've spoken to as well. It was interest (and a healthy dose of intent to profit) that got them started but the fact they're sticking on despite not really making more than to keep themselves afloat suggests to me they're willing to stick it in for a while more. Perhaps the sentiment is different in Asia though, where they perhaps aren't feeling fatigued and they feel like they're gaining experience that will be useful for a coming boom (mainly as they have yet to experience one). These all entered post 2017 boom the ones I know. It's a really insignificant sample I do realise but either case, rational miners or not, for the now timeframe, yeah, what they're doing now is a buying signal waiting to trigger. |
|
|
|
dragonvslinux (OP)
Legendary
Offline
Activity: 1666
Merit: 2204
Crypto Swap Exchange
|
|
July 03, 2020, 11:08:49 AM
Last edit: September 10, 2023, 01:40:40 PM by dragonvslinux Merited by El duderino_ (2) |
|
This is no time to be shorting in my opinion, am still eyeing up a move to $9.4K - $9.5K on the 4hr based on the current fractal in play before heavy rejection and the shorts piling up at this level. Based on the original TA published a few days ago, price appears to be following a very similar fractal to last month inverse head & shoulders, therefore I'm continuing to expect a dead cat bounce to $9.4-$9.5K  If there's already been bear traps, and it looks like another bear trap, it's probably a bear trap. Followed by a nasty bull trap: 
On a brighter note, the long-term bearish divergence of the RSI appears to be breaking on the Daily time-frame while bouncing off the neutral level of 40: Price is overwise attempting to form a v-shaped recovery that would confirm with a close above $9,350. Price recently failed to close above $9,350, instead only reaching $9.3K before being pushed back down by the bears. Looking from the triangle perspective on the Daily line chart - that fits better than a 4hr ascending triangle imo - price is still within a higher lows structure, hence expecting a re-test of the mid-level and vpvr poc of this triangle. Despite failing to re-test the resistance level of $10K of the triangle recently (the question mark), the price has none the less now tested 3 times support and 3 times resistance, giving an even balance of opportunities to breakup or breakdown - it's looking like an open playing field for either the bulls or the bears. Breaking above the mid-level of the triangle (as well as bull flag around $9.8K) would give the bulls the advantage in the short-term. The bearish divergence on the RSI is beginning to curve off within the neutral zone pointing towards more potential for it to be broken (compared to when it was linear). CMF remains high, indicating that buying pressure remains strong despite the recent sell off. Bulls need to make move before it's too late, bears need to be patient and see where the price goes next. Volume continues to decrease, increasing the likelihood of increased volatility once a breakout occurs (to the upside or downside):  [/quote]
Longer-term, it's difficult not to remain slightly bullish right now: |
|
|
|
dragonvslinux (OP)
Legendary
Offline
Activity: 1666
Merit: 2204
Crypto Swap Exchange
|
|
July 04, 2020, 03:24:15 PM
Last edit: July 04, 2020, 03:39:12 PM by dragonvslinux |
|
A quick update, will give more indepth Daily/Weekly overview another time. Weekly close coming later today, this TA is of weekend noise. Looking at the Hourly chart for a change, price has formed a distinct descending triangle in the past couple of days. Although shorter-term time-frame triangles are less reliable, as well as the target merely being a 1% drop to the downside if confirmed, the concern would be again re-testing sub $9K levels but this time failing to move higher again. Price is continuing to hold the ascending triangle structure, but now failing to bounce back up from this strong support level. Instead it appears to be weakening as price begins to grind along it:  While previously expecting a dead cat bounce to $9.4K, even $9.5K, price instead recently returned to $9.3K (the 0.5 fib retracement from recent highs) but failed to move higher, it therefore appears that the bounce back was weaker than expected (failed to reach the 0.618 "expected" retracement), showing strong bearish pressure on smaller time-frames:  Price strength on the 4hr chart needs to hold the 40 RSI level (currently around $9,050) to avoid turning bearish and negating bullish divergence on the 4hr chart:  Regardless, until a breakdown is confirmed, price remains "more or less" within a similar inverse head & shoulders fractal with RSI double bottom and bullish divergence:  A break of $9.3K neckline would open the doors for a bull trap to $9.4K - $9.5K. |
|
|
|
dragonvslinux (OP)
Legendary
Offline
Activity: 1666
Merit: 2204
Crypto Swap Exchange
|
|
July 05, 2020, 11:06:29 AM |
|
A quick update, will give more indepth Daily/Weekly overview another time. Weekly close coming later today, this TA is of weekend noise. Looking at the Hourly chart for a change, price has formed a distinct descending triangle in the past couple of days. Although shorter-term time-frame triangles are less reliable, as well as the target merely being a 1% drop to the downside if confirmed, the concern would be again re-testing sub $9K levels but this time failing to move higher again. Price strength on the 4hr chart needs to hold the 40 RSI level (currently around $9,050) to avoid turning bearish and negating bullish divergence on the 4hr chart: Price has again broken below $9K, confirming the bearish descending triangle pattern as well as failing to hold the ascending triangle support while struggling to remain within neutral RSI levels, instead flirting bearish again. This is no time to be going long, recent price action shows it was the time to be getting out of short-term long positions:
Based on the TD Sequential, the Red 2 candle moving below the Red 1 candle (at $9,040) would be the entry for the short-trade. The risk/reward is 3:1, targeting the lows of the bear channel around $8,760 for -3.1% (which is also previous swing lows where a bounce would be likely) with a stop loss at the highs of the Red 1 candle (+1% at $9,130):  While a slightly risky trade, shorting into nearby support, the risk reward is there for leverage traders it seems as price additionally gets rejected by the mid-level of the bear channel, also confirming a short-term trend change. However, based on categorizing current price action as "Weekly noise", it wouldn't be a trade I'd be interested in:  DYOR |
|
|
|
dragonvslinux (OP)
Legendary
Offline
Activity: 1666
Merit: 2204
Crypto Swap Exchange
|
|
July 06, 2020, 11:26:49 AM
Last edit: July 06, 2020, 11:40:18 AM by dragonvslinux |
|
Yesterday I referenced a risky Sunday trade on the 4hr chart, while price did drop 1.5% from $9,040 to $8,905 in the right direction, it didn't reach the target of $8,760. At best this would of been a small gain or loss to those shorting the market, if they had already moved a stop loss to break-even after the dragonfly doji on the hourly chart. This is why I referenced the risk of shorting into support, as well as Sunday's price action often acting as weekend noise before the Weekly close. RIP shorts. Based on the TD Sequential, the Red 2 candle moving below the Red 1 candle (at $9,040) would be the entry for the short-trade. The risk/reward is 3:1, targeting the lows of the bear channel around $8,760 for -3.1% (which is also previous swing lows where a bounce would be likely) with a stop loss at the highs of the Red 1 candle (+1% at $9,130): While a slightly risky trade, shorting into nearby support, the risk reward is there for leverage traders it seems as price additionally gets rejected by the mid-level of the bear channel, also confirming a short-term trend change. However, based on categorizing current price action as "Weekly noise", it wouldn't be a trade I'd be interested in: Despite a slightly stronger bounce from $9K this time than most recently, I'm still remaining cautious with a bearish bias, merely putting the dead cat bounce to $9.4-9.5K back on the table. Price is still within a month-long bear channel, the expected retracement from the recent $9.8K top to recent lows would be the 0.618 fib at $9,419. The 200 MA is now sloping downwards indicating a bearish trend on this time-frame currently at $9,386. The resistance trend-line of the bear channel is in-between these two resistance levels: 
On the Daily chart, we maintained the higher low after finding support from threatening to break out of the ascending triangle structure (that remains the same as previously drawn). The 21 & 50 MA are sloping downwards indicating bearish pressure, currently at $9,250 and $9,389 respectively, hence strong resistance overhead. If price manages to move above these MAs, the VPVR POC lies at $9.5K that would be the final hurdle: 
The Weekly candle came to a close as a neutral doji, indicating indecision in the market (unsurprisingly). This weeks candle is now on a Red 3 indicating that the short trade on this time-frame would be a move below $8,933. Similar to how last week the Red 2 moving below the Red 1 candle at $8,859 would of activated a short trade based on the TD Sequential. However this didn't occur last week, and there remains a good chance that this week price won't fall below $8,933 either, and that the past 4 Red weekly candles are part of a 1-4 candle correction within a healthy "bullish" correction, as opposed to a longer-term trend change. Only time will tell.  If this week the Red 3 candle does move below the Red 2, then this could however be a very profitable trade, due to the tight stop loss of $9,300 (the high of the Red 2 candle) with a 4:1 risk reward ratio to the 100 Week MA. Even conservatively waiting for the lows of the Red 1 candle ($8,859) to be broken would be a 3.3:1 risk/ward:  For reference sake, it's "suggested" to trade Red 2's moving below Red 1's, and Red 3's below Red 2's, but not 4-9 candles - these are the candles to ride the trade up to the 9, as opposed to opening positions on. Hence, if price stays above last weeks low, by next week there would no longer be a bearish trend-change trade based on the sequential being on a Red 4 (or Green 1 possibly). This is only one indicator, but given price did top out on a 9 candle, I find the Weekly sequential count very relevant right now (more than usual). |
|
|
|
dragonvslinux (OP)
Legendary
Offline
Activity: 1666
Merit: 2204
Crypto Swap Exchange
|
|
July 07, 2020, 02:07:24 PM |
|
Despite a slightly stronger bounce from $9K this time than most recently, I'm still remaining cautious with a bearish bias, merely putting the dead cat bounce to $9.4-9.5K back on the table. Price is still within a month-long bear channel, the expected retracement from the recent $9.8K top to recent lows would be the 0.618 fib at $9,419. The 200 MA is now sloping downwards indicating a bearish trend on this time-frame currently at $9,386. The resistance trend-line of the bear channel is in-between these two resistance levels: As expected, $9,400 remains strong resistance with the confluence of the downwards sloping 200 MA, the bear channel resistance trend-line as well as the 0.618 fib retracement:  Based on longer-term bull vs shorter-term bear channel, and failure of price moving back to the resistance trend-line of the bull channel (instead being rejected by the mid-level), I'm inclined to expect price to now move to the support trend-line of the bear channel, based on recent confirmation of the resistance trend-line. Note that yesterdays bounce was weaker than the previous time we tested the resistance trend-line (June 22nd) with less volume. This isn't a positive sign what so ever: 
On the Daily chart, we maintained the higher low after finding support from threatening to break out of the ascending triangle structure (that remains the same as previously drawn). The 21 & 50 MA are sloping downwards indicating bearish pressure, currently at $9,250 and $9,389 respectively, hence strong resistance overhead. If price manages to move above these MAs, the VPVR POC lies at $9.5K that would be the final hurdle: The alternative to the bull vs bear channel perspective is the longer-term ascending triangle (bullish) vs shorter-term descending triangle (bearish). While the descending triangle has confirmed with a minimum of three touch-points of support & resistance, it's also clear that from candle body closes this represents more of a bearish channel as opposed to triangle structure and it's measured move target of around -13% to $7,750. None the less, I'm leaning bearish as price gets rejected from the downwards trending 50 Day MA (second red hammer in quoted screenshot), awaiting to see the outcome of the "yellow triangle", the remaining overlap of the bullish vs bearish triangles. Another break below the support trend-line of the ascending triangle would suggest the shorter-term descending triangle is a stronger pattern that points to lower lows:  |
|
|
|
dragonvslinux (OP)
Legendary
Offline
Activity: 1666
Merit: 2204
Crypto Swap Exchange
|
|
July 07, 2020, 03:46:18 PM |
|
A quick "bullish amendment" to previous TA, "arguably" we are holding the neckline an the inverse head & shoulders that has a measured move (head to neck +5.3%) target to $9,740:  However, based on this short-term bullish pattern being trapped within the longer-term bear channel / descending triangle pattern, as well as being a sloppy h&s with a double right shoulder, I'm not inclined to see the relevance unless $9,400 is convincingly broken. More relevantly, a break below $9,250 would invalidate this head & shoulders pattern, which I find the most likely outcome as someone who's not a fan of h&s patterns - bull/bear channels & ascending/descending triangles are more reliable patterns imo. |
|
|
|
exstasie
Legendary
Offline
Activity: 1806
Merit: 1521
|
|
July 07, 2020, 11:57:20 PM |
|
I'm not too focused on intraday chart patterns in this tight of a market. We need a clean breakout. Yesterday's daily bullish engulfing was a good start. Solid range expansion, good volume.
But honestly, it's hard to focus on the technicals at all when BTC is just following stocks and then trolling when the markets are closed. If the S&P 500 breaches the June low, I expect BTC to follow with a structural breakdown. If the S&P 500 breaches the June high, there's a decent chance BTC will follow but it's a tossup. BTC stayed in range when stocks rallied in late May.
|
|
|
|
dragonvslinux (OP)
Legendary
Offline
Activity: 1666
Merit: 2204
Crypto Swap Exchange
|
|
July 16, 2020, 01:42:04 AM |
|
I'm not too focused on intraday chart patterns in this tight of a market. We need a clean breakout. Yesterday's daily bullish engulfing was a good start. Solid range expansion, good volume. Valid point, the intra-day was becoming less and less relevant as volatility continued to reduce. I was hoping to find a clue in there somewhere, but apart from the dead cat bounce to $9.4-9.5K, it's not saying much else apart from the obvious bearish signals. But honestly, it's hard to focus on the technicals at all when BTC is just following stocks and then trolling when the markets are closed. If the S&P 500 breaches the June low, I expect BTC to follow with a structural breakdown. If the S&P 500 breaches the June high, there's a decent chance BTC will follow but it's a tossup. BTC stayed in range when stocks rallied in late May.
The first day breaking correlation maybe, or just a day off? Thought I'd leave this chart I just noticed, BTCEUR for a change. Perfect descending triangle currently in play, in contrast to the symmetrical looking triangle of the BTCUSD. Usually I wouldn't care about the Euro chart, but given the issues with the Dollar Printer , I think it's this is an interesting subtle pattern. Target would be 7,150 (currently $8,165), which is also "middle of nowhere" BTC territory; low volume support, no Weekly MA support. Note the purple circled candle that created no local volume support:  In contrast, BTCUSD has a much stranger pattern. Ultimately, a symmetrical triangle towards the end, but with higher lows support trend-line in tact for 2 months now. BTCEUR doesn't have this support, in fact it broke it some-time ago. The red flag within the VPVR histogram is the warning sign of low volume:  Same story on BTCGBP unsuprinsgly. Strong risk/reward ratio in play if you're willing to trade the triangle prior to the break-out. Target would be £6535 (approx $8.210):  I think it's fair to assume a break below $8.6K support could easily lead to a swift move to $8K (-13% from current price), which isn't a level I believe will hold as strong support either. |
|
|
|
dragonvslinux (OP)
Legendary
Offline
Activity: 1666
Merit: 2204
Crypto Swap Exchange
|
|
July 16, 2020, 03:08:06 PM
Last edit: July 16, 2020, 03:24:41 PM by dragonvslinux |
|
Thought I'd leave this chart I just noticed, BTCEUR for a change. Perfect descending triangle currently in play, in contrast to the symmetrical looking triangle of the BTCUSD. Usually I wouldn't care about the Euro chart, but given the issues with the Dollar Printer , I think it's this is an interesting subtle pattern. Target would be 7,150 (currently $8,165), which is also "middle of nowhere" BTC territory; low volume support, no Weekly MA support. Note the purple circled candle that created no local volume support: This type of price movement is exactly what I was worried about yesterday, in order to confirm a bearish trend change  Another re-test of triangle resistance (at best) then a move downwards is my 70% assumption, in order to re-test ascending support trend-line and flip it to resistance:  On the BTCEUR chart, a close below horizontal support 8.046 ($9,197) could confirm a breakdown from the descending triangle, although the horizontal support trend-line could arguably be moved lower to 7.950 ($9,090) with less touch-points (and therefore less accuracy). A close below the 100 Day MA (£8,013/$9,170) that's -3.2% lower than BTCUSD's (at $8,871) - would be particularly bearish imo:  The bullish "hopium" Relative Strength Index (RSI) view needs to hold current price levels of $9,100, to maintain a sort of bullish curve back towards >60 bullish territory. Current remains in the neutral zone:  The Chaikin Money Flow (CMF) is the only bullish sign right now, buying pressure is remaining positive, but a break below 0.1 could signal moving or re-testing the negative zone:  The Weekly CMF on the other hand has been negative (indicating stronger selling pressure) for 2 months now, since the bear channel, but with slight bullish divergence:  On the other hand, the RSI on the Weekly chart is showing some bearish divergence:  The Daily is therefore looking unequestionably bearish to me right now, while the Weekly is slightly bearish / neutral given the lack of confluence between RSI & CMF. |
|
|
|
dragonvslinux (OP)
Legendary
Offline
Activity: 1666
Merit: 2204
Crypto Swap Exchange
|
|
July 16, 2020, 04:20:41 PM |
|
This type of price movement is exactly what I was worried about yesterday, in order to confirm a bearish trend change Another re-test of triangle resistance (at best) then a move downwards is my 70% assumption, in order to re-test ascending support trend-line and flip it to resistance: Here's the closer look at the 4hr. TD is on a 9 Buy Signal and likely to bounce from the oversold RSI level of 30, before facing triangle resistance of $9,250-$9,300 where the the 50 & 200 MA resistance lies (bearish formation, both sloping downwards). This is the bull trap scenario I'm now eyeing up, following the $9.4K-$9.5K bull trap that played out:  Price remains bearish until $9,500 is taken out, otherwise looking like a short-term bear trap, followed by another bull trap. Classic stuff. |
|
|
|
dragonvslinux (OP)
Legendary
Offline
Activity: 1666
Merit: 2204
Crypto Swap Exchange
|
|
July 20, 2020, 04:47:14 PM |
|
Here's the closer look at the 4hr. TD is on a 9 Buy Signal and likely to bounce from the oversold RSI level of 30, before facing triangle resistance of $9,250-$9,300 where the the 50 & 200 MA resistance lies (bearish formation, both sloping downwards). This is the bull trap scenario I'm now eyeing up, following the $9.4K-$9.5K bull trap that played out: Price remains bearish until $9,500 is taken out, otherwise looking like a short-term bear trap, followed by another bull trap. Classic stuff. The bounce reached $9,245, $5 short of the resistance level. Price has now consolidated to the end of a long-term upwards trend-line as well as a mid-term resistance trend-line:  |
|
|
|
dragonvslinux (OP)
Legendary
Offline
Activity: 1666
Merit: 2204
Crypto Swap Exchange
|
|
July 21, 2020, 11:50:21 AM
Last edit: September 10, 2023, 01:32:35 PM by dragonvslinux |
|
The bounce reached $9,245, $5 short of the resistance level. Price has now consolidated to the end of a long-term upwards trend-line as well as a mid-term resistance trend-line: Given the lack of return of volume & volitility in previous weeks as previously expected, price is now ready to make a big move in the coming days imo, as opposed to the coming weeks. ...   We got a small breakout of volatility today at the end of the support/resistance apex. Pending an increase in volume, the bulls do appear to have the upper hand right now by closing a candle above the resistance trend-line 200 MA:  *The yellow line represents the Weekly resistance down-trend line that is currently holding back the price on the 4hr chart after wicking to it. *The yellow line represents the Weekly resistance down-trend line that is currently holding back the price on the 4hr chart after wicking to it.The trend-line is also in notable confluence with the 50 Day MA. Bulls will need to close above this level to confirm a short-term trend-change. Rejection from the slightly bearish trend-line MA would likely lead to a re-test of VPVR support & 21 Day MA aorund $9,225. Lowering in the POC with recent volume traded in this area, as well as moving above this level, is however a very positive sign: 
The bullish "hopium" Relative Strength Index (RSI) view needs to hold current price levels of $9,100, to maintain a sort of bullish curve back towards >60 bullish territory. Looks like the bullish hopium wasn't a too strong dose of hope as price strength remains within a u-curve, after avoiding Daily closes below $9,100: 
The trade on the TD Sequential, with the Green 3 moving above the Green 2 candle at $9,223 (especially after a TD 9 Buy signal) gives a 2.7 risk/reward ratio targeting $9,475. The target has already over half been met however. Therefore unless price continues to move higher above $9.5K to target $9.7K-9.8K, it'd be wise to wait for a pull-back and confirmation:  |
|
|
|
dragonvslinux (OP)
Legendary
Offline
Activity: 1666
Merit: 2204
Crypto Swap Exchange
|
|
November 13, 2020, 01:37:23 PM |
|
Long-time no TA here, the market's been in a solid uptrend. Now starting to pay more attention as I tighten stop losses on trading positions (95% is still in HODL mode). Decision time? $15.8-16K re-test or $17.5K moonshot?  Current rejection from the mid-level of this theoretical parallel channel suggests $17.5K likely target if break above dotted line. Either expecting slight pull-back and re-test triangle breakout resistance level to flip to support, or generally continue mooning upwards. |
|
|
|
dragonvslinux (OP)
Legendary
Offline
Activity: 1666
Merit: 2204
Crypto Swap Exchange
|
|
November 14, 2020, 08:49:19 AM |
|
Decision time? $15.8-16K re-test or $17.5K moonshot? Current rejection from the mid-level of this theoretical parallel channel suggests $17.5K likely target if break above dotted line. We got the pull-back to $15.8-$16K (triangle breakout level), as suggested pretty accurately with the red arrow above. Now to move back up towards the mid-level?  I think there's still room to move down to $15.5K strong volume support, that will likely be very well defended. I also don't think the correction needs to go any deeper after very recently making new 3-year highs at $16.5K. The current level is old resistance that will likely become new support before moving higher again. The trend is your friend. |
|
|
|
dragonvslinux (OP)
Legendary
Offline
Activity: 1666
Merit: 2204
Crypto Swap Exchange
|
|
November 15, 2020, 02:51:50 PM |
|
Not much changed since yesterday on smaller time-frames. We didn't get the v-shaped recovery from the support trend-line that I was hoping for, but price is none the less grinding upwards along it. I'm now acknowledging that we are in a bearish ascending wedge, but given the lack of breakdown from support, I'm overlooking the relevance for now. I think there's still room to move down to $15.5K strong volume support, that will likely be very well defended. I also don't think the correction needs to go any deeper after very recently making new 3-year highs at $16.5K. The current level is old resistance that will likely become new support before moving higher again. The trend is your friend. The $15.5K level remains strong support, a break below the yellow line ($15,090) is where I'd turn slightly bearish on smaller time-frames. A sideways breakout from the ascending wedge could prove to be bullish, if volume point of control is moved up from $15.5 to $15.8-$16K, while the 200 MA that remains untested at $15,670.  The bearish factors are currently the bearish divergence on the 4hr chart, which would need to be broken to continue the uptrend. This can also easily be broken with bullish follow through from turning old triangle resistance into support, and moving back towards the mid-level of the parallel channel.  The Daily chart also signals bearish divergence (higher high in price with a lower low in RSI), but also remains in overbought territory, so far from bearish either.  On the Weekly time-frame, the RSI is facing resistance at 80. This was the key level from 2019 that price strength was unable to move above. A break and close >80 on the RSI would further confirm the long-term bullish uptrend, similar to the price strength seen in 2016-2017.  Weekly chart still in a clear uptrend regardless of a potential pull-back to strong support levels: The Fibonacci projection from March low to July break-out looks to be pointing to a pull-back to 1.618 at $14K or otherwise continuation to the 2.618 at $20K. Also to note the current logarithmic growth band we are facing resistance ("third lowest") was also the same resistance as late 2018, support & resistance in early 2019, as well as 2020 to some degree.  |
|
|
|
dragonvslinux (OP)
Legendary
Offline
Activity: 1666
Merit: 2204
Crypto Swap Exchange
|
|
November 16, 2020, 12:45:39 PM |
|
The $15.5K level remains strong support, a break below the yellow line ($15,090) is where I'd turn slightly bearish on smaller time-frames. A sideways breakout from the ascending wedge could prove to be bullish, if volume point of control is moved up from $15.5 to $15.8-$16K, while the 200 MA that remains untested at $15,670. Price looks a bit better today. The $16K level eventually acted as support. I've re-drawn the parallel channel that still has enough touch-points on support, while moving the resistance trend-line to previous tops. Current short-term target would therefore be $17K, as opposed to $17.5K as previously estimated.  The only concern is the VPVR point of control remaining at $15.5K that may need re-testing, otherwise wouldn't be surprised to see more volume build up in the $15.8-16K (old triangle resistance) that has since acted as short-term support as expected, the yellow circle. This would also coincide with bouncing from the 50 MA on the 4hr that hasn't been re-tested for sometime (apart from when we came very close on the 7th November). Either way, price remains short-term and long-term bullish. |
|
|
|
dragonvslinux (OP)
Legendary
Offline
Activity: 1666
Merit: 2204
Crypto Swap Exchange
|
|
November 17, 2020, 08:12:04 AM |
|
Price looks a bit better today. The $16K level eventually acted as support. I've re-drawn the parallel channel that still has enough touch-points on support, while moving the resistance trend-line to previous tops. Current short-term target would therefore be $17K, as opposed to $17.5K as previously estimated. Price unsurprisingly broke to the upside yesterday, despite the bearish divergence on smaller time-frames, as the $16K level was flipped into support. On the 4hr chart we are currently flirting with a TD 9 Sell signal, although currently a Red 1 candle. This could indicate a short-term pull-back (1-4 candles) to the support trend-line around $16.2K.  I've therefore reluctantly* moved my stop loss up to $15.7, below the recent lows. Breaking below the new support (old triangle resistance) imo would likely yield a further pull-back that remains overdue, even if price remains very bullish. Price also remains within the bearish ascending triangle structure, despite still rising on good volume. *Previously I had my stop around $15.1K, below the VPVR point of control. The stop loss is only 5% of my holdings, most of my trading account, 95% will remain as hodl. |
|
|
|
dragonvslinux (OP)
Legendary
Offline
Activity: 1666
Merit: 2204
Crypto Swap Exchange
|
|
November 17, 2020, 01:06:30 PM |
|
Price looks a bit better today. The $16K level eventually acted as support. I've re-drawn the parallel channel that still has enough touch-points on support, while moving the resistance trend-line to previous tops. Current short-term target would therefore be $17K, as opposed to $17.5K as previously estimated.
$17K target reached ✔️ Price has closed on the 4hr above the ascending wedge, which is incredibly bullish. Therefore the measured move target would be +8% to $18,250   |
|
|
|
dragonvslinux (OP)
Legendary
Offline
Activity: 1666
Merit: 2204
Crypto Swap Exchange
|
|
November 17, 2020, 09:52:24 PM |
|
Just a fair warning, 4hr bearish divergence currently remains in tact. Price needs to close above $17,700 in order to break it:  On micro time-frames (10 minute) it does seem like a short pull-back is more than possible, at least to the breakout level of the parallel channe:  Time to buy the dip soon? Coinbase Pro is currently offline |
|
|
|
dragonvslinux (OP)
Legendary
Offline
Activity: 1666
Merit: 2204
Crypto Swap Exchange
|
|
November 18, 2020, 08:51:32 AM |
|
$17K target reached ✔️ Price has closed on the 4hr above the ascending wedge, which is incredibly bullish. Therefore the measured move target would be +8% to $18,250 $18.25 target reached ✔️ Stop loss currently moved upto $16,575, again 10% below the price (to avoid getting wicked out on a 7% 1 hr candle).  The RSI on the Weekly chart is now is "full blown" bull run level >80, more or less confirming the parabolic nature of the recent run up:  We could still see $20K or higher, but don't be surprised to a healthy pull-back to $12-14K / $14-16K, before the next leg up. |
|
|
|
|
noormcs5
|
|
November 18, 2020, 02:27:00 PM |
|
We could still see $20K or higher, but don't be surprised to a healthy pull-back to $12-14K / $14-16K, before the next leg up.
It will take again a lot of time to reach ATH if we move back to 14$ levels again from here. Seeing the momentum, i think that bitcoin will make another ATH and then we might see a pull back near 21000$. In between we may see 300-500$ correction which isn't much deal with the pace we are going up. |
| ..Stake.com.. | | | ▄████████████████████████████████████▄
██ ▄▄▄▄▄▄▄▄▄▄ ▄▄▄▄▄▄▄▄▄▄ ██ ▄████▄
██ ▀▀▀▀▀▀▀▀▀▀ ██████████ ▀▀▀▀▀▀▀▀▀▀ ██ ██████
██ ██████████ ██ ██ ██████████ ██ ▀██▀
██ ██ ██ ██████ ██ ██ ██ ██ ██
██ ██████ ██ █████ ███ ██████ ██ ████▄ ██
██ █████ ███ ████ ████ █████ ███ ████████
██ ████ ████ ██████████ ████ ████ ████▀
██ ██████████ ▄▄▄▄▄▄▄▄▄▄ ██████████ ██
██ ▀▀▀▀▀▀▀▀▀▀ ██
▀█████████▀ ▄████████████▄ ▀█████████▀
▄▄▄▄▄▄▄▄▄▄▄▄███ ██ ██ ███▄▄▄▄▄▄▄▄▄▄▄▄
██████████████████████████████████████████ | | | | | | ▄▀▀▀▀▀▀▀▀▀▀▀▀▀▀▀▀▀▀▄
█ ▄▀▄ █▀▀█▀▄▄
█ █▀█ █ ▐ ▐▌
█ ▄██▄ █ ▌ █
█ ▄██████▄ █ ▌ ▐▌
█ ██████████ █ ▐ █
█ ▐██████████▌ █ ▐ ▐▌
█ ▀▀██████▀▀ █ ▌ █
█ ▄▄▄██▄▄▄ █ ▌▐▌
█ █▐ █
█ █▐▐▌
█ █▐█
▀▄▄▄▄▄▄▄▄▄▄▄▄▄▄▄▄▄▄▀█ | | | | | | ▄▄█████████▄▄
▄██▀▀▀▀█████▀▀▀▀██▄
▄█▀ ▐█▌ ▀█▄
██ ▐█▌ ██
████▄ ▄█████▄ ▄████
████████▄███████████▄████████
███▀ █████████████ ▀███
██ ███████████ ██
▀█▄ █████████ ▄█▀
▀█▄ ▄██▀▀▀▀▀▀▀██▄ ▄▄▄█▀
▀███████ ███████▀
▀█████▄ ▄█████▀
▀▀▀███▄▄▄███▀▀▀ | | | ..PLAY NOW.. |
|
|
|
dragonvslinux (OP)
Legendary
Offline
Activity: 1666
Merit: 2204
Crypto Swap Exchange
|
|
November 19, 2020, 12:17:20 PM |
|
I'm currently looking at a short-term pull-back before price moves higher, if bulls fails to hold the mid-level of the parallel channel price has formed:  This would be to around the support level, somewhere between $16.6-17K (depending on when this happens time-wise). If price fails to hold this relatively parabolic support trend-line that has been established, I'd be expecting a pull-back to around $14-15K in the longer-term. This would be approximately 15-25%, so not completely unreasonable imo. Yesterday's Daily canndle was otherwise a "long legged" doji candle, indicating indecision in the market, while today's candle is also looking similar:  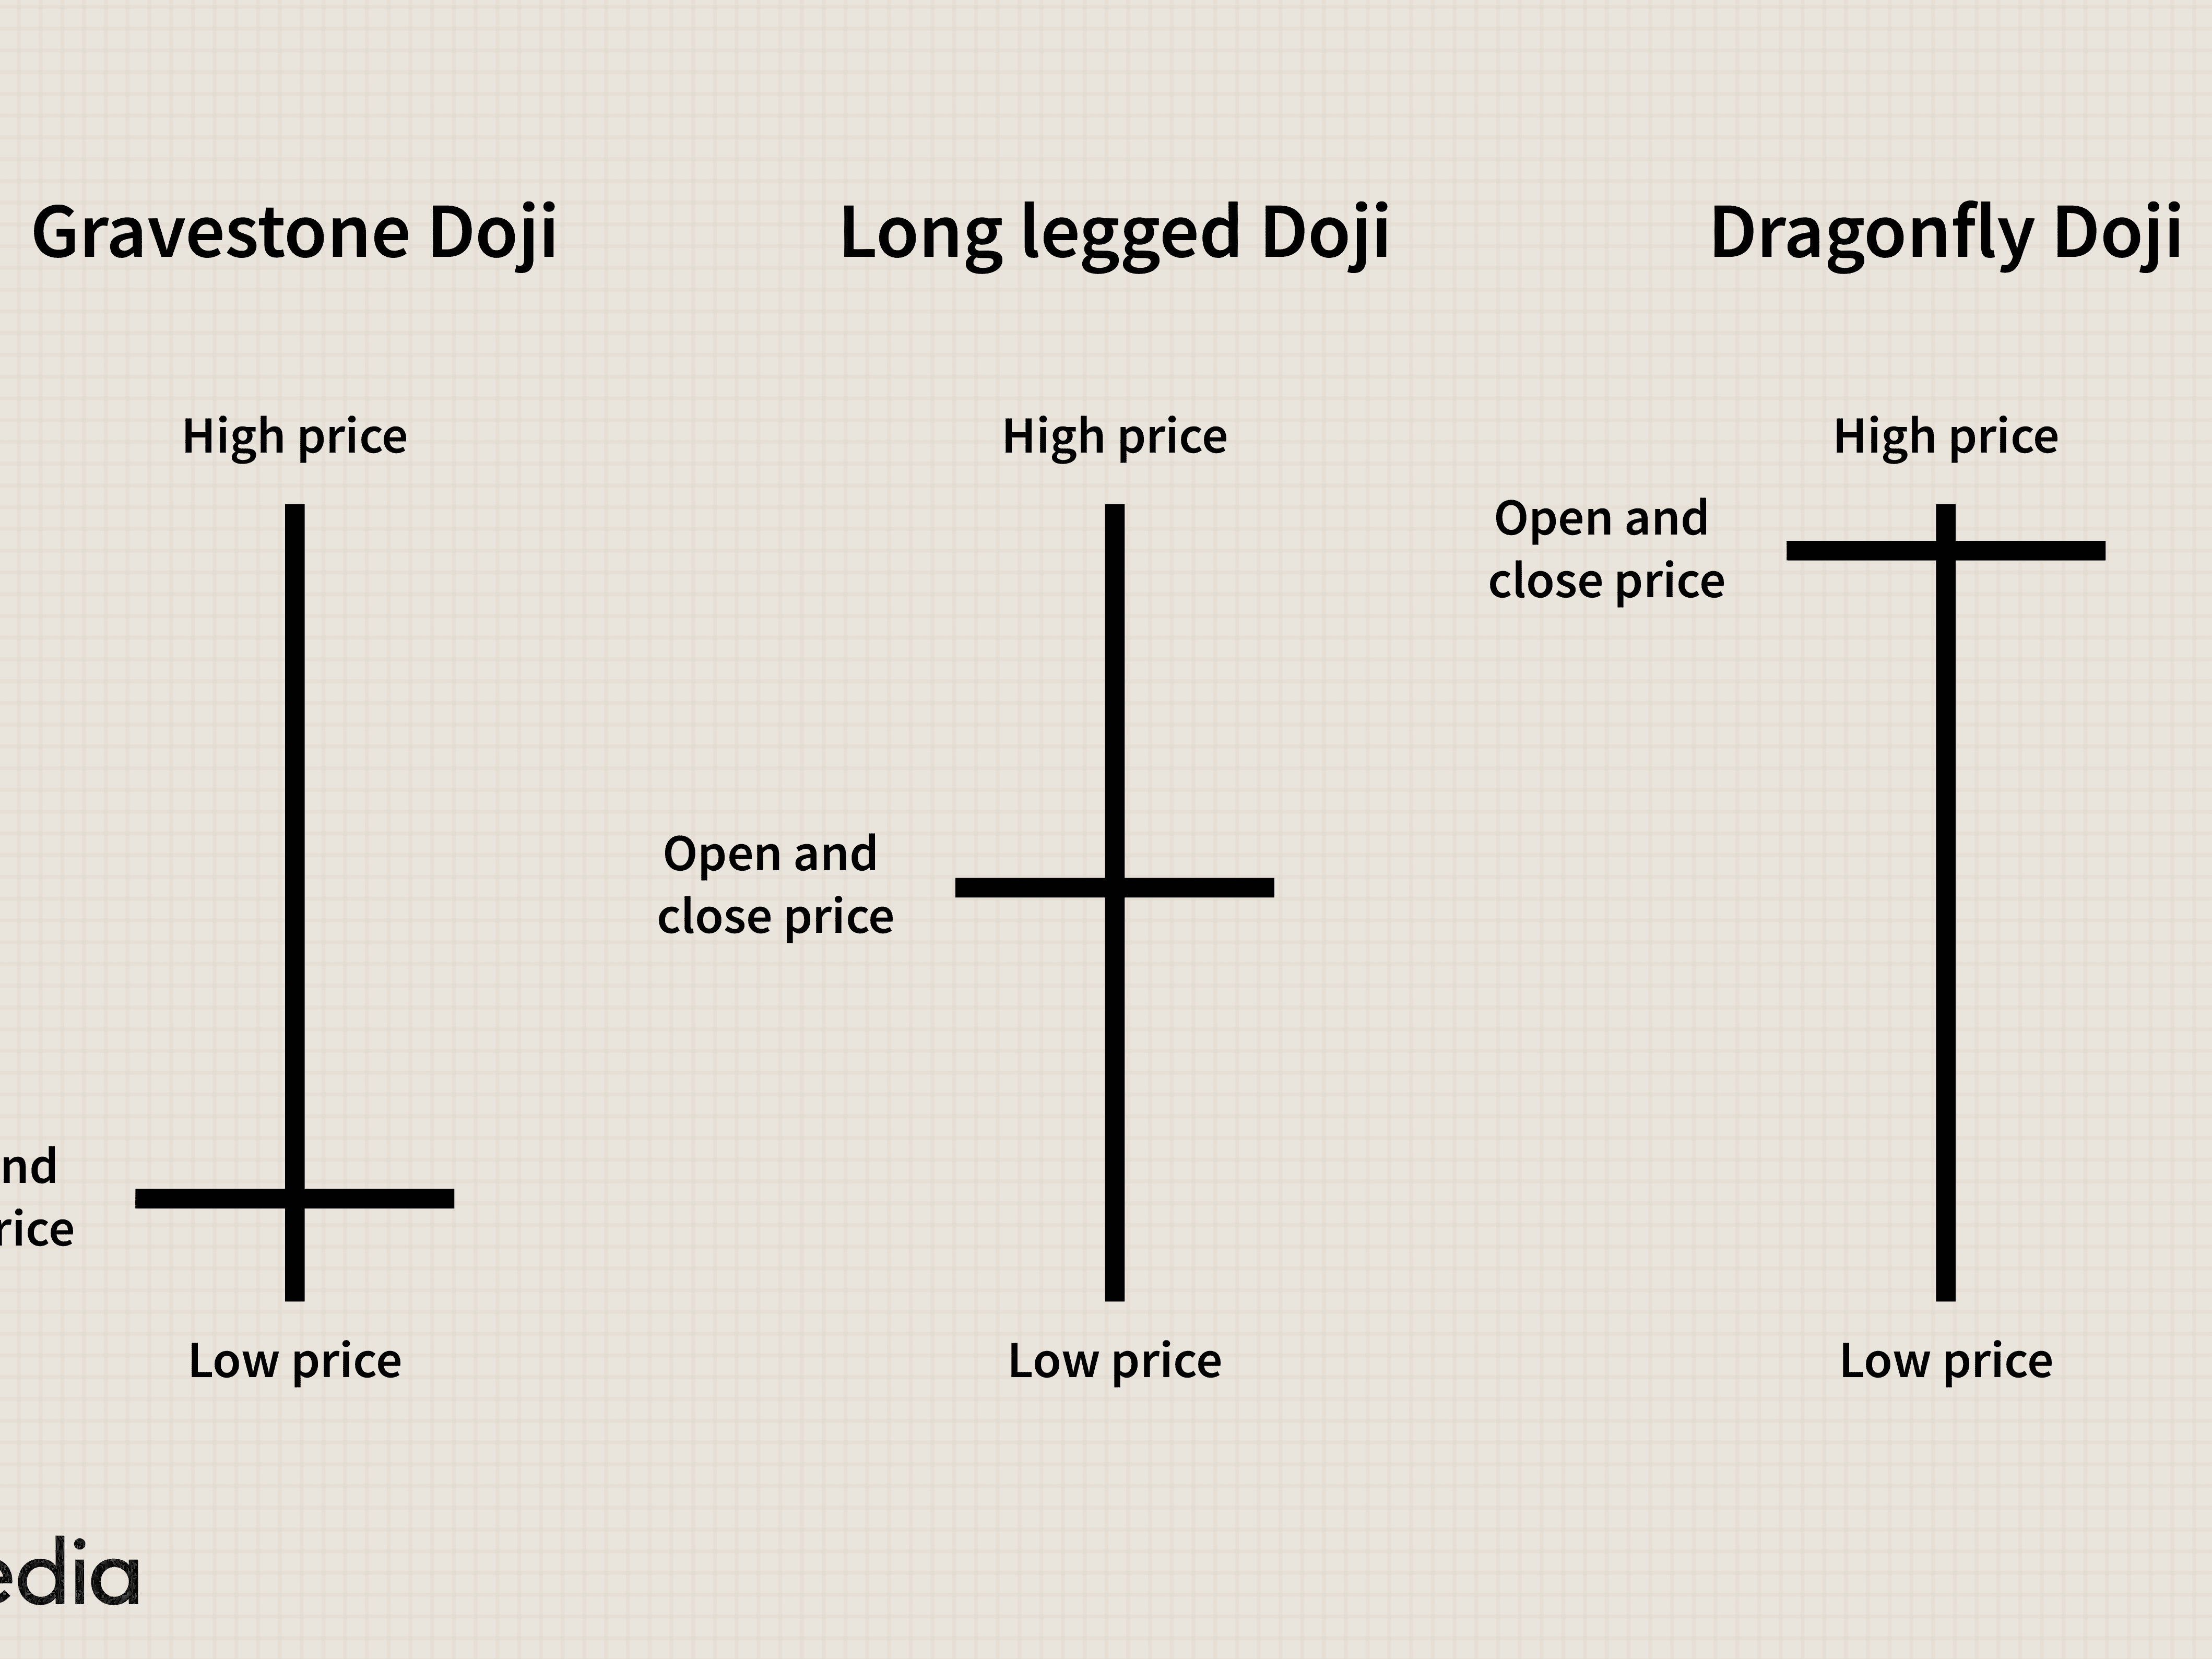 |
|
|
|
dragonvslinux (OP)
Legendary
Offline
Activity: 1666
Merit: 2204
Crypto Swap Exchange
|
|
November 19, 2020, 01:58:55 PM |
|
I'm currently looking at a short-term pull-back before price moves higher, if bulls fails to hold the mid-level of the parallel channel price has formed: For now bulls appear to be defending the mid-level, confirming the bullish momentum is still in tact. Bulls needs to break through the parallel channel in order to avoid a double top scenario, but so far so good. Three wicks have come down to test the mid-level (yellow dotted line), which indicates strong dip buying mentality is still in play.  |
|
|
|
dragonvslinux (OP)
Legendary
Offline
Activity: 1666
Merit: 2204
Crypto Swap Exchange
|
|
November 20, 2020, 03:22:33 PM |
|
For now bulls appear to be defending the mid-level, confirming the bullish momentum is still in tact. Bulls needs to break through the parallel channel in order to avoid a double top scenario, but so far so good. Three wicks have come down to test the mid-level (yellow dotted line), which indicates strong dip buying mentality is still in play. On the 1hr time-frame, we managed to break-out of the bull flag / consolidation pattern making at new high above $18.7K. Obviously, this is still very bullish.  On the 4hr, price is currently testing the near complete parallel channel (re-drawn for accuracy). With three touch-points on support, price will need to avoid rejection at current level to confirm a third resistance touch-point. The mid-level currently remains relevant but imperfect, but staying within this channel (currently around $16.6K), price will however remain bullish.  Everything else says bullish, until proven otherwise. The only real exception is the Hash Ribbons indicator, but this can be overlooked as the miner "capitulation" that begun at the end of October didn't follow suit with a correction or consolidation of price, as has been the case in previous corrections in hash rate.  Instead price has rallied $5K (+37%) since October 30th when miners notably started to switch off. |
|
|
|
dragonvslinux (OP)
Legendary
Offline
Activity: 1666
Merit: 2204
Crypto Swap Exchange
|
|
November 21, 2020, 08:25:00 PM
Last edit: November 21, 2020, 08:39:34 PM by dragonvslinux |
|
On the 4hr, price is currently testing the near complete parallel channel (re-drawn for accuracy). With three touch-points on support, price will need to avoid rejection at current level to confirm a third resistance touch-point.Don't think I'm the first to say it, but Bitcoin is starting to look top-heavy on smaller time-frames again. On the 4hr, price has been rejected by the resistance trend-line of the current bull flag structure. While price remains bullish long-term, a return to re-test the mid-level around $17.9K, or the support trend-line around $17K is far from out the question.  We have again confirmed bearish divergence on the RSI, with a higher high but a lower low in price strength. While price has repeatedly broken these bearish indicators, it none the less does suggest price may correct lower before moving higher again. Personally, this is the first moment where a correction seems likely due to BTC dominance reversing.  On the 1hr, we have been nicely trading upwards in a bull flag pattern that targeted a breakout of the larger bull flag. Unfortunately, we now appear to be breaking down from it.  Looks like it's time for Bitcoin to correct or consolidate, as investors already begin to diversify into the altcoin market. Bitcoin dominance appears to be topping out on a TD Sequanital 9 Sell Signal on the Weekly chart, while being rejected by the volume point of control. In long-term bear markets (that dominance is currently in, based on it's bearish 200 Week MA), this is the expected outcome from the recent dead-cat bounce from <60% to 67%. This Weeks candle screams doji reversal to me:  I'm planning to move my stop loss upto $17.2K, now that price has moved 10% higher than current SL at $16,570, however I'm holding back. I'm waiting for the 50 MA on the 4hr to move above this new support level, as well as the support trend-line to move above this, to avoid selling at support. Probably this will be by next week, when the TD will also be on a 9 Sell Signal. Back in June at $10K, we saw price consolidate for 6 weeks after a TD 9 Sell prior to moving higher, I wouldn't be surprised to see the same consolidation again.  Finally, if June 2016 RSI is anything to compare current overbought conditions with, then we could be looking at a deeper correction upto 40% and 6 months before making new highs:  Be prepared. |
|
|
|
dragonvslinux (OP)
Legendary
Offline
Activity: 1666
Merit: 2204
Crypto Swap Exchange
|
|
November 22, 2020, 12:05:03 PM |
|
Don't think I'm the first to say it, but Bitcoin is starting to look top-heavy on smaller time-frames again. On the 4hr, price has been rejected by the resistance trend-line of the current bull flag structure. While price remains bullish long-term, a return to re-test the mid-level around $17.9K, or the support trend-line around $17K is far from out the question.On the 1hr, we have been nicely trading upwards in a bull flag pattern that targeted a breakout of the larger bull flag. Unfortunately, we now appear to be breaking down from it. Quick update for the day on the 1hr, price broke down from the short-term bull-flag as anticipated. Price is finding some buyers at the local VPVR point of control, but otherwise has now closed below the mid-level of the bull channel signalling short-term weakness. Next level of support is in the $17K range; the 200 MA, 0.786 fib retracement and support trend-line:  |
|
|
|
dragonvslinux (OP)
Legendary
Offline
Activity: 1666
Merit: 2204
Crypto Swap Exchange
|
|
November 24, 2020, 07:13:58 PM |
|
Price obviously didn't come back down to re-test parallel channel, which now more or less invalidates the pattern minus the resistance trend-line target overhead. Instead there is yet another support trend-line as price goes further parabolic towards all time highs... Quick update for the day on the 1hr, price broke down from the short-term bull-flag as anticipated. Price is finding some buyers at the local VPVR point of control, but otherwise has now closed below the mid-level of the bull channel signalling short-term weakness. Next level of support is in the $17K range; the 200 MA, 0.786 fib retracement and support trend-line: My stop loss has therefore now been moved up to $17.57K, with the intention to move this to $18K probably tomorrow or after a test of $20K. I'm still under the impression a 25-35% correction will occur, after a dump exceeds 10% below local top, which is why I've been moving the sell order higher over the weeks instead of taking trading profits already.  Zooming out to the bigger picture on the same 4hr time-frame and using the MA Ribbon, it now seems extremely likely that a break below the ribbon will lead to the larger anticipated correction. Whether this happens from current prices, $20K or nearer $25K remains to be seen, but hence moving my stop loss higher. Since $10K levels, price only ever wicked a % or two below the MA Ribbon all the way up to the new $19.4K high. I'll therefore now be using this indicator to move my stop loss higher, but leaving a bit of room for price to wick below the ribbon, find support, and continue moving higher, as has been the case for over 6 weeks now.  On the Weekly time-frame, we are on the TD Seqential 9 Sell Signal, but whether this will reverse the price remains to be seen. Also to note there is still another 5 days to go before the end of the Week. Price could therefore break through $20K before 1-4 weeks of downside, or otherwise reverse at any moment, hence this week I plan to move my stop loss to $18K in case a reversal wick occurs on the Weekly candle, that would confirm the sell signal. The 2.618 fib target at $20.4K remains close.  The trend is your friend, until it becomes your enemy  |
|
|
|
dragonvslinux (OP)
Legendary
Offline
Activity: 1666
Merit: 2204
Crypto Swap Exchange
|
|
November 25, 2020, 07:58:50 PM |
|
Stop loss now moved up to just under $18K. I'm very much still under the impression that if price breaks below the MA ribbon on the 4hr, price will fall considerably lower. My stop loss has therefore now been moved up to $17.57K, with the intention to move this to $18K probably tomorrow or after a test of $20K. I'm still under the impression a 25-35% correction will occur, after a dump exceeds 10% below local top, which is why I've been moving the sell order higher over the weeks instead of taking trading profits already. Likewise, if $20K is now tested, given the lack of strong selling pressure at the $19K levels, there's a good chance price can break through and move much higher. Either way, a bigger move is coming imo. The parrelel channel morphed into a bearish rising wedge pattern, that has a greater chance of breaking to the downside than the upside in reality.  I'm also not taking the TD 9 Sell Signal on the Weekly time-frame lightly, it seems likely that this week or next price is going to move in a big way. Eventually, this will be to the downside.  Price has more of less been oversold in the Daily time-frame for over a month since $12K levels were broken. To say price is merely overbought, is an understatement.  We are otherwise at clear RSI resistance levels >85, which price strength continues to struggle with unsurprisingly. There could be another push upwards, but it lead inevitably lead to bigger push back down eventually. Be fearful when others are greedy. The time to be greedy, was back when everyone was back in March when everyone was fearful.  It won't be long now until some whales start taking profits, in order to buy back into a tasty dip. |
|
|
|
dragonvslinux (OP)
Legendary
Offline
Activity: 1666
Merit: 2204
Crypto Swap Exchange
|
|
November 26, 2020, 07:28:55 AM |
|
Nearly all the following I referenced in my previous post (almost more relevant now than yesterday), but I'll analysis exactly what's happening now my stop has been triggered... Stop loss now moved up to just under $18K. I'm very much still under the impression that if price breaks below the MA ribbon on the 4hr, price will fall considerably lower. Big moves. Price finally broken down from $19.5K, somewhat as anticipated in yesterdays post. One target from the ascending wedge break-down is around $16.8K, while price has so far reached the low $17.1K. Price is other tentatively at a support tend-line of sorts (old resistance), but with another bearish indicators claiming otherwise:  Based on the 4hr MA Ribbon, the parabolic structure has been broken. While there is support below, it forces me to call the local top at $19.5K for now:  The 4hr RSI also confirms this trend break, with the price strength now closing in <40 bearish territory for the first time since early October:  As previous warned, price has been overbought on the Daily time-frame for around a month. The good news is, laddering into the dip is now looking possible:  As also referenced, the Weekly RSI was at critical 85 overbought, exactly where price corrected from in late 2016, prior to breaking ATH:  The TD 9 Sell Signal is now starting to look like a sell signal, with currently the first red candle after many weeks of upside:  While I'm satisfied with my $18K exit, I wouldn't be surprised to see price re-test $18.6K before moving lower towards a minimum of $16K (-18% from local top). This is where the volume point of control lies, as well as around the 21 & 500 MAs on the 4hr chart, that are now starting to slope downwards in bearish fashion.  TL:DR: TL:DR: I'm not expecting this to be the dip bought up like previous times, but instead a dead cat bounce back to resisitance before lower levels. |
|
|
|
dragonvslinux (OP)
Legendary
Offline
Activity: 1666
Merit: 2204
Crypto Swap Exchange
|
|
November 26, 2020, 08:58:24 AM |
|
Stop loss now moved up to just under $18K. I'm very much still under the impression that if price breaks below the MA ribbon on the 4hr, price will fall considerably lower. I always like a clean exit on trading positions Price is moving faster than expected, therefore now eyeing up the $15.5-16K levels (-18-20%) as support, now price is capitulating. This is the current localish VPVR point of control, 200 MA on the 4hr, as well as 0.619 fib retracement from the $10K break-out to $19.5K high.  It's time to start buying the dip again, but without trying to catch the falling knife at $18K or $17K... |
|
|
|
exstasie
Legendary
Offline
Activity: 1806
Merit: 1521
|
|
November 26, 2020, 10:29:38 AM |
|
Price is moving faster than expected, therefore now eyeing up the $15.5-16K levels (-18-20%) as support, now price is capitulating. This is the current localish VPVR point of control, 200 MA on the 4hr, as well as 0.619 fib retracement from the $10K break-out to $19.5K high.
It's time to start buying the dip again, but without trying to catch the falling knife at $18K or $17K...
Shucks, only 18-20%?! And here I thought we might be having a real Bitcoin correction! The dump looks possibly impulsive to me. I think we can push deeper than that, possibly getting the 30-40% dip I've been concerned about. As long as price is failing to recover and hold above the $18K area, I'm inclined to think distribution will continue. If bulls can however hold above that horizontal resistance and the 0.618 level, I would reassess. |
|
|
|
dragonvslinux (OP)
Legendary
Offline
Activity: 1666
Merit: 2204
Crypto Swap Exchange
|
|
November 27, 2020, 06:12:14 AM |
|
Price is moving faster than expected, therefore now eyeing up the $15.5-16K levels (-18-20%) as support, now price is capitulating. This is the current localish VPVR point of control, 200 MA on the 4hr, as well as 0.619 0.618 fib retracement from the $10K break-out to $19.5K high. Not too much to analysis yet, price appears to trading within a distinct volume gap between $16.5-17.5K. Resistance sits between $17.5-18K now, while trading below the 100 MA isn't doing us any favors either. A break of this range will likely determine the future direction, of which I think will be down to strong $15.5K support. We unsurprisingly got a bounce from oversold territory on the 4hr RSI, which is what you'd expect when price remains oversold on the Weekly time-frame.  Then when we zoom out to the Daily, we see we are actually a long way from strong support. While $12K (-38%) would clearly be well defended it price ever got there, I'm generally looking at a retracement to somewhere between $13-14K (-28-33%), even if anything below $16K (-18%) is worth accumulating imo. If the 21 Day MA doesn't hold, next up would be the 0.5 fib retracement and 50 Day MA around $15K (-23%), which would stand a chance of supporting the price.  Like the Daily, the Weekly remains incredibly bullish, the only issue is being so far from strong support. The Weekly candle is looking indecisive, but after so much upside in recent weeks, looks to be defining a reversal if price closes at current prices or lower. We'd need to get back above $18.5K by the end of the week to turn this around.  I've otherwise been dumping bags into Ethereum and will continue to do so, as it has already had a 35% correction and remains at a 25% discount. Bitcoin has fallen 17% and remains at a 12% discount, not Black Friday material yet.
Price is moving faster than expected, therefore now eyeing up the $15.5-16K levels (-18-20%) as support, now price is capitulating. This is the current localish VPVR point of control, 200 MA on the 4hr, as well as 0.619 fib retracement from the $10K break-out to $19.5K high.
It's time to start buying the dip again, but without trying to catch the falling knife at $18K or $17K...
Shucks, only 18-20%?! And here I thought we might be having a real Bitcoin correction! The dump looks possibly impulsive to me. I think we can push deeper than that, possibly getting the 30-40% dip I've been concerned about. As long as price is failing to recover and hold above the $18K area, I'm inclined to think distribution will continue. If bulls can however hold above that horizontal resistance and the 0.618 level, I would reassess. I'm coming round to the idea of this more so indeed. The end of week will likely confirm this to me. Bye bye new all time high in 2020 most likely. |
|
|
|
dragonvslinux (OP)
Legendary
Offline
Activity: 1666
Merit: 2204
Crypto Swap Exchange
|
|
November 29, 2020, 08:48:27 PM |
|
Not too much to analysis yet, price appears to trading within a distinct volume gap between $16.5-17.5K. Resistance sits between $17.5-18K now, while trading below the 100 MA isn't doing us any favors either. A break of this range will likely determine the future direction, of which I think will be down to strong $15.5K support. We unsurprisingly got a bounce from oversold territory on the 4hr RSI, which is what you'd expect when price remains oversold on the Weekly time-frame. I had assumed we'd find more resistance on the way back up, but it now seems we are moving above this and bouncing from the 50 MA. A very promising sign.  On the Daily chart, price found support three days in a row from the 21 Day MA, further defining the bullish uptrend.  Despite the Weekly chart signalling a reversal, price has been bought up creating a bullish wick, as well as bouncing from the 0.786 retracement from March lows to November highs.  It all looks very bullish, it's hard to deny. I'm still expecting a deeper correction, but if price continues to break resistance levels, it won't arrive yet. |
|
|
|
dragonvslinux (OP)
Legendary
Offline
Activity: 1666
Merit: 2204
Crypto Swap Exchange
|
|
November 30, 2020, 09:26:19 AM |
|
I had assumed we'd find more resistance on the way back up, but it now seems we are moving above this and bouncing from the 50 MA. A very promising sign. Price broke through the local resistance level with ease. On the 1hr time-frame, we might be looking for a short-term pull-back to $18K support and 50 MA. Otherwise, probably going to be another moonshot towards $20K. No regrets selling 3.5% at $18K, I still think price will eventually go lower in the long-term even if we get to $25K.  On the 4hr, we are building up more volume at higher levels, which would eventually move the point of control to around $18.6K. Ideally, this would be with price above it, in order not to get rejected by the POC once it has shifted. Other than $18K on the 1hr, $17.8K on the 4hr is now looking likely as a support zone (21/100 MA projection zone too).  |
|
|
|
dragonvslinux (OP)
Legendary
Offline
Activity: 1666
Merit: 2204
Crypto Swap Exchange
|
|
December 01, 2020, 12:26:59 PM |
|
On the 4hr, we are building up more volume at higher levels, which would eventually move the point of control to around $18.6K. Ideally, this would be with price above it, in order not to get rejected by the POC once it has shifted. Other than $18K on the 1hr, $17.8K on the 4hr is now looking likely as a support zone (21/100 MA projection zone too). Price on Coinbase finally made an ATH today, $19,915, $25 above previous all time high, after Bitstamp achieving a new ATH yesterday. This is however the second time on the 4hr chart that price has been rejected by new ATH levels, so it may take longer to consolidate current highs. Strong support remains between $17.8-18.2K. Above this support zone, price remains bullish.  The Monthly candle close yesterday was otherwise the highest Monthly close Bitcoin has ever had. While I'm still expecting a pull-back to $14K levels, the long-term picture remains incredibly bullish  While on the Weekly, price is at the highest closing Weekly candle in Bitcoin's history. Yet another sign of the strong bullish momentum in the market right now:  |
|
|
|
dragonvslinux (OP)
Legendary
Offline
Activity: 1666
Merit: 2204
Crypto Swap Exchange
|
|
December 02, 2020, 12:15:05 AM |
|
This is however the second time on the 4hr chart that price has been rejected by new ATH levels, so it may take longer to consolidate current highs. Strong support remains between $17.8-18.2K. Above this support zone, price remains bullish. A quick look now the Daily candle has come to close, the rejection earlier today on the 4hr took price down to support. Now we are looking to re-test this support. If prices breaks back below the $17.9K level, I'd expect it to return to previous lows before a bounce, or falling lower as a consequence of confirming a "double top" and ATH rejection.  The Daily chart now becomes the concern, based on the aggressive bearish divergence on the RSI (price strength). After a month of price being overbought, we have now confirmed a rejection from returning to overbought levels. While price remains is bullish territory, a break below 55 could see a re-test of bearish price strength:  From a price perspective, it looks quite clear that we need to hold the 21 Day MA that currently sits at the base of support. Below this, it's a long way down to reality.  Price this week had the highest monthly & daily close ever - this is amazing. Price is also up 2x in the past 6 weeks - it's incredible. It's also long overdue for a deep correction. |
|
|
|
dragonvslinux (OP)
Legendary
Offline
Activity: 1666
Merit: 2204
Crypto Swap Exchange
|
|
December 03, 2020, 11:24:34 AM |
|
A quick look now the Daily candle has come to close, the rejection earlier today on the 4hr took price down to support. Now we are looking to re-test this support. If prices breaks back below the $17.9K level, I'd expect it to return to previous lows before a bounce, or falling lower as a consequence of confirming a "double top" and ATH rejection. Price held the $18K support level, for now establishing a bullish higher low, while now re-testing local resistance. The trend remains bullish with old resistance now confirmed as support.  The Daily RSI that remains my main bearish concern, price strength is now testing the bearish divergence that formed over the past few days:  The bearish divergence looks like it can easily be broken, due to the steep angle of divergence, but while price re-tests resistance levels a rejection here could be the confirmation. |
|
|
|
dragonvslinux (OP)
Legendary
Offline
Activity: 1666
Merit: 2204
Crypto Swap Exchange
|
|
December 05, 2020, 10:05:37 AM |
|
To reference what I posted in another thread... 4th times the charm maybe? As long as price keeps making higher lows then the resistance will break eventually... even if $19.5-$20K looks like strong resistance.  There's 50 & 100 MA bullish cross over support around $18.4K, that could be the quick wick to a higher low There's 50 & 100 MA bullish cross over support around $18.4K, that could be the quick wick to a higher low before finally breaking through the resistance area. Yesterday I suspected that the 50 & 100 MAs would act as local support from the 3rd rejection at resistance, with price wicking down $20 from the 50 MA to $18.5K. This means we created another higher low from the VPVR point of control, a bullish sign. On the 4hr chart, price is otherwise beginning to form a bearish descending triangle, with a breakdown target of $17.4K if the $18.5K level is broken. A rejection today from $19.3K area would confirm the pattern (yellow question mark), even if not confirm the target unless the breakdown occurs.  The bearish divergence on the Daily time-frame looks more or less confirmed now with 3 touch-points at the resistance trend-line, even if a bit too aggressive to be maintained. Recent price action hasn't affected this, with price effectively continuing to weaken since the $19.5K top on November 24th.  While price otherwise remains fully bullish on the Daily time-frame, despite the weakness of strength, the 21 Day MA around $18.25K will need to be held to continue to parabolic uptrend that has been maintained for almost two-months now. Otherwise, the 50 Day MA is currently at $15.75K, where the next cluster of volume support lies:  |
|
|
|
dragonvslinux (OP)
Legendary
Offline
Activity: 1666
Merit: 2204
Crypto Swap Exchange
|
|
December 08, 2020, 10:44:33 AM |
|
On the 4hr chart, price is otherwise beginning to form a bearish descending triangle, with a breakdown target of $17.4K if the $18.5K level is broken. A rejection today from $19.3K area would confirm the pattern (yellow question mark), even if not confirm the target unless the breakdown occurs. Not much to analyse today as we continue to move sideways. The descending triangle I was concerned about a few days ago appears to be taking shape. Others consider this a bullish symmetrical triangle (continuation) however based on the strong resistance overhead as well as now breaking below the 50 MA, I consider it short-term bearish.  With a slightly different angled triangle for more accuracy, the target would be around $17.5K to the 200 MA that doesn't seem out the question before finding another bounce. |
|
|
|
dragonvslinux (OP)
Legendary
Offline
Activity: 1666
Merit: 2204
Crypto Swap Exchange
|
|
December 15, 2020, 01:10:10 PM |
|
Not much to analyse today as we continue to move sideways. The descending triangle I was concerned about a few days ago appears to be taking shape. Others consider this a bullish symmetrical triangle (continuation) however based on the strong resistance overhead as well as now breaking below the 50 MA, I consider it short-term bearish. With a slightly different angled triangle for more accuracy, the target would be around $17.5K to the 200 MA that doesn't seem out the question before finding another bounce. 1 week no update. As a re-cap we had the breakdown from the descending triangle to $80 short of the measured move target ($17,580). Price now re-testing resistance after establishing a new support trend-line. A rejection would likely see a re-test of $18K strong support level, a break above would see new ATH.  The Daily RSI bearish divergence was broken yesterday, now we are testing the bullish territory of 60, similar to in June & September. It's possible price faces further rejection at this level, while at strong resistance, and takes longer to consolidate. As was the case previously when bullish divergence was broken and bullish territory was re-tested.  Price otherwise remains in a bullish ascending triangle structure with the resistance level between $19.5-$20K. |
|
|
|
|


