dragonvslinux (OP)
Legendary

 Offline Offline
Activity: 1666
Merit: 2204
Crypto Swap Exchange

|
 |
June 14, 2020, 12:20:15 PM
Last edit: June 21, 2020, 12:31:08 PM by dragonvslinux |
|
While the community appears very split between bullish and bearish bias', as some analysts remain neutral, here's an in depth overview as to why this might be the case.
Indicators used: Moving averages (MAs), Volume Profile Volume Range (VPVR), TI Indicator (TD Sequential), Chaikin Money Flow (CMF) and Relative Strength Index (RSI).
See (TL:DR) overview near the bottom of this post for summary.
Daily chart - 60/40 bullish bias with ascending triangle pattern  Bulls are currently finding support from the 50 Day MA (after the golden cross of the 50 & 200 Day MA), the 50 MA being the first re-test of bullish support. Price found support from a bullish ascending triange formation, that statistically speaking has a 70% of breaking to the upside with a measured move to somewhere between $11.8-12.3K. The RSI remains neutral, the CMF is currently positive and maintaining momentum. Price has corrected with a 1-4 candle correction on the TD, as expected within bull markets, while sitting just below the VPVR (volume) point of control of $9468. See also alternative perspective of bull flag structure further down that remains relevant to the bullish bias perspective.
Weekly chart - 55-45 bearish bias with TD sell signal and Red 1 candle (unconfirmed)  The larger picture is more subjective, with many factors that come down to bullish or bearish perspectives. Firstly, the TD Sequential signalling a TD 9 Sell signal, however based on the previous two times this was signaled, price continued to move higher (April & June 2019). The difference this time is this weeks candle is threatening to close as a Red 1, which therefore would definitely signal a long-term sell signal if price moves below the lows of this weeks candle (next week) at $9,078. Breaking down from $9K would signal bearish trend change on the Weekly chart, based on this indicator alone. Depending on how you draw your long-term resistance trend-line - from the December 2019 highs of $20K with the 2019 $14K and 2010 $10K highs - price is arguably continuing to find support from this trend-line after closing two non-consecutive candles above it. This can be seen clearer from the 4hr chart (yellow line) also referenced below. However, given the subjectivity of these types of trend-lines, it's also possible to consider price finding strong resistance at this level with a bearish bias. The RSI remains in the neutral zone, while the CMF also remains more-or-less neutral. Apart from the potential bullish support from the long-term trend line, there are definite bearish factors arising from the TD and strong horizontal resistance. Shifting the mid-term VPVR point of control to $9,491 is inherently bullish, however price needs to close above this level for a bullish bias.
4hr chart - 50-50 no bias with bullish pattern and bear flag structure  While price found support from the bullish ascending triangle pattern, price is now struggling to find support from the 200 MA, despite the 50 MA remaining above the 200 - as well as failing to cross below the 200 last month - therefore remains in bullish formation until a bear cross is confirmed. Similar to the Daily and Weekly charts, price sits below the VPVR point of control at $9492. Price therefore needs to close back above the 200 MA and VPVR to return to a 60-40 bullish bias, but remains to be seen as of writing, hence current neutral bias. Moving back above $9.5K, in order to re-target the horizontal resistance of the ascending triangle pattern, would return my bullish bias. The RSI is within the neutral zone of 40-60 (after briefly becoming bearish for a few candles), however the CMF is turning bearish and gaining momentum which is a cause for concern. With price trading sideways, there is an argument for a bear flag structure that would target the $8.8K level. This would however remain within a bull flag structure on a Daily time frame, as also referenced below. With price otherwise trading within the ascending triangle structure, there is still the 70% probability price will break upwards, despite short-term bearish factors. Next weeks candle is likely to be critical in determining the long-term trend of Bitcoin in the coming weeks.
Daily chart - 55-45 bullish bias alternative bull flag perspective (lacks confirmation of three touch-points per support/resistance)  Of concern on the Daily chart now referenced above is the confirmation of bearish divergence on the RSI, that would need to be broken in order to confirm stronger bullish bias: 
Overview (TL:DR) - 60-40 bullish bias likely to be reduced to 55-45 bullish bias next week - While in the past Week I've been 60-40 bullish bias overview, closing the Weekly candle on a TD on a Red 1 would shift this to 55-45 slight bullish bias.
- A move below $9K (on a Red 2 candle moving below a Red 1) would give me a 60-40 bearish bias, as a strong sell signal would be confirmed.
- A break below $8.8K (bull flag structure) would confirm a 70-30 bearish bias, with the target of around an $8K Bitcoin to the 100 & 200 Day MAs.
Although still remaining slightly bullish for now, until the end of the day at least, I don't believe price will find support from the 100/200 Day MAs around $8K if price breaks down from the bull flag structure, instead finding it more likely to return to somewhere between the 100 Week MA around $7.25K and the VPVR point of control of $6.5K. Re-testing the 200 Week MA around $6K I find unlikely, instead I'd expect the market to front-run those trying to buy this reliable long-term "line in the sand" price support MA.
Monthly chart - remains fully bullish as per usual  While only half way through the month, therefore overlooking this month's current candle that has two weeks to go, the TD sequential is on a Green 3, after the long bullish wick of March 2020. Price is otherwise above the 20, 50 & 100 MAs - that are all bullish formation ( as always). Strong volume support is at the VPVR point of control of $6,569. The RSI is currently neutral while the CMF is negative but with bullish divergence based on recent months price action, pointing towards a long-term bull-run by the end of the year: 
|
|
|
|
|
|
|
|
|
According to NIST and ECRYPT II, the cryptographic algorithms used in
Bitcoin are expected to be strong until at least 2030. (After that, it
will not be too difficult to transition to different algorithms.)
|
|
|
Advertised sites are not endorsed by the Bitcoin Forum. They may be unsafe, untrustworthy, or illegal in your jurisdiction.
|
|
|
|
|
|
|
dragonvslinux (OP)
Legendary
Offline
Activity: 1666
Merit: 2204
Crypto Swap Exchange
|
|
June 14, 2020, 02:05:38 PM |
|
For reference sake, here would be a setup for a short trade using the TD Sequential 9 Sell signal next week, based on the current candle closing as a Red 1: - Entry: $9,078: a Red 2 moving below the Red 1 candle after a TD 9 Sell signal
- Target: $7,250: 100 Week MA support and 0.382 fib retracement level
- Stop: $10,012: a move above the Red 1 candle
- Risk/reward: 1.95. 10% risk, 20% reward.
 Given the strong volume support (VPVR POC) around $8,699, as well as the 50 Week MA at $8,735, it'd be wise to move a stop loss to break even entry ($9,078) or slightly higher ($9,200, depending on your risk tolerance) to re-test ascending triangle support turned resistance, in order to reduce risk. The trade could then alternatively be moved over to the Daily chart with a target of the 100/200 Day MA around $8K with a much better risk/reward ratio. Given that this trade would be a 1.95 risk/reward ratio at setup, while most traders prefer a minimum of 2:0 risk/reward, I'd consider it a medium to high risk trade. It's worth noting that despite the bullish conditions at present with price above the 50 Week MA, this important MA - as well as the 21 Week MA - have begun to roll over with a slightly declining trajectory due to the March capitulation that occurred, consequently the 21 MA has therefore failed to move above the 50 MA in recent weeks. This implies that long-term price is not yet fully bullish, with MAs not in bullish formation while shorter-term MAs are beginning to decline: therefore a pull-back is to be anticipated. In contrast, the 100 & 200 Week MAs are still rising, implying that they should act as strong support should price correct, and long-term price is likely to continue moving higher. Depending on how this week closes, I'd consider allowing this trade to trigger with a small position size (smaller than usual). |
|
|
|
Dollar_Hunter
Member
 Offline
Activity: 1078
Merit: 21
COMBONetworkio
|
|
June 14, 2020, 03:18:20 PM |
|
means that if a conclusion is drawn, it seems that Bullish is still winning,
I also analyze it like that, because Long in futures trading is more than Short
|
|
|
|
dragonvslinux (OP)
Legendary
Offline
Activity: 1666
Merit: 2204
Crypto Swap Exchange
|
|
June 15, 2020, 02:24:58 PM |
|
4hr chart - 50-50 no bias with bullish pattern and bear flag structure While price found support from the bullish ascending triangle pattern, price is now struggling to find support from the 200 MA, despite the 50 MA remaining above the 200 - as well as failing to cross below the 200 last month - therefore remains in bullish formation until a bear cross is confirmed. Similar to the Daily and Weekly charts, price sits below the VPVR point of control at $9492. Price therefore needs to close back above the 200 MA and VPVR to return to a 60-40 bullish bias, but remains to be seen as of writing, hence current neutral bias. Moving back above $9.5K, in order to re-target the horizontal resistance of the ascending triangle pattern, would return my bullish bias. The RSI is within the neutral zone of 40-60 (after briefly becoming bearish for a few candles), however the CMF is turning bearish and gaining momentum which is a cause for concern. With price trading sideways, there is an argument for a bear flag structure that would target the $8.8K level. This would however remain within a bull flag structure on a Daily time frame, as also referenced below. With price otherwise trading within the ascending triangle structure, there is still the 70% probability price will break upwards, despite short-term bearish factors. Next weeks candle is likely to be critical in determining the long-term trend of Bitcoin in the coming weeks. 4hr bear flag has played out by the looks of it, but notably still within an ascending triangle pattern after re-alligning with the new lows forming. The new lows formed on the 4hr chart look suspiciously like a short-term bear trap, if price can stay above $9K and close the day above the 50 Day MA at $9.3K to re-test $9.5K levels.  Price is otherwise still within in the bull flag with a long wick forming on the Daily chart that looks bullish for now:  Will remain 55-45 bullish bias with price above $9K, despite last Week closing as a Red 1. |
|
|
|
dragonvslinux (OP)
Legendary
Offline
Activity: 1666
Merit: 2204
Crypto Swap Exchange
|
|
June 18, 2020, 11:42:35 AM |
|
4hr bear flag has played out by the looks of it, but notably still within an ascending triangle pattern after re-alligning with the new lows forming. The new lows formed on the 4hr chart look suspiciously like a short-term bear trap, if price can stay above $9K and close the day above the 50 Day MA at $9.3K to re-test $9.5K levels. Short-term on the 4hr another bearish factor is emerging, the 50 MA is now crossing below the 200 MA for a 4hr death cross. While only emerging on the 4hr (given price is still above the 50 & 200 Day MAs that are in bullish formation), this would be the sell signal for MA traders from the April 7th buy signal around $7,300. Given we are still within the ascending triangle structure referenced above, I'll remain neutral on this time-frame until the ascending triangle structure is broken. This could be another bear trap, although decreasing volume is another cause for concern. The CMF remains positive and rising, the RSI is currently neutral. We are otherwise struggling to stay above the VPVR point of control: 
Daily chart - 55-45 bullish bias alternative bull flag perspective (lacks confirmation of three touch-points per support/resistance) On the Daily chart, we are finding support from the 50 Day MA which is encouraging, but price needs to keep moving higher in the near future to remain above it, otherwise a re-test of the 200 Day MA around $8,300 appears inevitable, if the 50 Day MA flips to resistance overtime. On the candle-stick chart, we otherwise more-or-less confirmed the support level of the bull flag structure with a third point of confirmation, while creating the bear trap of the ascending triangle merely shifting it's support trend-line:  Based on the line chart perspective, we are currently forming a short-term bear flag on the Daily time-frame that would re-target the strong support level of the marco bull flag structure around $8,800. While a re-test of the bull flag structure wouldn't be inherently bearish if price finds support at this level, it would instead be even more bullish to further confirm this trading range (at the highs), as long as price bounces strong and doesn't get trapped below the 50 Day MA afterwards. Similar to the 4hr perspective, price is struggling to move back above the VPVR point of control and strengthening resistance of $9.5-$9.6K. A 100 & 200 Day bull cross looks set for this month around $8,300 which is positive development however, that would align all relevant MAs into bullish formation: 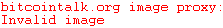 The bearish divergence on the RSI remains in tact, as referenced in the OP, price needs to move higher in order to breach this bearish signal:  Regardless, while remaining within an ascending triangle structure on the 4hr, as well as a macro-sized bull flag on the Daily chart, I'll remain 55-45 bullish until proven otherwise. Nothing to add on the Weekly charts for now. |
|
|
|
dragonvslinux (OP)
Legendary
Offline
Activity: 1666
Merit: 2204
Crypto Swap Exchange
|
|
June 19, 2020, 04:01:51 PM
Last edit: June 19, 2020, 08:46:59 PM by dragonvslinux Merited by cryptoperkele (1) |
|
Short-term on the 4hr another bearish factor is emerging, the 50 MA is now crossing below the 200 MA for a 4hr death cross. While only emerging on the 4hr (given price is still above the 50 & 200 Day MAs that are in bullish formation), this would be the sell signal for MA traders from the April 7th buy signal around $7,300. Given we are still within the ascending triangle structure referenced above, I'll remain neutral on this time-frame until the ascending triangle structure is broken. This could be another bear trap, although decreasing volume is another cause for concern. The CMF remains positive and rising, the RSI is currently neutral. We are otherwise struggling to stay above the VPVR point of control: Price got rejected by the 50 & 200 MA death cross on the 4hr (pink hammer) as anticipated, the last death cross was seen in February 2020 before price crashed by 50+% - hence profit taking occurring due to this risk-reduction selling pressure. Bitcoin is now re-testing the 50 MA (purple line, yellow hammer) that becomes the entry for the short signal on this time-frame: selling the re-test of the 50 MA that's sloping downwards with bearish momentum after crossing below the 200 MA. Despite being within the ascending triangle structure, it's hard not to start leaning bearish with a 55-45 bias. Price will need to find support from the ascending triangle support trend-line, otherwise all hell could break lose.  I'm still remaining 55-45 bullish on the Daily time-frame, but closing below the 50 Day MA would put me back on the 50-50 fence, as long as we hold $8,800 macro bull flag / trading range support. The 50 Day MA now sits at $9,387 and is rising indicating bullish momentum, but price needs to maintain this momentum by closing above this MA in order to avoid breaking down further to the $8.8K bull flag support target, or potentially lower to re-test the 200 Day MA around $8,3K (for the first time since the golden cross) if bears follow through with volume: On the Daily chart, we are finding support from the 50 Day MA which is encouraging, but price needs to keep moving higher in the near future to remain above it, otherwise a re-test of the 200 Day MA around $8,300 appears inevitable, if the 50 Day MA flips to resistance overtime. On the candle-stick chart, we otherwise more-or-less confirmed the support level of the bull flag structure with a third point of confirmation, while creating the bear trap of the ascending triangle merely shifting it's support trend-line: Based on the line chart perspective, we are currently forming a short-term bear flag on the Daily time-frame that would re-target the strong support level of the marco bull flag structure around $8,800. While a re-test of the bull flag structure wouldn't be inherently bearish if price finds support at this level, it would instead be even more bullish to further confirm this trading range (at the highs), as long as price bounces strong and doesn't get trapped below the 50 Day MA afterwards. The bearish divergence on the RSI remains in tact, as referenced in the OP, price needs to move higher in order to breach this bearish signal: Regardless, while remaining within an ascending triangle structure on the 4hr, as well as a macro-sized bull flag on the Daily chart, I'll remain 55-45 bullish until proven otherwise. |
|
|
|
dragonvslinux (OP)
Legendary
Offline
Activity: 1666
Merit: 2204
Crypto Swap Exchange
|
|
June 20, 2020, 06:10:28 AM |
|
Price got rejected by the 50 & 200 MA death cross on the 4hr (pink hammer) as anticipated, the last death cross was seen in February 2020 before price crashed by 50+% - hence profit taking occurring due to this risk-reduction selling pressure. Bitcoin is now re-testing the 50 MA (purple line, yellow hammer) that becomes the entry for the short signal on this time-frame: selling the re-test of the 50 MA that's sloping downwards with bearish momentum after crossing below the 200 MA. Despite being within the ascending triangle structure, it's hard not to start leaning bearish with a 55-45 bias. Price will need to find support from the ascending triangle support trend-line, otherwise all hell could break lose. Price is continuing to get knocked down by MA resistance, as previously referenced. We also appear to be in a bear channel that could target a breakdown of the macro sized bull channel around $8,650. The $9,250-$9.300 horizontal support is weakening, without a strong bounce soon, lower lows seem the most likely outcome. RSI price strength has bounced twice from 40, but is failing to move higher and remains in a clear downtrend. The CMF has flat-lined again and threatening to turn negative, it's therefore not looking good for the bulls anymore on this time-frame, now leaning 60-40 bearish, despite being within an ascending triangle, predominantly due to the MA death cross that occurred:  I'm still remaining 55-45 bullish on the Daily time-frame, but closing below the 50 Day MA would put me back on the 50-50 fence, as long as we hold $8,800 macro bull flag / trading range support. The 50 Day MA now sits at $9,387 and is rising indicating bullish momentum, but price needs to maintain this momentum by closing above this MA in order to avoid breaking down further to the $8.8K bull flag support target, or potentially lower to re-test the 200 Day MA around $8,3K (for the first time since the golden cross) if bears follow through with volume On the Daily chart, we are still within an ascending triangle and above Weekly long-term resistance for now, so there is still hope, but we closed below the 50 Day MA that is likely to act as resistance if price doesn't break back above it in quickly. Zooming out, the fib retracements levels from the March 16th low to the June 1st high leaves a lot of room to the downside is the main concern here. While the 0.618 could act as strong support with the 100 & 200 Day MAs bull-crossing, anywhere between the 0.382 and 0.5 becomes fair game ($6.7-7.5K) for a longer-term "bullish" correction, if a breakdown is to occur. I'm back on the fence 50-50 on this time-frame, until a clearer picture emerges:  Will wait for the end of the Week before re-considering any further the longer-term picture. |
|
|
|
dragonvslinux (OP)
Legendary
Offline
Activity: 1666
Merit: 2204
Crypto Swap Exchange
|
|
June 20, 2020, 11:51:12 AM |
|
Trading bots taking over by the looks of it. Price broke down perfectly to the Weekly long-term resistance to test it as support (yellow line), bulls then pushed price back up to the 50 MA and VPVR point of control. Indecisive candle means price could continue in either direction:  The candle slightly favors the bulls on smaller time-frame given the fake breakdown, as well as the majority of volume coming from buying pressure as opposed to selling:  |
|
|
|
dragonvslinux (OP)
Legendary
Offline
Activity: 1666
Merit: 2204
Crypto Swap Exchange
|
|
June 20, 2020, 11:39:55 PM
Last edit: June 21, 2020, 12:27:02 AM by dragonvslinux |
|
The candle slightly favors the bulls on smaller time-frame given the fake breakdown, as well as the majority of volume coming from buying pressure as opposed to selling: The bullish ascending triangle was well-defended with a second confirmation, this is definitely a bullish sign, but requires more confirmation. I'm expecting more upside now, as long as price can break through the 50 & 200 MA that has been acting as recent resistance. While this could be a bull trap on this time-frame, as we've already had a few bear traps, the ascending triangle still has a 70% chance of breaking to the upside. 55-45 bullish for now. Another rejection from the 50 MA would make me slightly bearish again however:  On the Daily time-frame, it isn't looking quite as bullish as the 4hr imo, despite the ascending triangle remaining in tact, as well as the recent trading pattern. The 50 Day MA at $9,397 is now acting as resistance, as previously anticipated. We need to break through quick, ideally overnight or tomorrow, instead of confirming it as new resistance. While the CMF is maintaining momentum, volume is continuing to decline which is a concern, while RSI remains neutral with bearish divergence. Currently 50-50 on this time-frame, but closing back above $9,400 would swiftly return by 55-45 bullish bias, above $9,510 VPVR would return my bias to 60-40:  My previous TA of the Daily remains more-or-less the same: I'm still remaining 55-45 bullish on the Daily time-frame, but closing below the 50 Day MA would put me back on the 50-50 fence, as long as we hold $8,800 macro bull flag / trading range support. The 50 Day MA now sits at $9,387 and is rising indicating bullish momentum, but price needs to maintain this momentum by closing above this MA in order to avoid breaking down further to the $8.8K bull flag support target, or potentially lower to re-test the 200 Day MA around $8,3K (for the first time since the golden cross) if bears follow through with volume: On the Daily chart, we are finding support from the 50 Day MA which is encouraging, but price needs to keep moving higher in the near future to remain above it, otherwise a re-test of the 200 Day MA around $8,300 appears inevitable, if the 50 Day MA flips to resistance overtime. The bearish divergence on the RSI remains in tact, as referenced in the OP, price needs to move higher in order to breach this bearish signal: Regardless, while remaining within an ascending triangle structure on the 4hr, as well as a macro-sized bull flag on the Daily chart, I'll remain 55-45 bullish until proven otherwise. Otherwise waiting for the Weekly candle to close, it's the weekend so there is only more noise to come. |
|
|
|
exstasie
Legendary
Offline
Activity: 1806
Merit: 1521
|
|
June 21, 2020, 12:04:48 AM |
|
Otherwise waiting for the Weekly candle to close, it's the weekend so there is only more noise to come.
That's all that big hourly doji was, weekend noise. BTC is waiting for the stock markets to reopen and make their move. The positive correlation is in full effect, there's no denying it:   |
|
|
|
dragonvslinux (OP)
Legendary
Offline
Activity: 1666
Merit: 2204
Crypto Swap Exchange
|
|
June 21, 2020, 12:13:56 PM
Last edit: June 21, 2020, 12:26:04 PM by dragonvslinux |
|
The bullish ascending triangle was well-defended with a second confirmation, this is definitely a bullish sign, but requires more confirmation. I'm expecting more upside now, as long as price can break through the 50 & 200 MA that has been acting as recent resistance. While this could be a bull trap on this time-frame, as we've already had a few bear traps, the ascending triangle still has a 70% chance of breaking to the upside. 55-45 bullish for now. Another rejection from the 50 MA would make me slightly bearish again however: We're getting rejected by the 50 MA yet again as traders continue to sell the re-test after the death cross  A 1-4 candle TD correction to the upside has completed, setting up for up more downside. Looks like price is trying to find support from the bull flag resistance trend-line that we were in, but ultimately this leads to lower lows and re-testing the ascending triangle support for a third time. As previously referenced, despite confirming this triangle trend-line as support, I'm leaning bearish again 55-45 due to the MA resistance overhead, as well as the VPVR POC that price is failing to move back above. A break below the ascending triangle support would increase this to 60-40 or higher: 
On the Daily time-frame, it isn't looking quite as bullish as the 4hr imo, despite the ascending triangle remaining in tact, as well as the recent trading pattern. The 50 Day MA at $9,397 is now acting as resistance, as previously anticipated. We need to break through quick, ideally overnight or tomorrow, instead of confirming it as new resistance. While the CMF is maintaining momentum, volume is continuing to decline which is a concern, while RSI remains neutral with bearish divergence.
On the Daily chart we are struggling to move back above the 50 Day MA, while the bear flag structure targeting $8,850 and strong VPVR support remains in tact. The 100 & 200 Day MA bull cross should act as some support if price fails to hold the macro bull channel price has been trading within for the past 6 weeks:  The bearish divergence on the RSI remains in tact, as referenced in the OP, price needs to move higher in order to breach this bearish signal:
Otherwise waiting for the Weekly candle to close, it's the weekend so there is only more noise to come.
That's all that big hourly doji was, weekend noise. BTC is waiting for the stock markets to reopen and make their move. The positive correlation is in full effect, there's no denying it: You're probably right yes, I was leaning bullish on the bassis of getting back above MA resistance, but alas this did not occur. |
|
|
|
dragonvslinux (OP)
Legendary
Offline
Activity: 1666
Merit: 2204
Crypto Swap Exchange
|
|
June 22, 2020, 10:03:14 AM
Last edit: June 22, 2020, 10:38:13 AM by dragonvslinux |
|
We're getting rejected by the 50 MA yet again as traders continue to sell the re-test after the death cross A 1-4 candle TD correction to the upside has completed, setting up for up more downside. Looks like price is trying to find support from the bull flag resistance trend-line that we were in, but ultimately this leads to lower lows and re-testing the ascending triangle support for a third time. As previously referenced, despite confirming this triangle trend-line as support, I'm leaning bearish again 55-45 due to the MA resistance overhead, as well as the VPVR POC that price is failing to move back above. A break below the ascending triangle support would increase this to 60-40 or higher: We managed to find a weak bounce (declining volume) from the short-term bull channel, but now facing resistance from the 200 MA while trying to hold the VPVR POC. The expected outcome would be a rejection from this resistance, followed by a re-test of the ascending triangle support, Moving above $9,500 would gives the bulls a chance however: 
On the Daily time-frame, we are currently testing the bearish divergence, the anticipated outcome would be this longer-term divergence holding and price moving further down:  We are otherwise testing the 50 Day MA around $9,400, however price really needs to move back above the VPVR POC ($9,500) and mid-level of the bull channel ($9,600) to be given another chance, otherwise this is merely a dead cat bounce before lower lows, continuing to form the bear flag targeting $8,800 as previously referenced:  On the Daily chart we are struggling to move back above the 50 Day MA, while the bear flag structure targeting $8,850 and strong VPVR support remains in tact. The 100 & 200 Day MA bull cross should act as some support if price fails to hold the macro bull channel price has been trading within for the past 6 weeks:
Despite closing the Week with a red candle (-0.47%), the candle itself was an indecisive doji with a slight bullish bias (despite anyone else's opinions on price structure). The low of the wick to the body was +4.23%, while the top of the wick to the candle body was only -2.69%, this gives it a ratio of being around 60% bullish and 40% bearish:  Does this mean price will now definitely move higher? Absolutely not, 60:40 is not good odds. it merely confirms the indecision in the Bitcoin market right now, as opposed to definitively bullish or bearish longer-term outlook. While the 4hr and Daily lean bearish 60-40, they remain in bullish structures (ascending triangle and bull flag), the Weekly remains relatively neutral. The 21 & 50 MAs have started sloping downwards indicating bearish momentum, while the 100 & 200 Week are moving upwards with bullish momentum. Price is however above all of these MAs, 3/4 are in bullish formation (21MA is below the 50MA), while price continues to make higher highs and lower lows on a macro scale. The bearish concerns are the RSI creating a slight bearish divergence from being rejected twice from the bullish conditions >60, while the CMF is gaining selling momentum:  Whether we are finding rejection from the long-term resistance trend-line, or in fact finding support for a third week, remains a matter of opinion and subjectivity.
To all the bears out there based on the Weekly close, learn to read and measure the candle, especially dojis  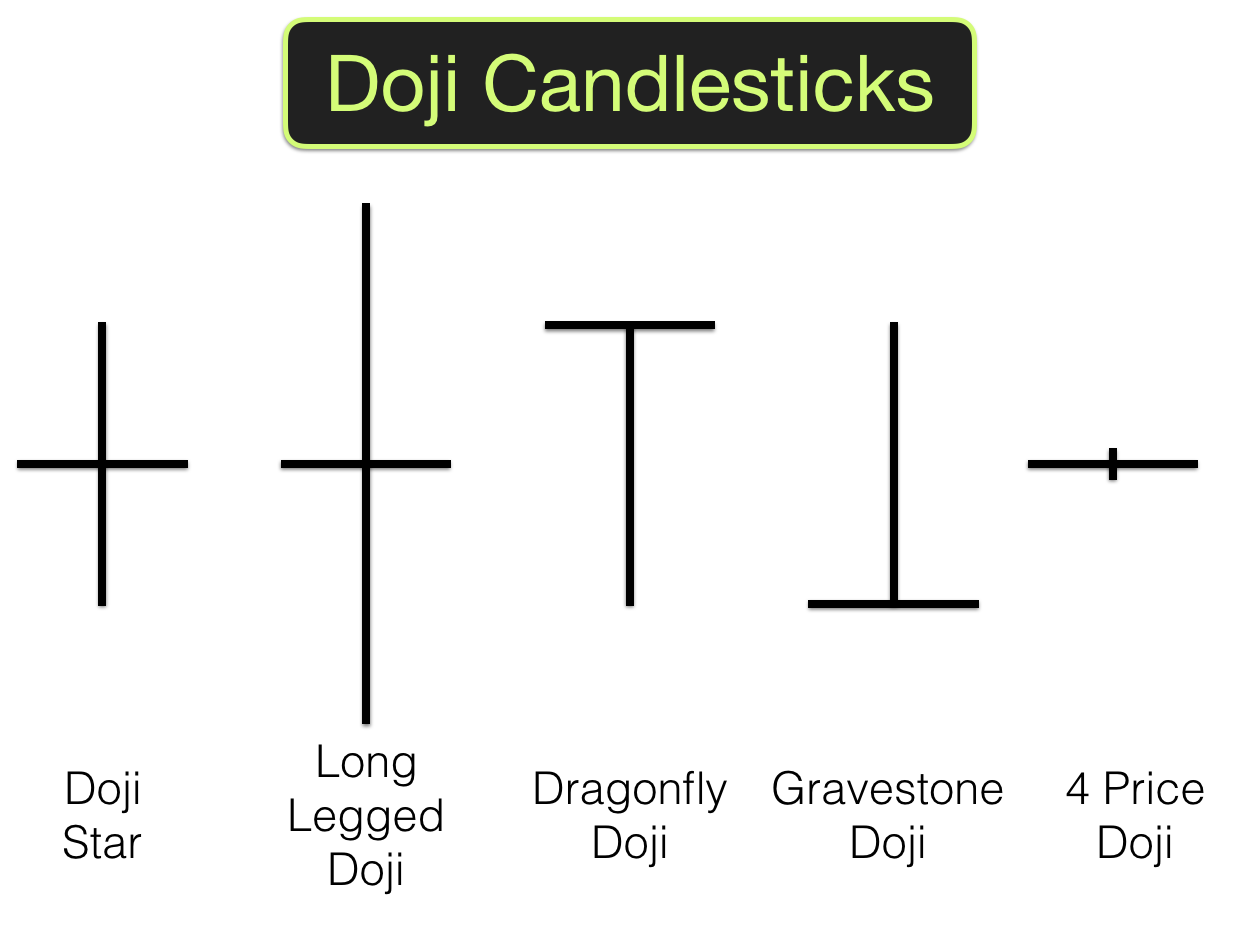 Source: excellenceassured.com Source: excellenceassured.com
What is a Long-Legged Doji?
The candlestick signals indecision about the future direction of the underlying security.
It is used by some traders to warn that indecision is entering the market after a strong advance. It may also warn that a strong downtrend may be experiencing indecision before making a move to the upside.
Long-legged dojis may also mark the start of a consolidation period, where the price forms one or more long-legged dojis before moving into a tighter pattern or breaks out to form a new trend. |
|
|
|
dragonvslinux (OP)
Legendary
Offline
Activity: 1666
Merit: 2204
Crypto Swap Exchange
|
|
June 23, 2020, 12:28:03 AM |
|
The bullish ascending triangle was well-defended with a second confirmation, this is definitely a bullish sign, but requires more confirmation. I'm expecting more upside now, as long as price can break through the 50 & 200 MA that has been acting as recent resistance. We managed to find a weak bounce (declining volume) from the short-term bull channel, but now facing resistance from the 200 MA while trying to hold the VPVR POC. The expected outcome would be a rejection from this resistance, followed by a re-test of the ascending triangle support, Moving above $9,500 would gives the bulls a chance however: Despite anticipating further rejection from the 200 MA on the 4hr, price broke through $9,500 returning the bullish sentiment. A golden cross of the 50 & 200 MA looks imminent in the coming candles, returning the bullish sentiment. I'm now returning to my 60-40 bullish bias and anticipating a move back to $10K resistance, as long as the $9.5-$.9,6K area can be flipped into support: 
On the Daily time-frame, we are currently testing the bearish divergence, the anticipated outcome would be this longer-term divergence holding and price moving further down We just broke the bearish divergence on the RSI with a close on the Daily, negating this bearish sentiment: [img width=10000]https://www.tradingview.com/x/BnBebE7Z/[/img]
We are otherwise testing the 50 Day MA around $9,400, however price really needs to move back above the VPVR POC ($9,500) and mid-level of the bull channel ($9,600) to be given another chance, otherwise this is merely a dead cat bounce before lower lows, continuing to form the bear flag targeting $8,800 as previously referenced Price successfully broke through the $9,600 resistance with an engulfing candle that moved above the previous 10, the mid-level of the bull flag, even closing back above the 21 Day MA as well as the 50. I'm back to 60-40 bullish again. Now expecting a move back up-to $10,500 resistance level, in order to confirm this pattern with a third touch-point: 
Despite closing the Week with a red candle (-0.47%), the candle itself was an indecisive doji with a slight bullish bias (despite anyone else's opinions on price structure). The low of the wick to the body was +4.23%, while the top of the wick to the candle body was only -2.69%, this gives it a ratio of being around 60% bullish and 40% bearish: Base on the TD Sequential, a long trade was activated today on the Weekly chart with a Green 2 moving above a Green 1 at $9,592 after a 1-4 candle correction from the 9 sell signal, despite price being in the middle of the bull flag and ascending triangle pattern on smaller time-frames (that on the Daily chart should remain a no-trade zone): 
|
|
|
|
dragonvslinux (OP)
Legendary
Offline
Activity: 1666
Merit: 2204
Crypto Swap Exchange
|
|
June 24, 2020, 01:58:03 PM |
|
Despite anticipating further rejection from the 200 MA on the 4hr, price broke through $9,500 returning the bullish sentiment. A golden cross of the 50 & 200 MA looks imminent in the coming candles, returning the bullish sentiment. I'm now returning to my 60-40 bullish bias and anticipating a move back to $10K resistance, as long as the $9.5-$.9,6K area can be flipped into support: Price is finding support for the third time in recent days from the ascending triangle support, which appears to be a crucial level to defend on this time-frame. The bulls failed to flip the $9.5-$9.6K level into support, putting a pause on the $10K target for now; hence only being 60-40 bullish (not worth the risk) and now I'm now back to 50-50. Despite anticipating the 50 MA to move above the 200 MA, in order to create a death cross fake-out, this failed to happen and now Bitcoin will need to move back above these MAs to avoid rejection: 
We just broke the bearish divergence on the RSI with a close on the Daily, negating this bearish sentiment:  Yesterday I referenced the bearish RSI divergence being successfully broken. While this is still true, it's worth noting the previous time this divergence was broken but led to a bullish fake-out and lower lows. While this may not be the case this time around, it's worth remaining cautious until price can move back above key resistance: 
Price successfully broke through the $9,600 resistance with an engulfing candle that moved above the previous 10, the mid-level of the bull flag, even closing back above the 21 Day MA as well as the 50. I'm back to 60-40 bullish again. Now expecting a move back up-to $10,500 resistance level, in order to confirm this pattern with a third touch-point: Similar to the 4hr, the Daily chart isn't looking as bullish either now. For reference sake, I've adjusted the bull channel to be drawn from the three touch-points of support (better late than never), as opposed to the two touch-points of resistance - in order for more accuracy. Notably this shows price being rejected from the mid-level, as opposed to closing above it as I had previously considered. The key level remains moving back above the 50 Day MA and VPVR POC (now lowered to $9,,450) to return the bullish sentiment, but until price moves back above the mid-level of the bull channel (now considered to be $9.7K), then the trend remains slightly bearish within a bullish pattern. Back on the 50-50 fence again! 
|
|
|
|
dragonvslinux (OP)
Legendary
Offline
Activity: 1666
Merit: 2204
Crypto Swap Exchange
|
|
June 26, 2020, 05:01:30 PM |
|
Price is finding support for the third time in recent days from the ascending triangle support, which appears to be a crucial level to defend on this time-frame. The bulls failed to flip the $9.5-$9.6K level into support, putting a pause on the $10K target for now; hence only being 60-40 bullish (not worth the risk) and now I'm now back to 50-50. Despite anticipating the 50 MA to move above the 200 MA, in order to create a death cross fake-out, this failed to happen and now Bitcoin will need to move back above these MAs to avoid rejection: Since recent price action, I've re-alligned the ascending triangle to include as many candle bodies and wicks as possible. While some may consider this cheating, this is well within the requirements of an ascending triangle (apart from the $10.4K head fake). Despite creating new candle body closes at lower levels and bearish RSI & CMF, based on the bullish pattern and structure and recent confirmations of support, I'll remain 50-50 until there is further confirmation. If $9K is convincingly broken, then I'll turn bearish. 
Yesterday I referenced the bearish RSI divergence being successfully broken. While this is still true, it's worth noting the previous time this divergence was broken but led to a bullish fake-out and lower lows. While this may not be the case this time around, it's worth remaining cautious until price can move back above key resistance: As referenced recently, the RSI breaking through bearish divergence could be a bull trap, which seems to of transpired as price strength moves lower and closer to the support of the neutral level at 40: 
Similar to the 4hr, the Daily chart isn't looking as bullish either now. For reference sake, I've adjusted the bull channel to be drawn from the three touch-points of support (better late than never), as opposed to the two touch-points of resistance - in order for more accuracy. Notably this shows price being rejected from the mid-level, as opposed to closing above it as I had previously considered. The key level remains moving back above the 50 Day MA and VPVR POC (now lowered to $9,,450) to return the bullish sentiment, but until price moves back above the mid-level of the bull channel (now considered to be $9.7K), then the trend remains slightly bearish within a bullish pattern. Back on the 50-50 fence again! Since shifting this bull channel to include the 15th June wick, price has since twice tested this bull flag support (that now lines up with the ascending triangle, depending on how you want to view things). Bears are starting to struggle to push price lower and out of the channel. I can see an argument for a high risk long-trade, with a good risk/reward ratio, however given the shorter-term MAs beginning to trend downwards, it's not a trade I'd take.  I otherwise moved the resistance trend-line on this chart to include recent candle rejecting the price, from the January 2018 peak of $17K, instead of $20K. My 4hr chart with the ascending triangle (more bullish pattern), shows the resistance trend-line as support. I thought a bit of subjectivity while remaining patient could be useful for me. |
|
|
|
dragonvslinux (OP)
Legendary
Offline
Activity: 1666
Merit: 2204
Crypto Swap Exchange
|
|
June 28, 2020, 04:18:50 PM
Last edit: June 28, 2020, 05:53:16 PM by dragonvslinux |
|
Since recent price action, I've re-alligned the ascending triangle to include as many candle bodies and wicks as possible. While some may consider this cheating, this is well within the requirements of an ascending triangle (apart from the $10.4K head fake). Despite creating new candle body closes at lower levels and bearish RSI & CMF, based on the bullish pattern and structure and recent confirmations of support, I'll remain 50-50 until there is further confirmation. If $9K is convincingly broken, then I'll turn bearish. While $9K was swiftly taken out again, this time by falling out of the ascending triangle structure, it was pretty unconvincing to say the least. The 4hr chart undoubtedly remains bearish with a plethora of resistance overhead; the Weekly resistance trend-line, the 50 & 100 MAs that are all sloping downwards in bearish formation, the VPVR POC around $9,500, as well as the flat looking 200 MA around $9,460. On the upside, price broken out of a short-term bear flag to the upside, suggesting another bear trap. If bears break down and close candles below the ascending triangle again, I'll be 60-40 bearish. For now, I'm leaning beairsh 55-45 unless bulls can prove otherwise. Nothing trade-able on this time-frame without conclusive confirmation, see Daily chart for further reasons why. Others are pointing to a head & shoulders pattern, that would confirm with a break-down from triangle support. Technically it already did confirm, but was unsustainable, only highlighting the danger of shorting into strong support. 
Since shifting this bull channel to include the 15th June wick, price has since twice tested this bull flag support (that now lines up with the ascending triangle, depending on how you want to view things). Bears are starting to struggle to push price lower and out of the channel. I can see an argument for a high risk long-trade, with a good risk/reward ratio, however given the shorter-term MAs beginning to trend downwards, it's not a trade I'd take. Despite the overwhelming bearish sentiment in the markets right now, the Daily isn't looking that bad to me anymore. We remain in the bullish channel with yet another short-term bear trap (RIP shorts) after finding support from the strong volume area and previous lows around $8,800. In case it wasn't obvious, we just made a higher low. The concern structurally is failing to create a new higher high within the bull channel, but instead continuing to test support after failing to move above the mid-line. Bulls really need to move back above the 50 Day MA (that will soon be shedding it's bearish bias of sloping downwards, see trajectory), as well as the obvious mid-level resistance of $9,750. The CMF has more or less maintained it's buying pressure, instead of turning negative to selling pressure, this is additionally a good sign.  As referenced recently, the RSI breaking through bearish divergence could be a bull trap, which seems to of transpired as price strength moves lower and closer to the support of the neutral level at 40: While the bearish divergence remains, we did find RSI support from from the recent "correction". Also bear in mind this was a low (decreasing) volume -1.67% drop, this was not a dump. A dump would be 5-10% on high volume, the recent candle means very little apart from confirming bull channel support and avoiding bearish RSI conditions. I'm therefore leaning 55-45 bullish on the Daily now (in contrast to the slightly bearish 4hr), a move back above the 50 MA would shift this to 60-40, back above $9.75K, easily 70-30 bullish. 
Will otherwise wait until the Weekly close before any TA on this time-frame, given the weekend noise. |
|
|
|
buwaytress
Legendary
 Online Online
Activity: 2786
Merit: 3437
Join the world-leading crypto sportsbook NOW!
|
|
June 29, 2020, 01:45:27 PM |
|
Just saw your other one on hash ribbons buy signals, so if I were a believer in hash rate extrapolation, I'd definitely be firmly on medium term bullish right now, though I might want to wait for another adjustment before taking a dip.
But I'm not, so I'm like you, leaning towards bearish as I have been in this tight range for weeks, but not unopposed to changing my mind if something spectacular shows up.
So much calm in the markets. Something has to give.
|
|
|
|
dragonvslinux (OP)
Legendary
Offline
Activity: 1666
Merit: 2204
Crypto Swap Exchange
|
|
June 29, 2020, 03:15:49 PM
Last edit: September 10, 2023, 01:41:40 PM by dragonvslinux |
|
Just saw your other one on hash ribbons buy signals, so if I were a believer in hash rate extrapolation, I'd definitely be firmly on medium term bullish right now, though I might want to wait for another adjustment before taking a dip.
But I'm not, so I'm like you, leaning towards bearish as I have been in this tight range for weeks, but not unopposed to changing my mind if something spectacular shows up.
So much calm in the markets. Something has to give.
On shorter time-frames 4hr I'm more bearish, Daily I'm more neutral right now: Inverse Head & Shoulders Fractal - Deadcat to $9.4K?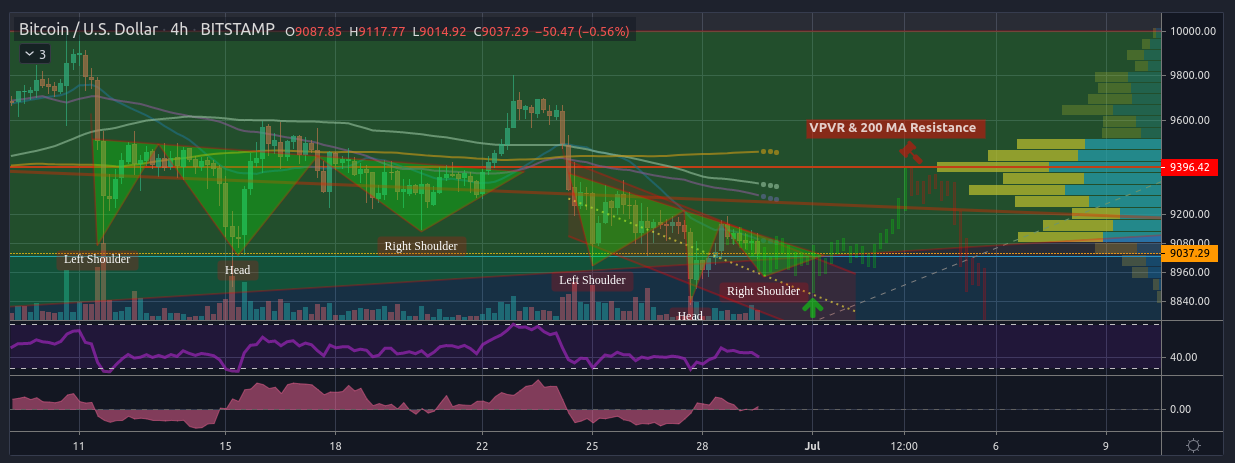 A few possible scenarios A few possible scenarios
On the Weekly I'm arguably still slightly bullish. Pending confirmation to be more bullish: Just saw your other one on hash ribbons buy signals, so if I were a believer in hash rate extrapolation, I'd definitely be firmly on medium term bullish right now, though I might want to wait for another adjustment before taking a dip. Bearish price actions lacks confluence with bullish hash rate imo, hence no buy signal given yet. Could take some time to get it, but more likely to signal than not eventually. On the Daily time-frame at least, this signals has always confirmed after hash rate recovery usually within a few days days. The exceptions to the rule was after the second halving in 2016, which was delayed by around 10 days, as well as 2015, that took 4 weeks to confirm. Most notable all 11 buy signals (blue) have appeared within a month of recovery in hash rate (green), followed by making new hash rate ATH within a short number of days. It's hard not to see the obvious nature of the similarities between these halvings, price aside. To me it therefore seems any dips will be well-defended as the next bullish cycle for Bitcoin will be ready. 2012 - First Halving 2016 - Second Halving 2016 - Second Halving 2020 - Third Halving 2020 - Third Halving |
|
|
|
buwaytress
Legendary
Online
Activity: 2786
Merit: 3437
Join the world-leading crypto sportsbook NOW!
|
|
June 30, 2020, 08:15:14 AM |
|
On shorter time-frames 4hr I'm more bearish, Daily I'm more neutral right now:
Inverse Head & Shoulders Fractal - Deadcat to $9.4K?
If we can even see 9.4k! Not so much a bounce atm but a lazy attempt to recover lost ground. I think the "wait for Friday" feeling has been consistently keeping traders grounded for much of the past weeks. Bearish price actions lacks confluence with bullish hash rate imo, hence no buy signal given yet. Could take some time to get it, but more likely to signal than not eventually. On the Daily time-frame at least, this signals has always confirmed after hash rate recovery usually within a few days days. The exceptions to the rule was after the second halving in 2016, which was delayed by around 10 days, as well as 2015, that took 4 weeks to confirm.
Most notable all 11 buy signals (blue) have appeared within a month of recovery in hash rate (green), followed by making new hash rate ATH within a short number of days. It's hard not to see the obvious nature of the similarities between these halvings, price aside. To me it therefore seems any dips will be well-defended as the next bullish cycle for Bitcoin will be ready.
Absolutely on hash rate confirmation, every argument I've seen has been pretty convincing not so much for the piling of historic signals, but for the lack of opposing signals. I get that hash rate should be pure economics. You're mining because you can turn a profit. But I know for sure also that miners are at least partially sentiment: they'll switch it on at a loss now if they believe they can turn a profit down the line soon. That miners are also hedging in options (apparently) proves they're playing on sentiment. So I'm also confident your buy signal on this will trigger. |
|
|
|
dragonvslinux (OP)
Legendary
Offline
Activity: 1666
Merit: 2204
Crypto Swap Exchange
|
|
June 30, 2020, 01:11:46 PM
Last edit: June 30, 2020, 02:01:27 PM by dragonvslinux |
|
On shorter time-frames 4hr I'm more bearish, Daily I'm more neutral right now:
Inverse Head & Shoulders Fractal - Deadcat to $9.4K?
If we can even see 9.4k! Not so much a bounce atm but a lazy attempt to recover lost ground. I think the "wait for Friday" feeling has been consistently keeping traders grounded for much of the past weeks. True story, Seeing price getting rejected by the mid-level of the current bear channel and not even get back close to its MAs, is a very bearish sign:  Edit: Edit: However, I'm still not ruling out the potential for another bear trap based on current adjusted/scaled fractal, followed by dead cat bounce to $9.4-9.5K levels: 
Bearish price actions lacks confluence with bullish hash rate imo, hence no buy signal given yet. Could take some time to get it, but more likely to signal than not eventually. On the Daily time-frame at least, this signals has always confirmed after hash rate recovery usually within a few days days. The exceptions to the rule was after the second halving in 2016, which was delayed by around 10 days, as well as 2015, that took 4 weeks to confirm.
Most notable all 11 buy signals (blue) have appeared within a month of recovery in hash rate (green), followed by making new hash rate ATH within a short number of days. It's hard not to see the obvious nature of the similarities between these halvings, price aside. To me it therefore seems any dips will be well-defended as the next bullish cycle for Bitcoin will be ready.
Absolutely on hash rate confirmation, every argument I've seen has been pretty convincing not so much for the piling of historic signals, but for the lack of opposing signals. I get that hash rate should be pure economics. You're mining because you can turn a profit. But I know for sure also that miners are at least partially sentiment: they'll switch it on at a loss now if they believe they can turn a profit down the line soon. That miners are also hedging in options (apparently) proves they're playing on sentiment. So I'm also confident your buy signal on this will trigger. Indeed, it's hard to counter-argue these hash rate based signals, and I'm 91% (11/12) confident the buy signal will trigger again even if it takes a month at a considerably lower price. Many don't like these signals because they feel hash rate follows price, but this seems irrelevant to me. Hash rate could easily be following price and making the decisive moves to either capitulate or making new ATHs. It's easier to identify the correlation between hash & price, rather than explore the "who is following who" rabbit hole. The point is, these sentimental miners affect the price of the market in the longer-term much more than we care to believe. We all know whales control the shorter-term movements, but in the longer run, a healthy growing network leads to long-term investments, a weakening network leads to less confidence. This much should be obvious and clear imo. I'm not sure miners are as sentimental as they used to be though, if they switch off at a loss and switch on for a profit, then this seems purely economical to me (emotions removed). The sentimental strategy would be to stay on at a loss, on the basis of personally investing into Bitcoin at "good prices", even though each coin would cost you more than the actual price. To me it seems like in the past, particularly around the second halving, miners were a lot more sentimental (hence weren't capitulating as much as they should have been) because of the "bigger picture". But in reality they could of just invested mining profits into Bitcoin at market price, rather than mining it for a premium lol. Miners are getting smarter, consistent and more reliable in this sense, from my perspective. |
|
|
|
|


