Bitcoin Forum
April 30, 2024, 06:59:29 PM *
News: Latest Bitcoin Core release: 27.0 [Torrent]
 
   Home   Help Search Login Register More  
Pages: « 1 [2] 3 »  All
  Print  
Author Topic: Dollar cost averaging Bitcoin - can we do better?  (Read 725 times)
Turbartuluk
Hero Member
*****
Online Online

Activity: 490
Merit: 1420


View Profile
April 02, 2024, 11:23:23 AM
Merited by virginorange (3), d5000 (2)
 #21

The problem is that if you base a model on a chart history which was partly influenced by external factors, you may get a distorted model.

I am not sure about that. Obviously there are external factors which influence the chart history, but the approach to exclude those factors from the model is not helpful to my mind, as those factors will also exist in the future and cant be forecasted.

Let us assume that i agree to the theory of "underperforming" 2021 bull run due to corona pandamic. With an "adopted peak" of 100k€ the price would have been ~1,5 above trend instead of ~1. It would than perfectly fit the trend line of previous peaks.


But what is the message out of it for future peaks? The "peak line" now pretends to predict the next peak more precisly, but that is just not true, as the "model" is still based on very few (=4) target points and other black swan events in both directions could occure at any time. Therefore it would be kind of missleading to my mind.

If there is one weakness in the analysis of @virginorange than it is including some sort of peak or bottom area instead of letting trend line speak for itself. While the trend line is build from thousands of data points (1D close prices) there are only a few peaks or bottoms and therefore much less statistical evidence for envelope lines. But obviously everbody wants to buy the bottom and sell the peak so that the readers focus is on those bottom and peak areas instead of trend line itself.


@virginorange: this might also be a mistake in the thought process regarding the cut-off points as the backtests for buy and sell might be dominated by a few bottoms / peaks.
Regarding your Backtest 2 that could exemplary mean:
1000 Days ahead -> sell 1 Peak
900 Days ahead -> sell 2 Peaks
800 Day ahead -> sell 4 Peaks -> 1st maximum
700/600 Days ahead -> sell 4 Peaks (less effective)
500 Days ahead -> sell 6 Peaks  -> 2nd maximum
in conclusion the prediction power of results would be very limited due to small amount of peaks....

1714503569
Hero Member
*
Offline Offline

Posts: 1714503569

View Profile Personal Message (Offline)

Ignore
1714503569
Reply with quote  #2

1714503569
Report to moderator
1714503569
Hero Member
*
Offline Offline

Posts: 1714503569

View Profile Personal Message (Offline)

Ignore
1714503569
Reply with quote  #2

1714503569
Report to moderator
Even if you use Bitcoin through Tor, the way transactions are handled by the network makes anonymity difficult to achieve. Do not expect your transactions to be anonymous unless you really know what you're doing.
Advertised sites are not endorsed by the Bitcoin Forum. They may be unsafe, untrustworthy, or illegal in your jurisdiction.
clone4502
Newbie
*
Offline Offline

Activity: 1
Merit: 0


View Profile
April 02, 2024, 03:27:19 PM
 #22

Excellent post. Thanks!
Have you ever compared dollar-cost averaging with value-averaging?
Value average appears to work better for volatile assets like crypto.
I used the strategy to accumulate XMR with surprising results.
It is a disciplined strategy that takes the guessing out of where asset prices are trending and has you buying more as asset prices decrease and less as asset prices rise.
 
d5000
Legendary
*
Offline Offline

Activity: 3892
Merit: 6134


Decentralization Maximalist


View Profile
April 02, 2024, 09:29:38 PM
Merited by virginorange (1)
 #23

But what is the message out of it for future peaks? The "peak line" now pretends to predict the next peak more precisly, but that is just not true, as the "model" is still based on very few (=4) target points and other black swan events in both directions could occure at any time. Therefore it would be kind of missleading to my mind.
Thank you for your calculations, I think you have a valid point here. And in general I think to simply outperform DCA for the next few years @virginorange's model in its pure form would work even if it was slightly distorted.

Taking external factors into account would mainly be useful for longer timeframes, but also could yield a slightly better performance in the mid term. But the longer a model seems to work although it is distorted, the bigger the risks that its predictions will be totally off for the next cycle.

We have already an example where a model which was based on the past price history and "seemed to work fine" for years but then failed because it was distorted: Stock to Flow. People who adopted risky strategies based on the original model which predicted a 2021 peak of well over 100.000$ will very likely have suffered big losses in the 2021-2022 bear. Virginorange's model is much, much better than S2F, but the "problem" that it is only based on price history remains.

The big question is of course: Is there a fundamental reason for the long term Bitcoin trend? If we assume the answer is "yes", like I wrote before assuming that the "grade of adoption" is the main factor here, then it would be useful to "isolate" this trend curve in some way. And then there is room to improve the model with such an "external effect factor". If however your answer is "no", which is also a valid assumption, then I'd go for the "pure" price history based model. Many traders/investors would disagree about this question, and that's totally fine.

█▀▀▀


█▄▄▄
▀▀▀▀▀▀▀▀▀▀▀
e
▄▄▄▄▄▄▄▄▄▄▄
█████████████
████████████▄███
██▐███████▄█████▀
█████████▄████▀
███▐████▄███▀
████▐██████▀
█████▀█████
███████████▄
████████████▄
██▄█████▀█████▄
▄█████████▀█████▀
███████████▀██▀
████▀█████████
▀▀▀▀▀▀▀▀▀▀▀▀▀▀▀▀▀▀▀▀▀
c.h.
▄▄▄▄▄▄▄▄▄▄▄▄▄▄▄▄▄▄▄▄▄
▀▀▀█


▄▄▄█
▄██████▄▄▄
█████████████▄▄
███████████████
███████████████
███████████████
███████████████
███░░█████████
███▌▐█████████
█████████████
███████████▀
██████████▀
████████▀
▀██▀▀
SilverCryptoBullet
Member
**
Offline Offline

Activity: 82
Merit: 38


View Profile
April 03, 2024, 02:09:07 AM
 #24

S2F model, DCA, Bitcoin Power Law and try to find bottom of market. If we apply all of these, we will  be very confusing with the market and no longer be able to apply DCA well.

Models are for every senior investors who have enough experience but with new investors, I can not understand models and DCA is my strategy.
Turbartuluk
Hero Member
*****
Online Online

Activity: 490
Merit: 1420


View Profile
April 03, 2024, 12:06:31 PM
 #25

Virginorange's model is much, much better than S2F, but the "problem" that it is only based on price history remains.

Taking external factors into account would not solve this "problem", because you have to quantify those factors based on historical experience. This approach in 2019 would not have had a pandamic on the bucket list, or at least not within the Top10 external factors. In 2020/21 it would have been Top1, but even if you are able to quantify it's influence for 2020/21, the next black swan event will not be a pandemic and the next pandemic will be different from the last one.

The big question is of course: Is there a fundamental reason for the long term Bitcoin trend?

To my mind that is not the question. Regarding that trendline, the likelihood that the relationship between Price and Date is caused by chance is close to zero. In other words: there must be some fundamental reasons.
The question is what are those reasons and how to quantify them? Is it possible at all to quantify those external factors as some of them an single events with major impact?
Building a model on price history is far from perfect, but at least it is a simplification we could reasonable prove right or wrong with "scientific" methodes. For me those models are like driving on the street, you need to take into account the latest data to adjust direction and stay on track. But even then a truck from the side street could slingshot you to a complete different direction. 
d5000
Legendary
*
Offline Offline

Activity: 3892
Merit: 6134


Decentralization Maximalist


View Profile
April 03, 2024, 08:34:37 PM
 #26

The big question is of course: Is there a fundamental reason for the long term Bitcoin trend?
To my mind that is not the question. Regarding that trendline, the likelihood that the relationship between Price and Date is caused by chance is close to zero. In other words: there must be some fundamental reasons.
I think I should have written: Is there a fundamental reason outside the price history itself?

The alternative would not be "chance", but that the growth's reason is related to the past price history. The price growth itself could have led to an increasing interest and thus cause a prolongation of the increasing trend (the "Bitcoin: I can get rich quick!" theory). But also the "I see there are bull-bear cycles of 4 years, thus I ride the waves" theory is such a "investment principle" without external influence which could have caused the long term trend.

On the other ("a fundamental reason exists outside of price history") side, aside from the simple "adoption" theory there could be also something like "static demand surplus combined with increasingly lower supply growth" like in S2F.

About more specific details of such a model I'll open a dedicated thread (as said per PM). The important thing for me is that you should be able to try several independent variables and test them empirically with a software tool. But such a model could not find the reason for every price movement, this would be too complex/next to imposssible. It's only meant to fine-tune a more general, price-history based model like virginorange's.

█▀▀▀


█▄▄▄
▀▀▀▀▀▀▀▀▀▀▀
e
▄▄▄▄▄▄▄▄▄▄▄
█████████████
████████████▄███
██▐███████▄█████▀
█████████▄████▀
███▐████▄███▀
████▐██████▀
█████▀█████
███████████▄
████████████▄
██▄█████▀█████▄
▄█████████▀█████▀
███████████▀██▀
████▀█████████
▀▀▀▀▀▀▀▀▀▀▀▀▀▀▀▀▀▀▀▀▀
c.h.
▄▄▄▄▄▄▄▄▄▄▄▄▄▄▄▄▄▄▄▄▄
▀▀▀█


▄▄▄█
▄██████▄▄▄
█████████████▄▄
███████████████
███████████████
███████████████
███████████████
███░░█████████
███▌▐█████████
█████████████
███████████▀
██████████▀
████████▀
▀██▀▀
el kaka22
Legendary
*
Offline Offline

Activity: 3500
Merit: 1162


www.Crypto.Games: Multiple coins, multiple games


View Profile
April 03, 2024, 11:45:03 PM
 #27

We practically can't. People failing at DCA as it is, they see it go down and instead of buying more they end up selling, hence makes it go down even more than that too, and it would not be something that could take a long time neither, should be alright. I believe that we need to learn to do DCA better and should be considering that as a normal thing as we can.

This is the most important thing, and as long as we keep doing this, it shouldn't really be living in a different kinds of world of it. I know that it is going to take a while, but we are going to get better at it with time as well, without a doubt. I hope that price will go up so that people wouldn't really end up with anything that will require any learning of it.

█████████████████████████
███████▄▄▀▀███▀▀▄▄███████
████████▄███▄████████
█████▄▄█▀▀███▀▀█▄▄█████
████▀▀██▀██████▀██▀▀████
████▄█████████████▄████
███████▀███████▀███████
████▀█████████████▀████
████▄▄██▄████▄██▄▄████
█████▀▀███▀▄████▀▀█████
████████▀███▀████████
███████▀▀▄▄███▄▄▀▀███████
█████████████████████████
.
 CRYPTOGAMES 
.
 Catch the winning spirit! 
█▄░▀███▌░▄
███▄░▀█░▐██▄
▀▀▀▀▀░░░▀▀▀▀▀
████▌░▐█████▀
████░░█████
███▌░▐███▀
███░░███
██▌░▐█▀
PROGRESSIVE
      JACKPOT      
██░░▄▄
▀▀░░████▄
▄▄▄▄██▀░░▄▄
░░░▀▀█░░▀██▄
███▄░░▀▄░█▀▀
█████░░█░░▄▄█
█████░░██████
█████░░█░░▀▀█
LOW HOUSE
         EDGE         
██▄
███░░░░░░░▄▄
█▀░░░░░░░████
█▄░░░░░░░░█▀
██▄░░░░░░▄█
███▄▄░░▄██▌
██████████
█████████▌
PREMIUM VIP
 MEMBERSHIP 
DICE   ROULETTE   BLACKJACK   KENO   MINESWEEPER   VIDEO POKER   PLINKO   SLOT   LOTTERY
OcTradism
Hero Member
*****
Offline Offline

Activity: 1722
Merit: 801


View Profile WWW
April 04, 2024, 02:41:29 AM
 #28

We practically can't. People failing at DCA as it is, they see it go down and instead of buying more they end up selling, hence makes it go down even more than that too, and it would not be something that could take a long time neither, should be alright. I believe that we need to learn to do DCA better and should be considering that as a normal thing as we can.
DCA is a famous investment strategy and it's more easily to talk about it than actually practice it with our money.

It's more easier to say that "I am planning to do DCA with Bitcoin" than actually spending money regularly to purchase Bitcoin. First barrier is our failure to assign our money for DCA. Second barrier is our failure to maintain our belief in Bitcoin and control our emotion and psychology in the volatile market.

DCA strategy is helpful to avoid effects from emotion and psychology but in practice, not all people can avoid fear when market is bad and do their DCA plan.

People who are fearful will need to look at Michael Saylor and MicroStrategy as example of DCA. They have been doing DCA since 2020 and they are winning big.

.
.Duelbits.
█▀▀▀▀▀


█▄▄▄▄▄
TRY OUR
  NEW  UNIQUE
GAMES!
.
..DICE...
███████████████████████████████
███▀▀                     ▀▀███
███    ▄▄▄▄         ▄▄▄▄    ███
███   ██████       ██████   ███
███   ▀████▀       ▀████▀   ███
███                         ███
███                         ███
███                         ███
███   ▄████▄       ▄████▄   ███
███   ██████       ██████   ███
███    ▀▀▀▀         ▀▀▀▀    ███
███▄▄                     ▄▄███
███████████████████████████████
.
.MINES.
███████████████████████████████
████████████████████████▄▀▄████
██████████████▀▄▄▄▀█████▄▀▄████
████████████▀ █████▄▀████ █████
██████████      █████▄▀▀▄██████
███████▀          ▀████████████
█████▀              ▀██████████
█████                ██████████
████▌                ▐█████████
█████                ██████████
██████▄            ▄███████████
████████▄▄      ▄▄█████████████
███████████████████████████████
.
.PLINKO.
███████████████████████████████
█████████▀▀▀       ▀▀▀█████████
██████▀  ▄▄███ ███      ▀██████
█████  ▄▀▀                █████
████  ▀                    ████
███                         ███
███                         ███
███                         ███
████                       ████
█████                     █████
██████▄                 ▄██████
█████████▄▄▄       ▄▄▄█████████
███████████████████████████████
10,000x
MULTIPLIER
NEARLY UP TO
.50%. REWARDS
▀▀▀▀▀█


▄▄▄▄▄█
virginorange (OP)
Full Member
***
Offline Offline

Activity: 230
Merit: 838


View Profile WWW
April 08, 2024, 03:03:24 PM
Last edit: April 08, 2024, 05:07:58 PM by virginorange
Merited by Turbartuluk (10)
 #29

[3. Entry Price vs. Trend graphic
-> regarding the cloud of blue dots it might be possible to separate dataset into 3-4 parts (coresponding full cycles) and use different colours for the dots and regression lines
-> maybe some trend will show up (regarding hight or incline)  

Thanks for your improvement proposals Tubabuluk, I will start with #3 and shine a bit more light on the cloud of blue dots.

TL;DR: Bitcoin is slightly overvalued, but it is still a good time to buy Bitcoin.


Predicting [1 year Bitcoin yield] depending on [the current cycle (measured in % overvaluation)]

x-axsis shows how much the historical Bitcoin price exceeded its trend (right = expensive, left = cheap).
y-axsis shows how the yield the following 12 months (high = Bitcoin gains vs. EUR, low = Bitcoin looses vs. EUR)


What do we learn?
1.) We can see that the red lines have a declining slope. You get better 1-year forward returns by buying bitcoin cheaply. This makes sense as the mean of the cycle reverses around the trend. It is still interesting to see this result on a time horizon of only 12 months, not 2 or 4 years. 1st orange arrow
2.) We can see that the red line (2010-2013) is the highest, the red line (2014-2017) is lower, the red line (2018-2021) is even slightly lower and the last line (2022-March 2023) is even lower. As time goes on, you can expect less return on your bitcoin investment for the same level of overvaluation relative to the trend. This makes sense as the price trend of bitcoin flattens out. 2nd orange arrow
3.) We can see the red lines crossing the x-axis at lower and lower values. 2nd orange arrow 2010-2013 we cross at 1.5, 2014-2021 at 0.6 and recently at 0. Buying relatively expensive bitcoin (trend +0 to trend +1.5) in 2010-2013 still gave you positive returns, recently buying only slightly expensive bitcoin gave you negative returns. 3rd blue arrow
4.) In our four charts we see 2 grey lines. We can see 2 different trend lines for each 4y cycle. One trend is on the way to the top. The second trend is on the way from the top to the bottom. Obviously you can get a better return the way up vs. on the way down. Unfortunately, it is only partly tradable:


Falling from the green peaks, we could assume that we are on the way down. Excessive overvaluation can be traded. At the yellow tops, however, we could have assume in real time that we were still climbing to a green top. Only in hindsight we would have realized we missed the yellow top. Since we can't tell the yellow tops in real time moderate overvaluation is not tradable.

Looking at our most recent dot plot, we can see that the red line crosses 0/0. Does only the cycle matter now? Bitcoin price trend growth is declining. Maybe it is declining much quicker than the cycle? Is trading the Bitcoin cycle more important than holding Bitcoin? The answer is no.


It is true that the yield from owning Bitcoin (red arrow) declines faster (from 1200% to 300%) than the yield from trading the cycle (blue arrow, 350% to 200% to 100%) and therefore the cycle matters relatively more. However the return from just holding Bitcoin is still much higher than the yield from timing the Bitcoin cycle. The main take away is: trading the cycle can juice your returns, but the most imposant decision is buying Bitcoin at all.

The red line crosses 0/0, not because the cycle dominates the returns, but because it represents a bear market. Therefore the line is naturally lower than a bull market line (see: what can we learn #4, the two grey lines).


Predicting [1 year change in Bitcoin cycle] depending on [the current cycle (measured in % overvaluation)]

x-axsis shows how much the historical Bitcoin price exceeded its trend (right = expensive, left = cheap).
y-axsis shows how the yield the following 12 months (positive = Bitcoin price growth exceeds trend, negative = Bitcoin price growth is slower than trend)


What do we learn?
1.) We see a clear mean reversion in the Bitcoin trend with the dot-plots now sitting crossing 0/0 on average. Cyclically cheap Bitcoin becomes more expensive after 12 months. Cyclically expensive Bitcoin becomes cheaper after 12 months.
2.) I marked the area of 1 below trend (e-1 = 0,37*trend = 63% below trend) in orange. The last time we touched the orange area was in 2010 (red box). This information is slightly usefull to project future returns and future drawdowns.


What does the dotplot tell us about the current Bitcoin market?


Bitcoin (currently at 64.500€) vs. trend (currently at 60.500€) is slightly overvalued. The slight overvaluation is represented by the green line at x>0. We didn't go below -1 (currently at 22.250€) since 2010. So a drawdown to less than 22.500€ is reasonably unlikely (<8%). If we get a severe drawdown, I would expect a price of -0.8 (currently at 27.000€).


What kind of valuation would be realistic 12 months from now?


The orange trend line shows for a given historical bitcoin valuation: "How did the Bitcoin price change after 12 months during the last bull market?"
The red trend line shows, for a given historical bitcoin valuation: "How did the bitcoin price change after 12 months during the last bear market?"
The green line shows the current valuation of bitcoin.

Price projection for a bull market (probability = 50%):
The intersection of orange and green is +0,6. Bitcoin is now at trend+0,065. So during a bull market, I would expect Bitocoin to go to trend+0,665. Trend in one year will rise to 87.700€. Trend+0,665 will be at 170.000€. This would be roughly in line with our previous result for taking profits at trend+750 days (175.000€).

Price projection for a bear market (probability = 42%):
The intersection of orange and green is -0,6. Bitcoin is now at trend+0,065. So during a bear market, I would expect Bitocoin to go to trend-0,535. Trend in one year will rise to 87.700€. Trend-0,535 will be at 51.000€. This would be roughly in line with our previous result for going all in trend-0,5 (53.000€).

Price projection for model break (probability = 8%):
If my model breaks, I would assume Bitcoin to be at trend-2 (12.000€).

Expected value of Bitcoin in one year = 8%*12k + 42%*53k + 50%*174k = 110k.

Sounds too good to be true. The relationship between bitcoin's overvaluation and the expected return (orange line) from the past bull market is probably a bit optimistic, as the trend and cycle flatten over time. However, as long as bitcoin continues to get adopted, the strong growth in the trend price makes investing in bitcoin still very attractive. However, we should not take it for granted that we are now in a bull market:


Maybe we are on the way to a new green top. Maybe we just get a yellow top and a big contraction until we get to the next green top. Don't invest more than you can stomach during a drawdown.


Predicting [1 year Bitcoin yield] depending on [the current cycle (measured in days overvaluation)]

x-axsis shows how much the historical Bitcoin price exceeded its trend measured in days (right = expensive, left = cheap).
y-axsis shows how the yield the following 12 months (high = Bitcoin gains vs. EUR, low = Bitcoin looses vs. EUR)


I think 2020 (black line) is too optimisitc, since we were heading out of Corona with a massive monetary stimulus and the trend line tends to go down anyway each cycle.
I think 2022 (yellow line) is too pessimistic. Maybe 2019 is reasonable (red line). Here we would expect a yield of e^0,2 which is 22%.

This price prediction +22% (days overvaluation and 2019 scenario) is less optimistic than my previous prediction >+50% (expected value, % overvaluation).

In both calculations however it pays out to buy Bitcoin now, since the expected return of Bitcoin exceeds my cost of capital (around 6-10%). It is not too late to buy Bitcoin yet.

When would the expected return on Bitcoin over the next 12 months fall below my cost of capital?
When the Bitcoin price exceeds trend+106 days (currently $68k, at 10% cost of capital) or trend+127 days (currently $70k, at 6% cost of capital), buying Bitcoin on a 12-month time horizon would no longer make sense. However, it could still make sense to buy Bitcoin on a shorter time horizon (selling into the bubble) or on a longer time horizon (riding the adoption trend).

In general, I would stick to my overvaluation threshold of trend+750 days. However, I would scale back by buying at trend+150 days to buy more Bitcoin at e^-1*trend.

Sicherheit für deine Familie, dich und deine BTC, dank der fundierten Sicherheits-Tipps der KryptoArche. Wir kaufen Bitcoin zum Vermögensaufbau oder zur Krisenvorsorge. Wir kaufen Bitcoin dezentral als Schutz vor Räubern, mit guter Historie und verwahren unsere Bitcoin sicher vor Verlust, Räubern und Dieben sowie versteckt Wir nutzen sichere Passwörter, BetriebssystemeSoftware und sufen sicher. Sicher dir deinen kostenlosen Platz auf der KryptoArche! Die Zeit läuft ab! Steig ein, bevor es zu spät ist! Gemeinsam bleiben wir immer über Wasser!
virginorange (OP)
Full Member
***
Offline Offline

Activity: 230
Merit: 838


View Profile WWW
April 08, 2024, 06:50:27 PM
Last edit: April 09, 2024, 01:14:59 PM by virginorange
 #30

1. Formula y = 5,8323x - 39,296
-> I guess you have done some kind of logarithmic Regression like Trolololo did it once
-> therefore i guess the formula will be outdated with the years going and it would be helpful to reference the way of calculations

You are correct, as new data points arrive the formula will see minor changes.

The formula is created with a simple least squares linear regression in excel. y = ln(Bitcoinprice_in_EUR) and x = ln(number of days since the Bitcoin genesis block) = ln(Date - 03 Jan 2009).

We will see a new change in trend quite late, since most of the old data still supports the trend. Therefore we have to check the trend for the new data only, which I did in "
Checking the stability of the bitcoin trend line" in my initial post. Ultimately we will see a weaker trend as adoption finalises

2. "Cyclical Component of Bitcoin price" graphics
-> due to logarithmic timeline it's somehow difficult to assign the peaks/years
-> maybe vertical halving-lines or labeling the peaks with year count could help as a guideline

Thanks for your feedback. I added one more chart to my initial post to translate our ln-values into values we can understand.

Making the graphs easier to follow
A Bitcoin price in ln(EUR) and a Bitcoin age in ln(days) is easy to draw, but difficult to understand. Therefore I added the Bitcoin price in EUR and the calendar year.


Sicherheit für deine Familie, dich und deine BTC, dank der fundierten Sicherheits-Tipps der KryptoArche. Wir kaufen Bitcoin zum Vermögensaufbau oder zur Krisenvorsorge. Wir kaufen Bitcoin dezentral als Schutz vor Räubern, mit guter Historie und verwahren unsere Bitcoin sicher vor Verlust, Räubern und Dieben sowie versteckt Wir nutzen sichere Passwörter, BetriebssystemeSoftware und sufen sicher. Sicher dir deinen kostenlosen Platz auf der KryptoArche! Die Zeit läuft ab! Steig ein, bevor es zu spät ist! Gemeinsam bleiben wir immer über Wasser!
Turbartuluk
Hero Member
*****
Online Online

Activity: 490
Merit: 1420


View Profile
April 09, 2024, 10:17:04 AM
Last edit: April 09, 2024, 01:51:58 PM by Turbartuluk
Merited by virginorange (7), d5000 (2)
 #31

Thank you very much for digging even deeper. It takes me some time to assume the scope of results.

As i have a slightly different interpretation of past data, i will share what i do see on those pictures starting with the latest data (last 4 years):


Black line: First of all you can see clearly some sort of cycle within the last 4 years, with the direction shown in the graphic
Red 1: Bought in Corona Dip 2020, sold in 1st Peak 2021, i expect this area to be outliers which will not repeat
Red 2: Bought after Bottom 10k+, sold in 2nd Peak 2021
Red 3: Bought in 1st Peak 2021, sold 1 year after
Red 4: Bought in 2nd Peak 2021, sold 1 year after
Red 5: Bought 1y+ before now, latest data
Green X: possible cycle position right now, 1y ahead of latest dots  

If cycle repeats (big if) and Green X is assumed correctly you could draw following conclusions from that:
  • there are only shown buying points 1y+ in the past, with time passing new dark yellow dots will occure, they might occure in direction from Red 5 to Red 1. This would mean, that BTC bought <1y in the past from now will show hightest increase -> Peak can be assumed within the next year.  
  • BTC bought today and sold 1y from now could be slightly after the peak, not optimal but still in good profit
  • starting DCA BTC for the next 6-12 month and selling 1y after (18-24M from now) seems to be a bad idea, in conclusion it could be a good idea to execute a withdrawal plan during that time, but be aware of ln-price scale -> choose a backloaded layout for DCA
  • roughly ln-price +0,5 above price trend (i guess we will see that in a few months from now) you enter bubble territory, buying BTC and selling 1y after could result in massive losses, you could use that prediction for hedge or short strategies
  • for identifiing peak you could use 2 different indicators: BTC change ln-price +1 (~250% within 1year) which equals red 2 or ln-price +0,5-1 above trend which equals red 3/4


Now here is why i don't believe Green X to be assumed correcly:

Predicting [1 year Bitcoin yield] depending on [the current cycle (measured in % overvaluation)]

x-axsis shows how much the historical Bitcoin price exceeded its trend (right = expensive, left = cheap).
y-axsis shows how the yield the following 12 months (high = Bitcoin gains vs. EUR, low = Bitcoin looses vs. EUR)


If you focus on the red lines on those 4 pictures described by y=a*x+b you can see a decreasing trend for incline a and offset b.
Additionaly the clouds of dots are more and more concentrated in the center.

Regarding all 3 trends together i would rather not expect a "clear" elliptic cycle but more some sort of twisted elliptical spiral, slipped from the center.


Idea: We could plot all years from 2010-2023 into 1 high resolution graphic, while having 1 colour each year. For each year the center of gravity could be calculated, to draw a spline through those coordinates. (You could calculate coordinates with excel, i could draw spline with CAD tools)
I would be curious if this spline results in a picture like the Bitcoin Spiral  Cheesy

Maybe this could be even used somehow for cut-offs?!  Cool

PS: please lets stay with ln price model instead of days ahead model, i guess it will make things easier to compare bull and bear in the same graphic.
bettercrypto
Sr. Member
****
Offline Offline

Activity: 1316
Merit: 268


★Bitvest.io★ Play Plinko or Invest!


View Profile WWW
April 09, 2024, 02:00:46 PM
 #32

Now all of us who believe in Bitcoin or cryptocurrency know that it will make a great contribution to our investors who believe in Bitcoin or cryptocurrency. And even now,
there are many communities that use and believe in the DCA method; that's just, honestly speaking.

So thank you very much to Op, and he made that matter to be shared here in this forum section for the awareness of all the members here on this platform.


BIG WINNER!
[15.00000000 BTC]


▄████████████████████▄
██████████████████████
██████████▀▀██████████
█████████░░░░█████████
██████████▄▄██████████
███████▀▀████▀▀███████
██████░░░░██░░░░██████
███████▄▄████▄▄███████
████▀▀████▀▀████▀▀████
███░░░░██░░░░██░░░░███
████▄▄████▄▄████▄▄████
██████████████████████
▀████████████████████▀
▄████████████████████▄
██████████████████████
█████▀▀█▀▀▀▀▀▀██▀▀████
█████░░░░░░░░░░░░░▄███
█████░░░░░░░░░░░░▄████
█████░░▄███▄░░░░██████
█████▄▄███▀░░░░▄██████
█████████░░░░░░███████
████████░░░░░░░███████
███████░░░░░░░░███████
███████▄▄▄▄▄▄▄▄███████
██████████████████████
▀████████████████████▀
▄████████████████████▄
███████████████▀▀▀▀▀▀▀
███████████▀▀▄▄█░░░░░█
█████████▀░░█████░░░░█
███████▀░░░░░████▀░░░▀
██████░░░░░░░░▀▄▄█████
█████░▄░░░░░▄██████▀▀█
████░████▄░███████░░░░
███░█████░█████████░░█
███░░░▀█░██████████░░█
███░░░░░░████▀▀██▀░░░░
███░░░░░░███░░░░░░░░░░
▀██░▄▄▄▄░████▄▄██▄░░░░
▄████████████▀▀▀▀▀▀▀██▄
█████████████░█▀▀▀█░███
██████████▀▀░█▀░░░▀█░▀▀
███████▀░▄▄█░█░░░░░█░█▄
████▀░▄▄████░▀█░░░█▀░██
███░▄████▀▀░▄░▀█░█▀░▄░▀
█▀░███▀▀▀░░███░▀█▀░███░
▀░███▀░░░░░████▄░▄████░
░███▀░░░░░░░█████████░░
░███░░░░░░░░░███████░░░
███▀░██░░░░░░▀░▄▄▄░▀░░░
███░██████▄▄░▄█████▄░▄▄
▀██░████████░███████░█▀
▄████████████████████▄
████████▀▀░░░▀▀███████
███▀▀░░░░░▄▄▄░░░░▀▀▀██
██░▀▀▄▄░░░▀▀▀░░░▄▄▀▀██
██░▄▄░░▀▀▄▄░▄▄▀▀░░░░██
██░▀▀░░░░░░█░░░░░██░██
██░░░▄▄░░░░█░██░░░░░██
██░░░▀▀░░░░█░░░░░░░░██
██░░░░░▄▄░░█░░░░░██░██
██▄░░░░▀▀░░█░██░░░░░██
█████▄▄░░░░█░░░░▄▄████
█████████▄▄█▄▄████████
▀████████████████████▀


Rainbot
Daily Quests
Faucet
virginorange (OP)
Full Member
***
Offline Offline

Activity: 230
Merit: 838


View Profile WWW
April 09, 2024, 07:20:36 PM
Merited by Turbartuluk (3), d5000 (2)
 #33

TL;DR: With a time horizon of 9-12 months I expect Bitcoin's trend price growth to continue (95% probability) plus a cyclical price expansion on top (80% probability). If you want to buy Bitcoin anyway, my model would suggest you don't wait. If you want to sell Bitcoin anyway, my model would suggest you to wait at least a couple of months.* Please consider models can be wrong.

*Obviously not finical advise. Only a profession certified advisor can judge your personal situation. He might find a long term bank deposit yielding treasury yield - 200 basis points more suitable to you. Especially considering the excellent long term fiscal situation in the US.

Question: Why did Bitcoin perform so well in summer 2019?

Idea: We could plot all years from 2010-2023 into 1 high resolution graphic, while having 1 colour each year.


For each year the center of gravity could be calculated, to draw a spline through those coordinates. (You could calculate coordinates with excel, i could draw spline with CAD tools)
I would be curious if this spline results in a picture like the Bitcoin Spiral  Cheesy


The center of gravity looks a bit unordely. Therefore I put only a couple of years into each chart:


We can see circles (= cycles of overvaluation and undervaluation) becoming smaller (= volatility declining as times goes on) and moving down (price trend growth is slowing down).

To make our picture more clear, we can adjust for the "moving down" of our circles. Instead of an y-axis showing the [ln-yield of being invested into Bitcoin for 12 months] we can plot on the y-axis the [over or undervaluation vs. trend in 12 months]. Here we should circle around 0/0.


Looks unorderly. So let's go year by year:


2010 and H1-2011 we were just getting started. Our cycle was spinning in the opposite direction (red arrow).
In H2-2011 we started spinning in the usual direction.


H2-2011 to 2014 we kept spinning a full circle.


Until 2017 we keppt spinning an extra 1/2 circle. However this 2nd circle was smaller, which means lower excess valuation and lower volatility.


2018 and 2019 were unusual years. Generally we would expect our cycle to keep spinning (after the green arrow we should continue with the yellow arrow).
However 2018 we saw an unusual high. And 2019 we made a smaller circle.


2018 we saw an unusual 12m-performance, due to an unusual 2019 hight, which was between two cycle tops (2017 and 2021).


Our 2019 anomaly was the highest top, within our small (yellow) tops.


The confused behavior in 2019 is down to covid 19.


After 2020 our spinning looks more regular again:


Lessons:
We spin clockwise, with the exception of 2010 to H1-2021, but we have some disturbances (2018). Therefore it is more than 50% probable (my guess 80%) we continue to spin clockwise for the near future. The 20% probability for a disturbance would be some kind of macroeconomic shock, which is unlikely before the US-election.


The last full data point (average of 100 days until 31st March 2023) with historical valuation data and 12m-forward return is market as black X.

Today we are somewhere at the red line, since we now the current overvaluation, but we don't know the 12 month forward return 9th of April 2024 - 9th of April 2025.

We also can be pretty sure we keep spinning, not only because we kept spinning in the past, but also given the Bitcoin price performance in the last 12 months the yellow arrow looks likely.

We can also assume the current circle is smaller than the last circle (probably we will be below the 2021 line). My weak best guess would be, after a current overvaluation of 0,1 we will go to an overvaluation of 0,4 in 12 months. I'm a bit more confident (80%) that we will have a higher overvaluation in 12 months than now. Theas means we can earn Bitcoins trend price growth plus a cyclical price expansion. Please be aware, that we are dealing with 100 day averages here, so today + 256 to today + 356 days.

Sicherheit für deine Familie, dich und deine BTC, dank der fundierten Sicherheits-Tipps der KryptoArche. Wir kaufen Bitcoin zum Vermögensaufbau oder zur Krisenvorsorge. Wir kaufen Bitcoin dezentral als Schutz vor Räubern, mit guter Historie und verwahren unsere Bitcoin sicher vor Verlust, Räubern und Dieben sowie versteckt Wir nutzen sichere Passwörter, BetriebssystemeSoftware und sufen sicher. Sicher dir deinen kostenlosen Platz auf der KryptoArche! Die Zeit läuft ab! Steig ein, bevor es zu spät ist! Gemeinsam bleiben wir immer über Wasser!
Turbartuluk
Hero Member
*****
Online Online

Activity: 490
Merit: 1420


View Profile
April 12, 2024, 06:41:19 AM
Last edit: April 12, 2024, 08:21:36 AM by Turbartuluk
 #34

Question: Why did Bitcoin perform so well in summer 2019?

Good question. That might be something @d5000 could help us to find an answer.

We can see circles (= cycles of overvaluation and undervaluation) becoming smaller (= volatility declining as times goes on) and moving down (price trend growth is slowing down).

Good idea to use SMA100 for drawing lines. I guess we could even go up to SMA200 for some more smoothing of lines. Maybe shrinkage of circles would then be clearer (=more pedictable?)

Regarding the "moving down" this should correspond to moving down of trendline. I asked myself if Center from past cycles would be around 0/0 if you also take a past cycle trendline (not including the latest price data for Regression of Trend line).
This could mean that a Trend towards -0,5 or -1 from current trendline would be plausible...

We can also assume the current circle is smaller than the last circle (probably we will be below the 2021 line). My weak best guess would be, after a current overvaluation of 0,1 we will go to an overvaluation of 0,4 in 12 months. I'm a bit more confident (80%) that we will have a higher overvaluation in 12 months than now. Theas means we can earn Bitcoins trend price growth plus a cyclical price expansion. Please be aware, that we are dealing with 100 day averages here, so today + 256 to today + 356 days.

Regarding the graphics i am a little more optimistic. I guess i would set up my sell area rougly 0,5-0,75 above Trend (maybe in combination with price +200-250% within 1y).
To translate that into prices: Trend line will be at 80k€ by the end of 2024.
e^0,4 above would mean ~120k€/130k$
e^0,5-0,75 above would mean ~130-170k€/145-190k$

 
Regarding the avarages i guess you mean today +365-465 days?!
What do you think about using Monte-Carlo price simulation in Excel to close that gap and find a more precise X-Position for today?!
virginorange (OP)
Full Member
***
Offline Offline

Activity: 230
Merit: 838


View Profile WWW
April 12, 2024, 01:33:18 PM
 #35

Regarding the graphics i am a little more optimistic. I guess i would set up my sell area rougly 0,5-0,75 above Trend (maybe in combination with price +200-250% within 1y).
To translate that into prices: Trend line will be at 80k€ by the end of 2024.
e^0,4 above would mean ~120k€/130k$
e^0,5-0,75 above would mean ~130-170k€/145-190k$


I agree, the model suggest trend at 80k€ at the end of 2024.
My personal definition for "good time to sell" is a Bitcoinprice 750 days ahead of trend, which would be at 160k€ by then. A valuation of 200k€ would be pretty stretched. Those € values are roughly in line with your sell area.

A good time to sell depends on the date:

Here is a chart with the values for the 1st of each month:

lower bound = trend * e^-1
good time to buy = trend * e^-0.5
good time to sell = trend + 750 days
top likely in = trend + 1000 days


Please be aware, if you extrapolate multiple years into the future, it becomes more likely for the model to break down.


Regarding the avarages i guess you mean today +365-465 days?!
What do you think about using Monte-Carlo price simulation in Excel to close that gap and find a more precise X-Position for today?!

The yield is measured from today + 365 days, however for the purpose of smoothing we average over the last 100 days. As a results our circly charts show the average yield of [today vs. today+365 days], [today - 1 day vs. today+364 days], .... , [today - 99 days vs. today+266 days].

Sicherheit für deine Familie, dich und deine BTC, dank der fundierten Sicherheits-Tipps der KryptoArche. Wir kaufen Bitcoin zum Vermögensaufbau oder zur Krisenvorsorge. Wir kaufen Bitcoin dezentral als Schutz vor Räubern, mit guter Historie und verwahren unsere Bitcoin sicher vor Verlust, Räubern und Dieben sowie versteckt Wir nutzen sichere Passwörter, BetriebssystemeSoftware und sufen sicher. Sicher dir deinen kostenlosen Platz auf der KryptoArche! Die Zeit läuft ab! Steig ein, bevor es zu spät ist! Gemeinsam bleiben wir immer über Wasser!
virginorange (OP)
Full Member
***
Offline Offline

Activity: 230
Merit: 838


View Profile WWW
April 14, 2024, 02:57:29 PM
 #36

TL;DR: Best to buy Bitcoin cheap and with low volatility. If Bitcoin becomes cheap in the future, but has high and rising volatility, despite low volatility in other asset classes, we might reconsider using our model.

Our currently useful model ...
Our model suggest we can outperform simple DCA, if ...
(i) we become more cautious, if the Bitcoin becomes expensive (price exceeds Trend +750 days),
(ii) we take a full position, if Bitcoin becomes cheap (price = Trend * e^-1)
(iii) and otherwise simple DCA into Bitcoin.

... should not mislead us down the road.
If we decide how much Bitcoin we buy or own based on this model, we should be reasonable confident, that our model continues to be correct. Every financial model will eventually break, therefore we should not follow our model blindly. There would be little pain for us, if Bitcoin price is outperforming our pretty optimistic model. Therefore we should be especially careful on the downside, if we suspect our model is breaking towards the downside.

Hints, that our model is breaking towards the downside:
a) Since 2011 the Bitcoin price never declined blow Trend*e^-1, falling below Trend*e^-1 or even Trend*e^-1.2 would a sign that our model is breaking.
b) Another sign could be unusually high Bitcoin price volatility. So what kind of volatility would be unusual for Bitcoin?


Initially the Bitcoin price was pretty volatile (2011-2014). In general Bitcoin becomes less volatile as time goes on.


If you plot the Bitcoin price vs. Trend (x-axis) vs. the volatility (y-axis) you notice that Bitcoin is more volatile in the bull market than in a bear market.


This is extremely unusual. All the other asset classes I know of, are more volatile, when they are cheaper. Let's take a look at the S&P 500 price index.


The blue line shows us the S&P 500 price index. The orange line shows us the S&P 500 price index adjusted for USD-M2 growth. The orange dotted line gives us the S&P trend growth. If the S&P (orange line) is below its trend (orange dotted line), then the stocks are cheap. If the S&P is above trend, stocks are expensive.

The main long term price driver for the S&P 500 (but also for example gold) is M2-inflation. Adjusting for M2 gives us a flat trend for the S&P 500.


If we plot the S&P vs. trend against its volatility, we can see that expensive S&P has low volatility (green box). We only see high volatility for cheap S&P (red box). We can also see that very cheap S&P doesn't come with low volatility (purple triangle).

But Bitcoin is different. For Bitcoin the combination of cheap and low volatiltiy is pretty common.


However we can see that different cycles have different volatility levels.


Lets plot our volatility after 2015.


The grey lines is our volatility calculated over the daily returns over the previous 30 days. The yellow line is the 90 days volatility. To take out the noise I only displayed the volatility lines, if Bitcoin was cheap (Trend * e^-0.5 or blow). We can see that volatility is generally below 0,06 (30d) and below 0.05 (90d). The only exception is COVID 19 with high volatility in all markets.

In the next bear market I would expect the Bitcoin's volatility to reamin below the dotted lines. A higher Bitcoin volatility I would only expect during times of weder market turmoil (like during COVID 19). The model would risk breaking down, if Bitcoin is cheap, but the volatility is high.

Our last bear market was perfect. Bitcoin was cheap, volatility was low, volatility was declining. A very nice setup in hindsight.


Over several cycles we can observe a declining volatility during bear markets. We enter the bear market with high volatility and leave the bear market with low volatility.

If we had planed to time the market, we could have waited for volatility to come down, before taking our full Bitcoin position. This would have worked every time except COVID 19.

Result: A low volatility during the bear market gives us additional confidence to invest into cheap Bitcoin. 

Sicherheit für deine Familie, dich und deine BTC, dank der fundierten Sicherheits-Tipps der KryptoArche. Wir kaufen Bitcoin zum Vermögensaufbau oder zur Krisenvorsorge. Wir kaufen Bitcoin dezentral als Schutz vor Räubern, mit guter Historie und verwahren unsere Bitcoin sicher vor Verlust, Räubern und Dieben sowie versteckt Wir nutzen sichere Passwörter, BetriebssystemeSoftware und sufen sicher. Sicher dir deinen kostenlosen Platz auf der KryptoArche! Die Zeit läuft ab! Steig ein, bevor es zu spät ist! Gemeinsam bleiben wir immer über Wasser!
virginorange (OP)
Full Member
***
Offline Offline

Activity: 230
Merit: 838


View Profile WWW
April 16, 2024, 06:54:49 AM
Merited by d5000 (3)
 #37

TL;DR I develop a warning sign, to warn me about my Bitcoin price model is breaking towards the downside during a bear market

Input: Bitcoin price ( [valuation vs. trend] and [volatility multiple vs. S&P 500])

Output: Traffic light
    red = urgently check, if the Bitcoin price model is still valid
    yellow = keep attention on the traffic light,
    green = no problem with Bitcoin price model detected

Why do we use our traffic light? Risk management, time savings, control of emotions
A significant Bitcoin exposure as a % of net worth requires risk management tools. The tools should quickly indicate, if my Bitcoin portfolio allocation is developing according to expectations or I have to update my assumption, my model and possibly my allocation.

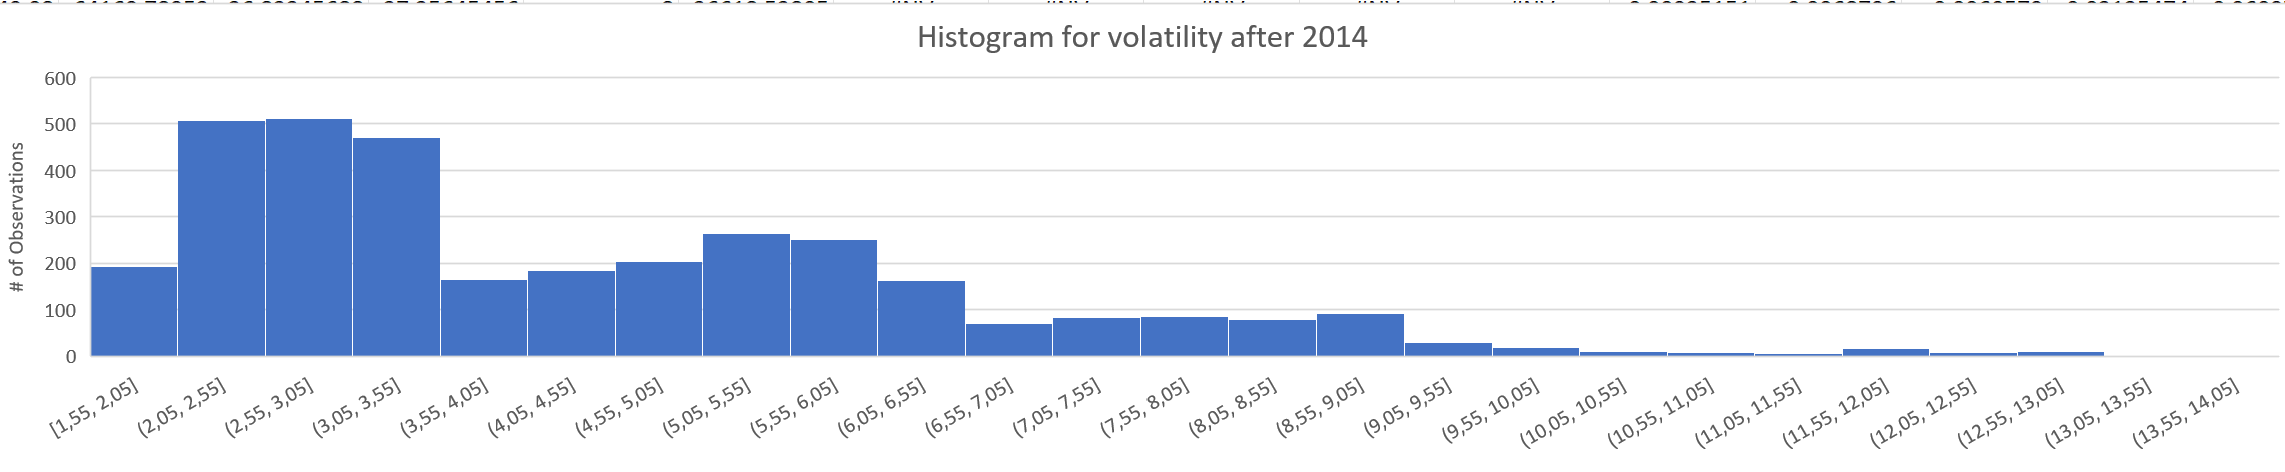
High volatility in Bitcoin in combination with low valuation could indicate mayor negative news. High Bitcoin volatility during times of high general market volatility (COVID 19) doesn't indicate Bitcoin specific problems. However if Bitcoin's is very volatile while other markets are calm, this could indicate problems influencing our Bitcoin price model. Therefore we calculate the multiple of Bitcoins volatility over the S&P 500 volatility (90 days).


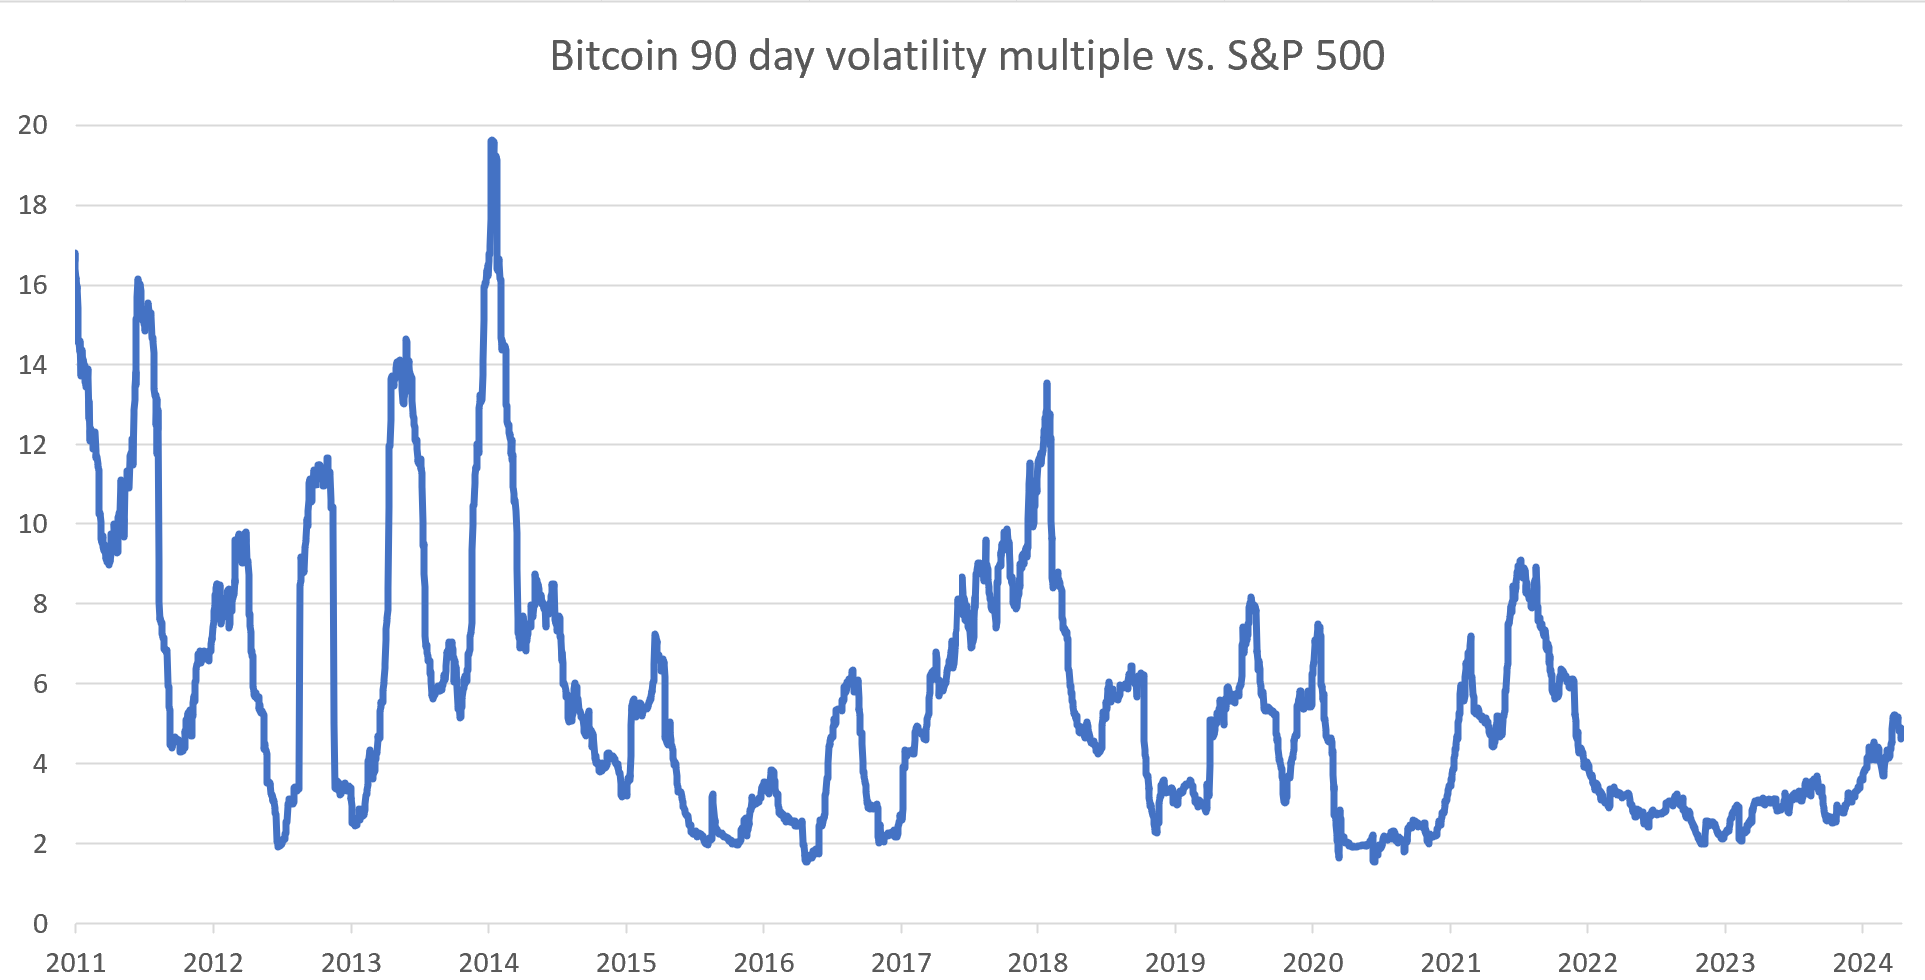
We can see Bitcoin's excess volatility is declining as time goes on.

If we plot Bitcoin's [excess volatility vs. stocks] vs. [Bitcoin's valuation vs. trend] ...


... we notice that high Bitcoin valuations are associated with higher volatility, while low Bitcoin valuations are often associated with low volatility. This trend relationship is even clearer, if we only plot data after 2014:


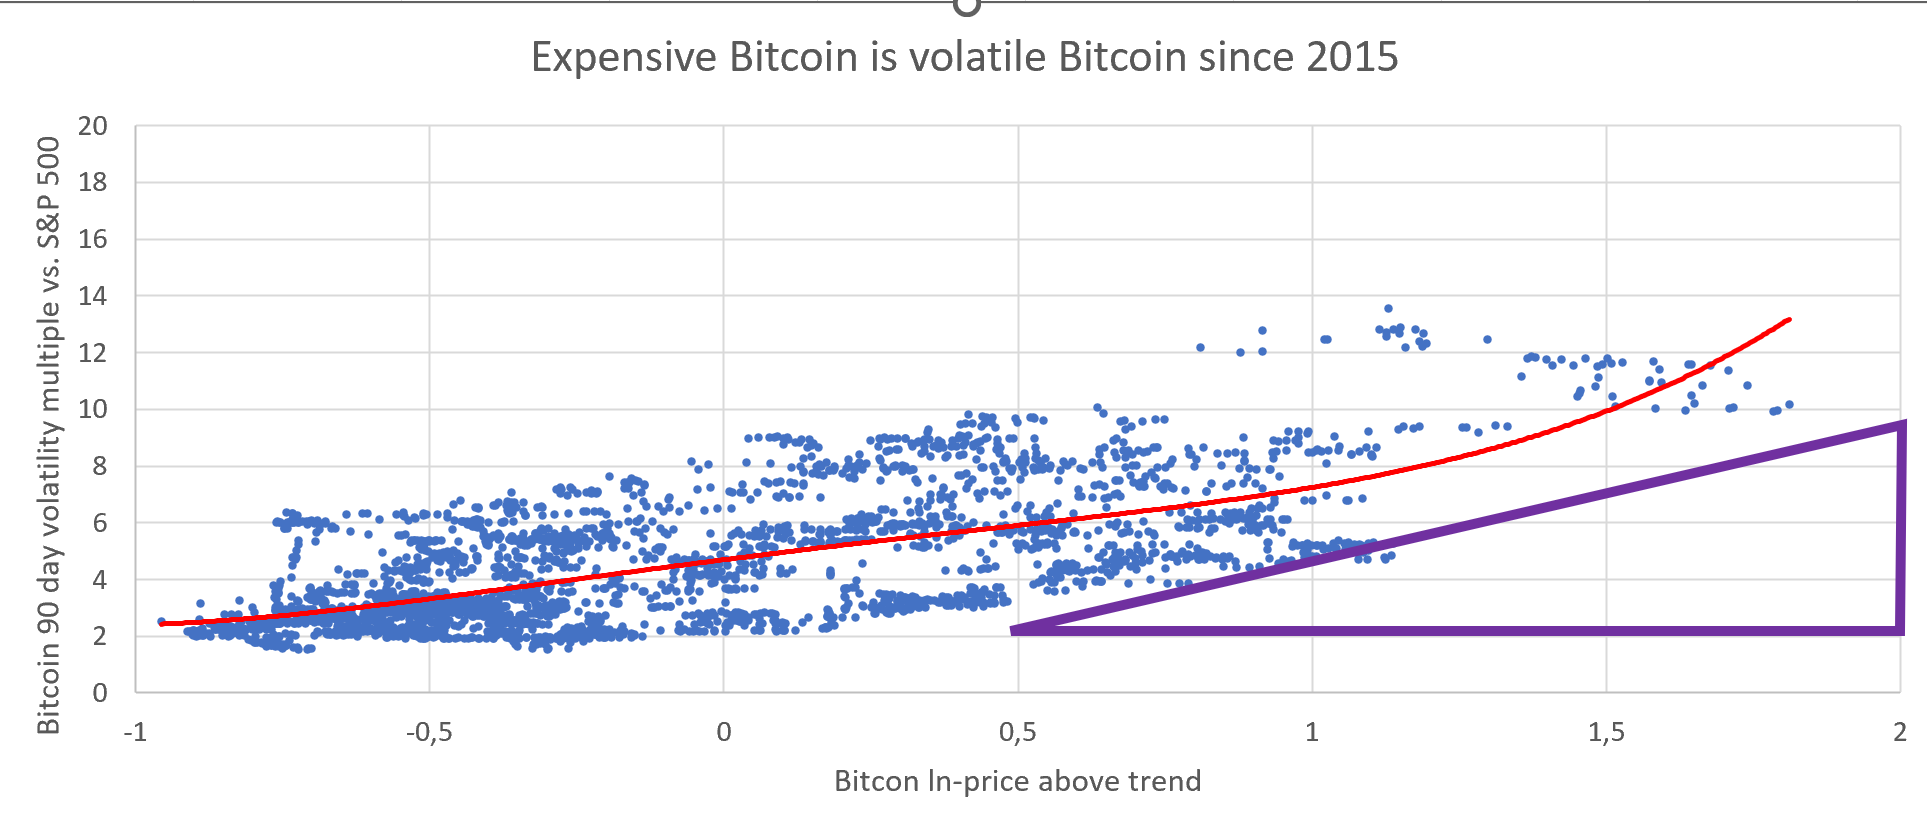
The higher Bitcoin's valuation the higher the volatility. The positive relationship between valuation and volatility is uncommon for other asset classes. Usually low valuations are associated with higher volatility (bond spreads or shares).

If we look at the S&P 500 (blue line), and adjust the S&P 500 by M2-money inflation (orange line), we can separate the cyclical S&P performance (orange line minus orange dotted line) from the trend performance (orange dotted line).


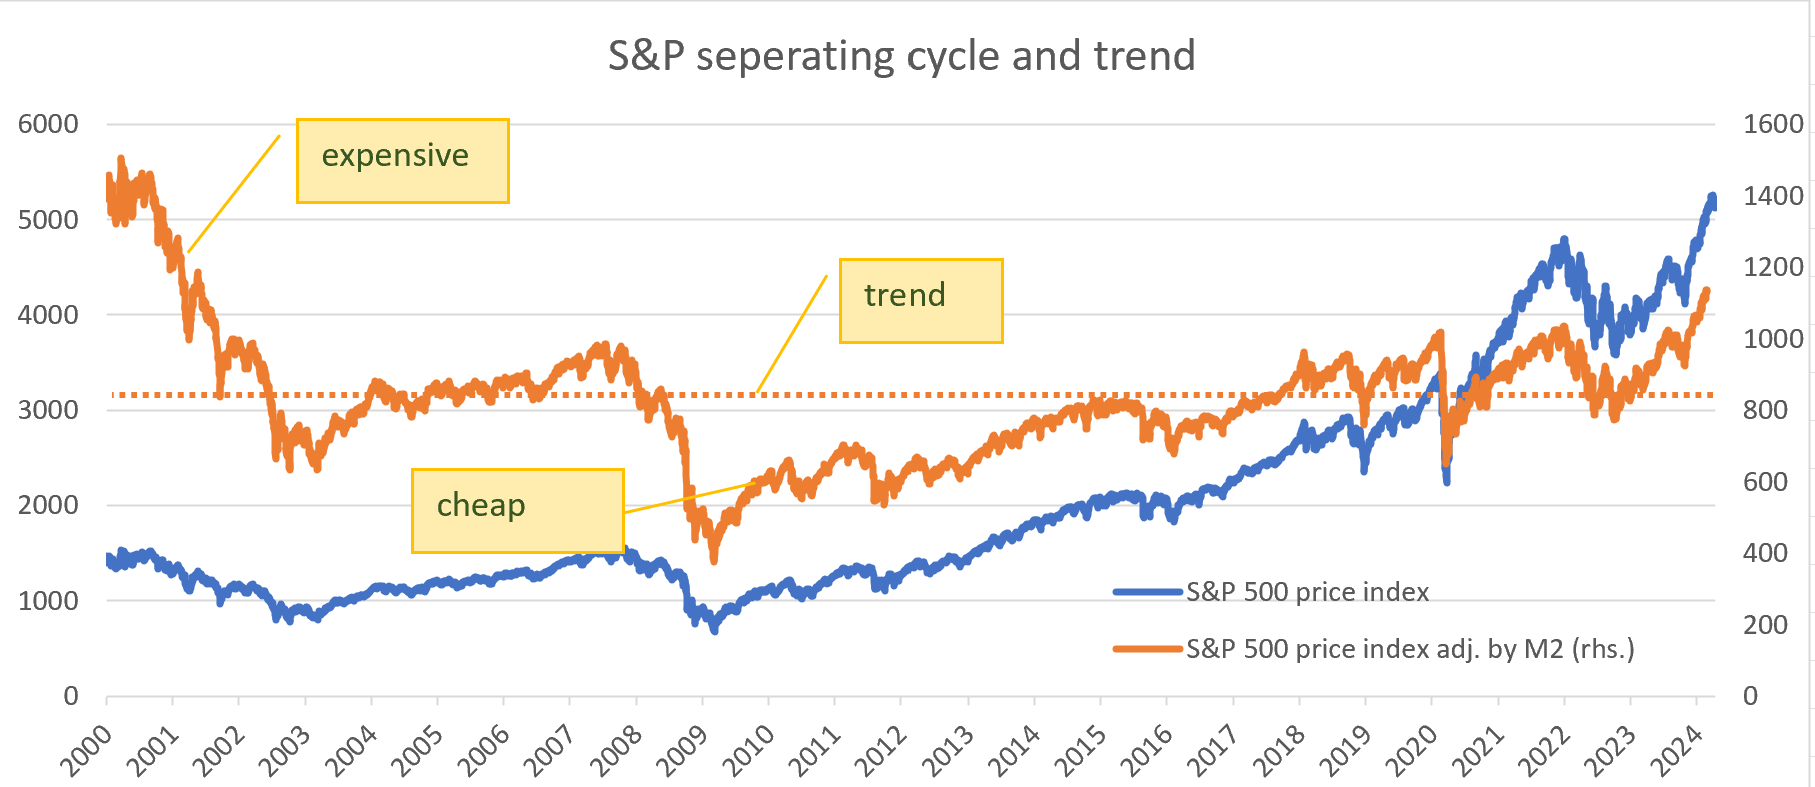
Interestingly the S&P has 0 trend growth exceeding M2-inflation. The S&P was expensive 2000-2002 and cheap 2009 - 2014. If we plot S&Ps volatility ...


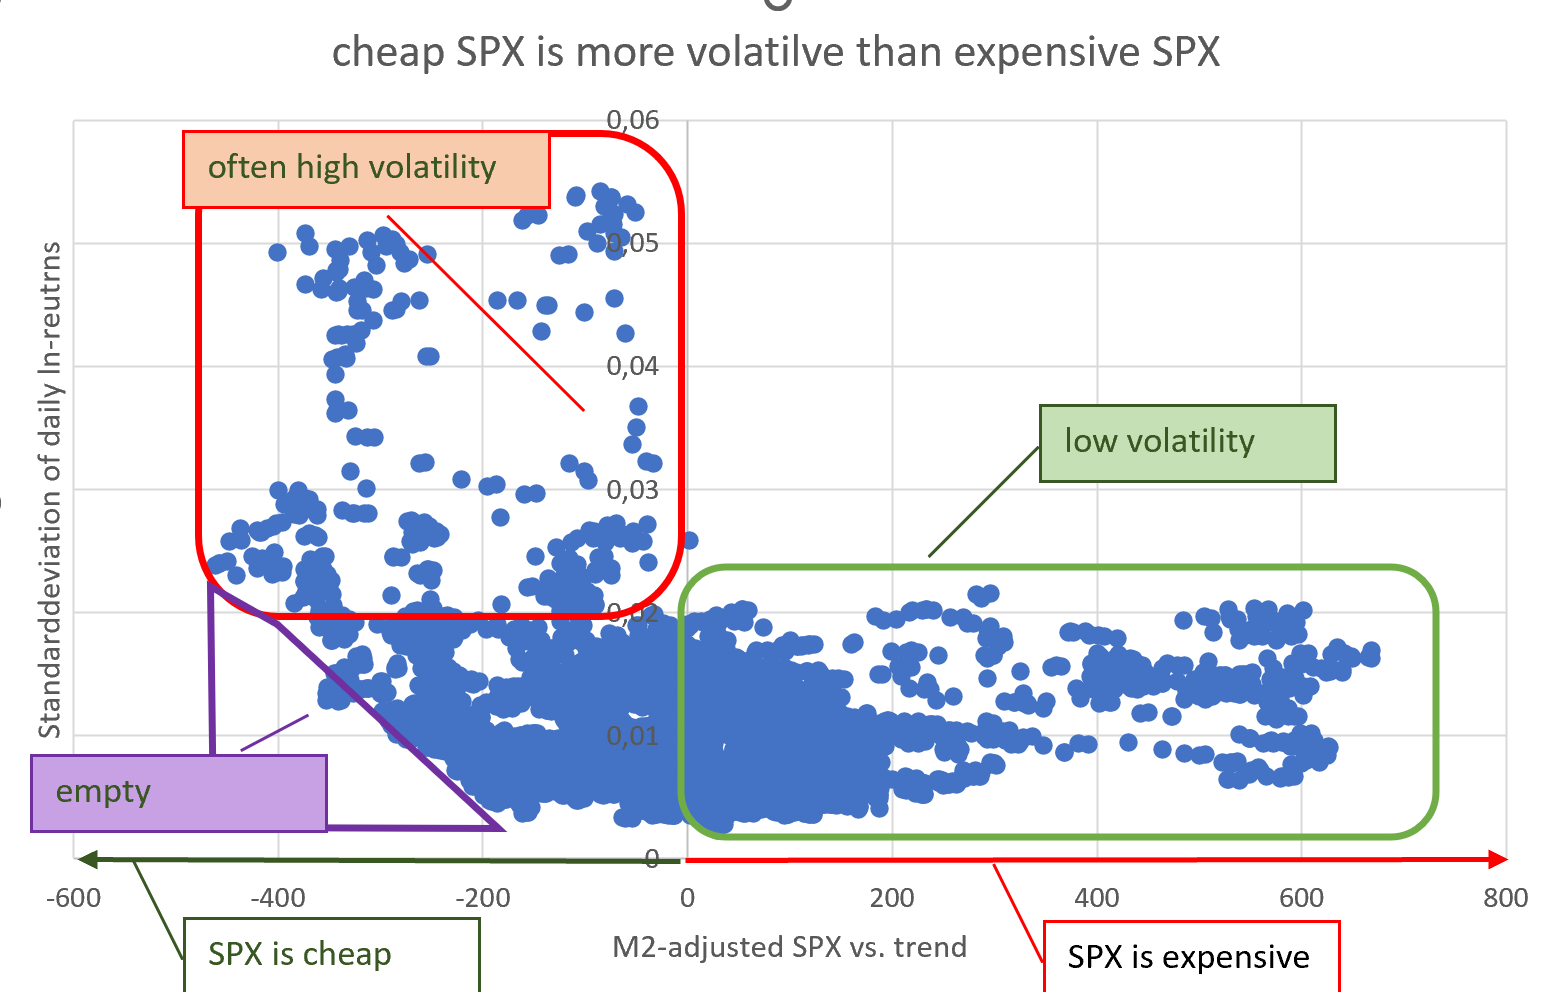
... we notice expensive S&P is associated with low volatility (green box) and cheap S&P is often associated with high volatility (red box). Very cheap S&P almost never comes with low volatility (purple triangle).

So lets get back to Bitcoin.


Since Bitcoin has declining volatility, we have to separate early bear markets from later bear markets. A bear market is Bitcoin price falling e^-0.5 below trend. We separate those bear market in 4 separate bear markets (bear 1, bear 2, bear 3 and bear 4) for each 4 year Bitcoin cycle.

We can now take a look at the relationship between Bitcoin valuation and volatility for our 4 bear markets.


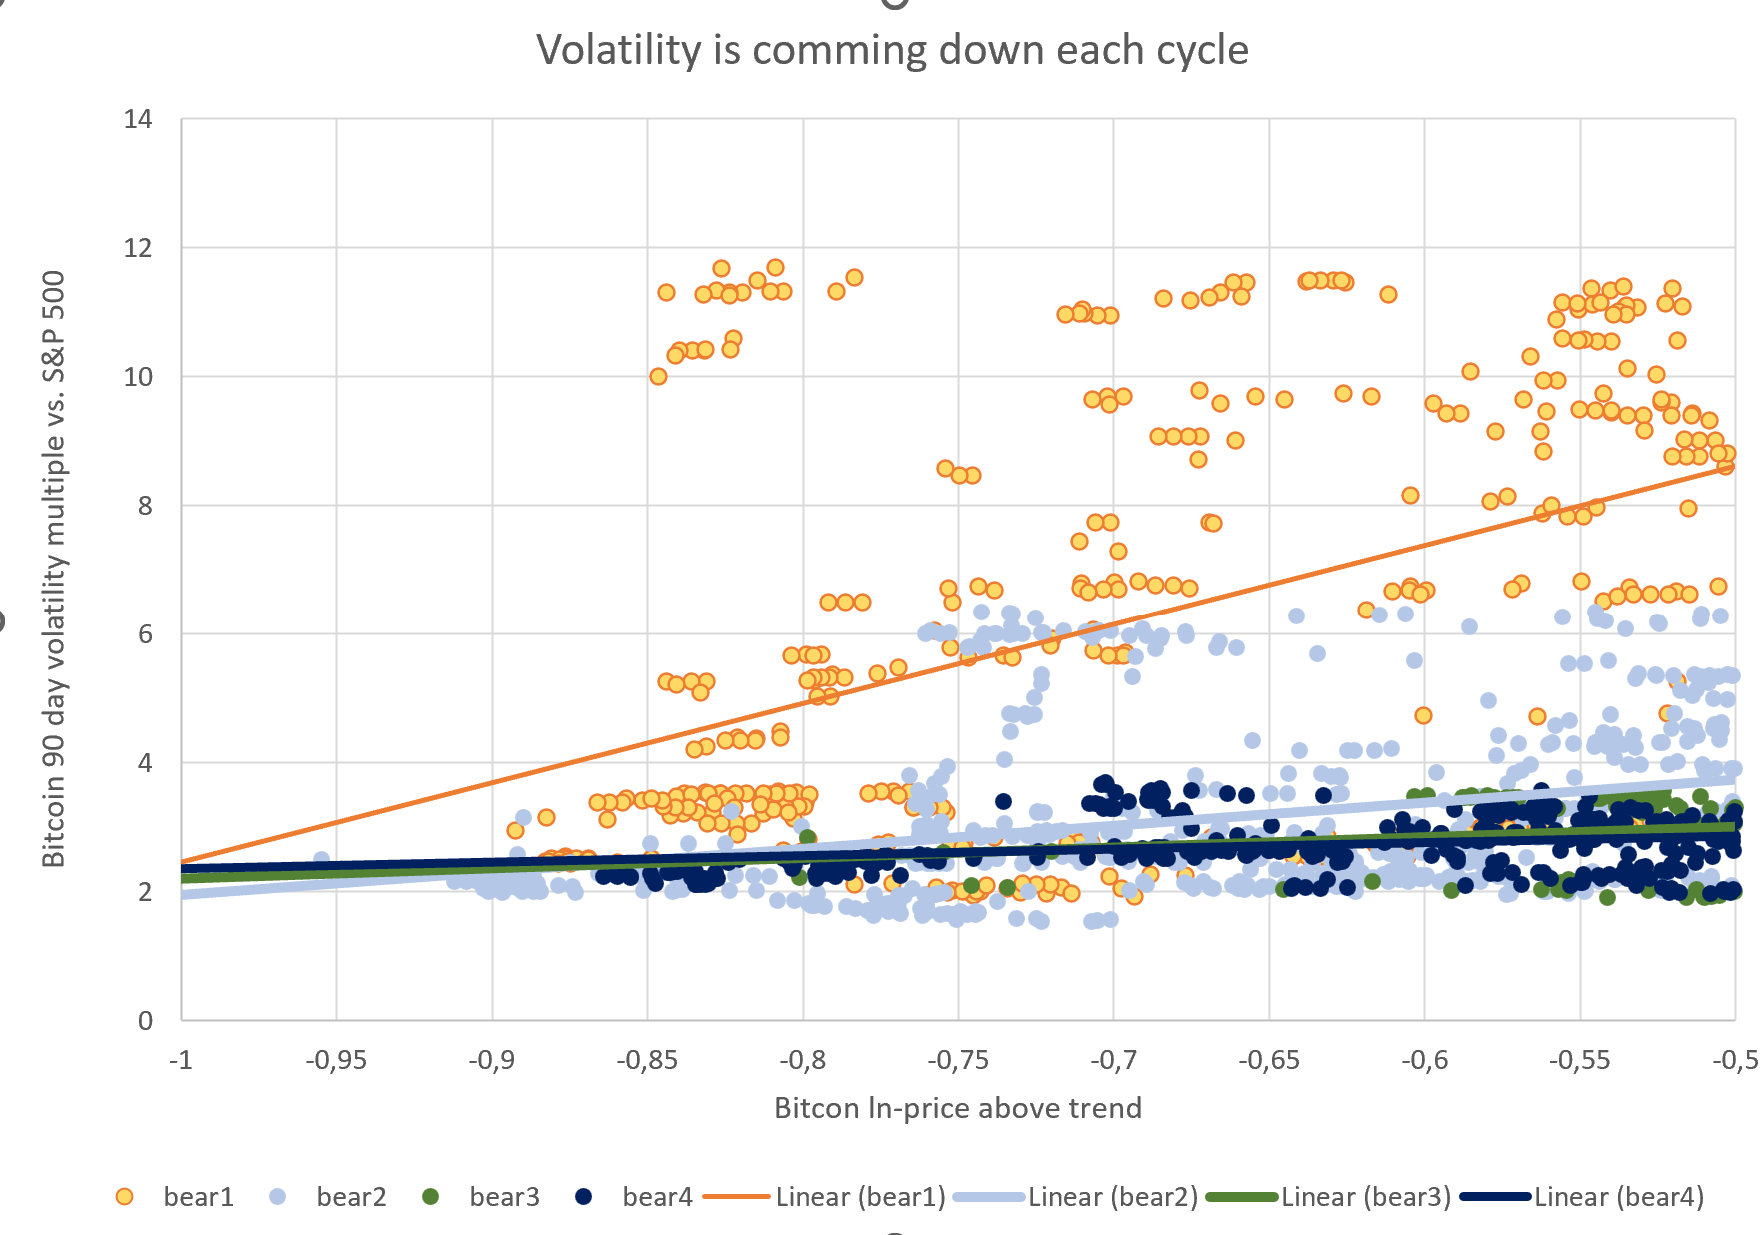
We can observe that the first bear market was the most volatile with subsequent bear markets becoming less volatile. We can also see from the linear trend lines that lower valuation is weakly associated with lower volatility.

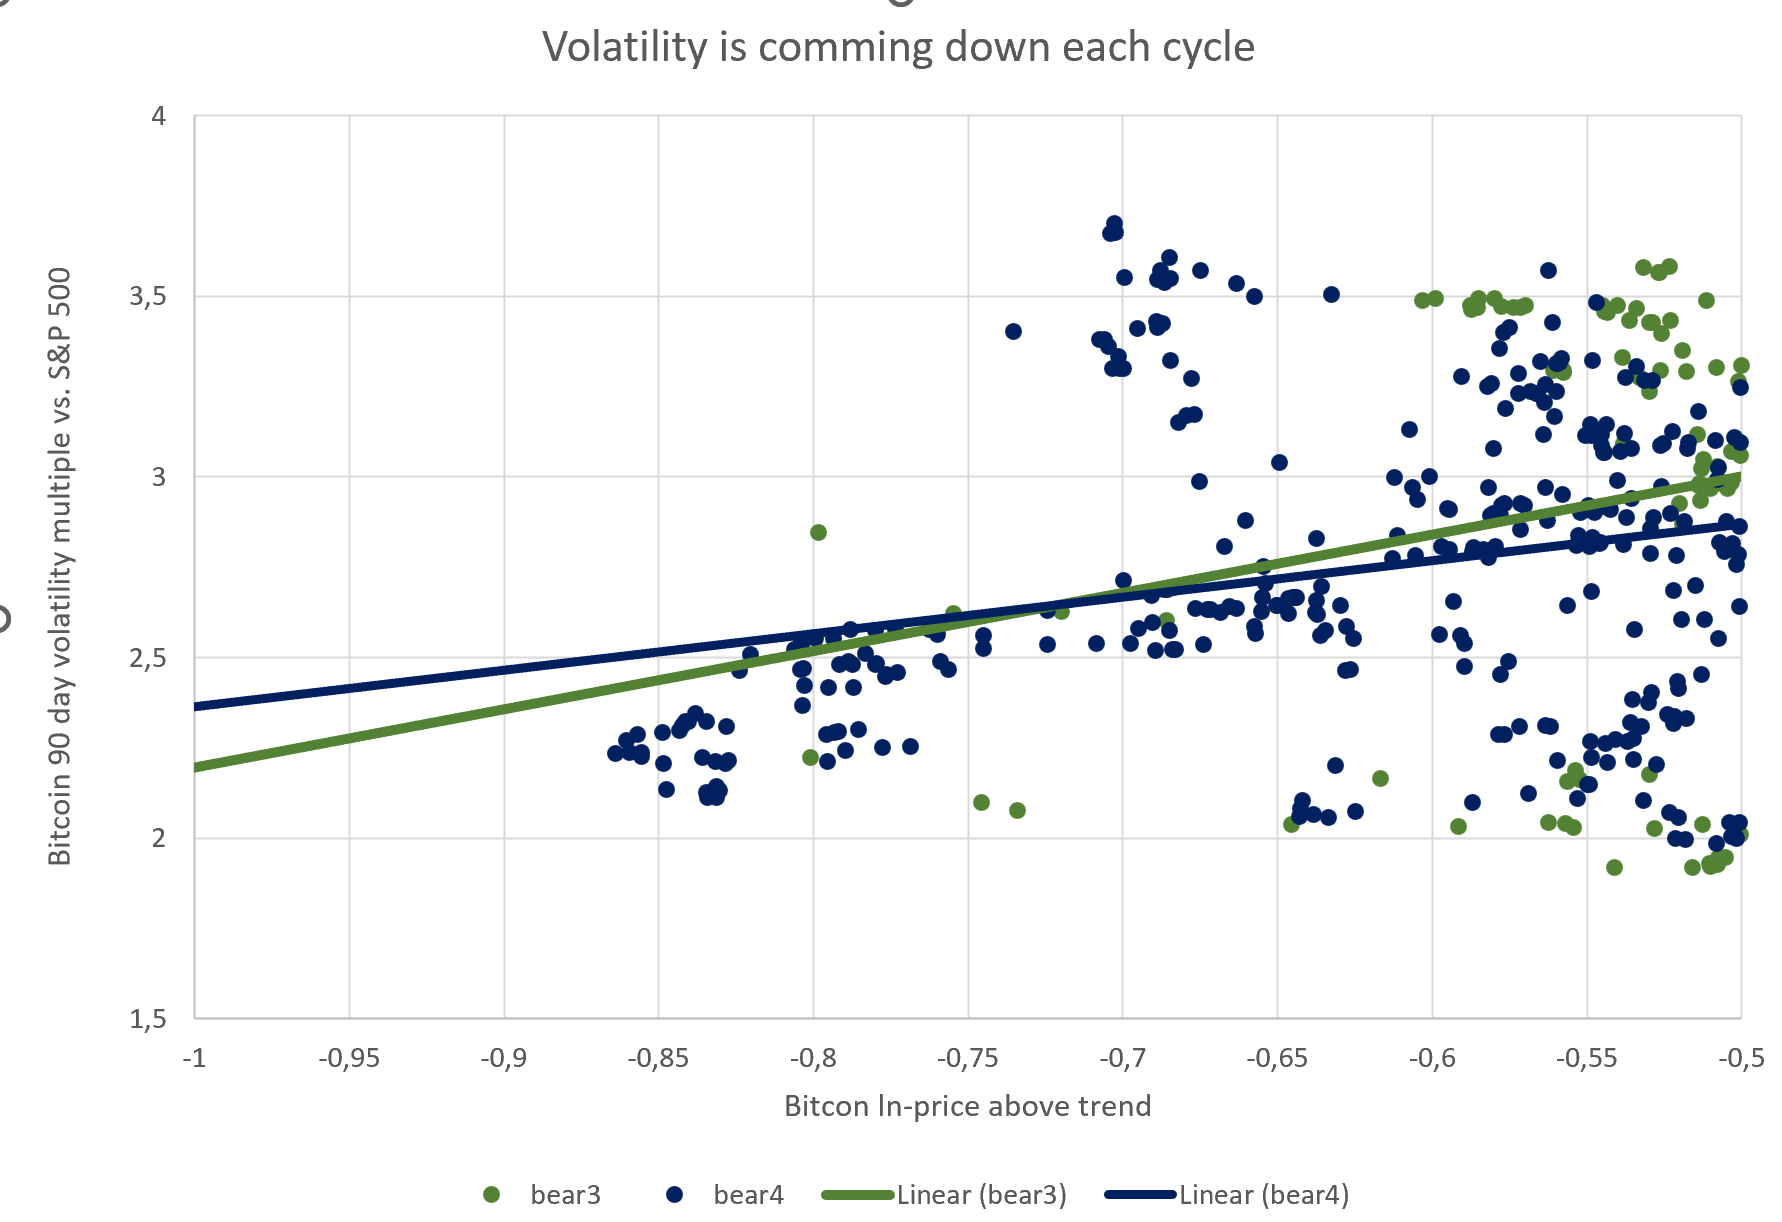
To get a better picture I make a chart with only the most recent 3 bear markets:


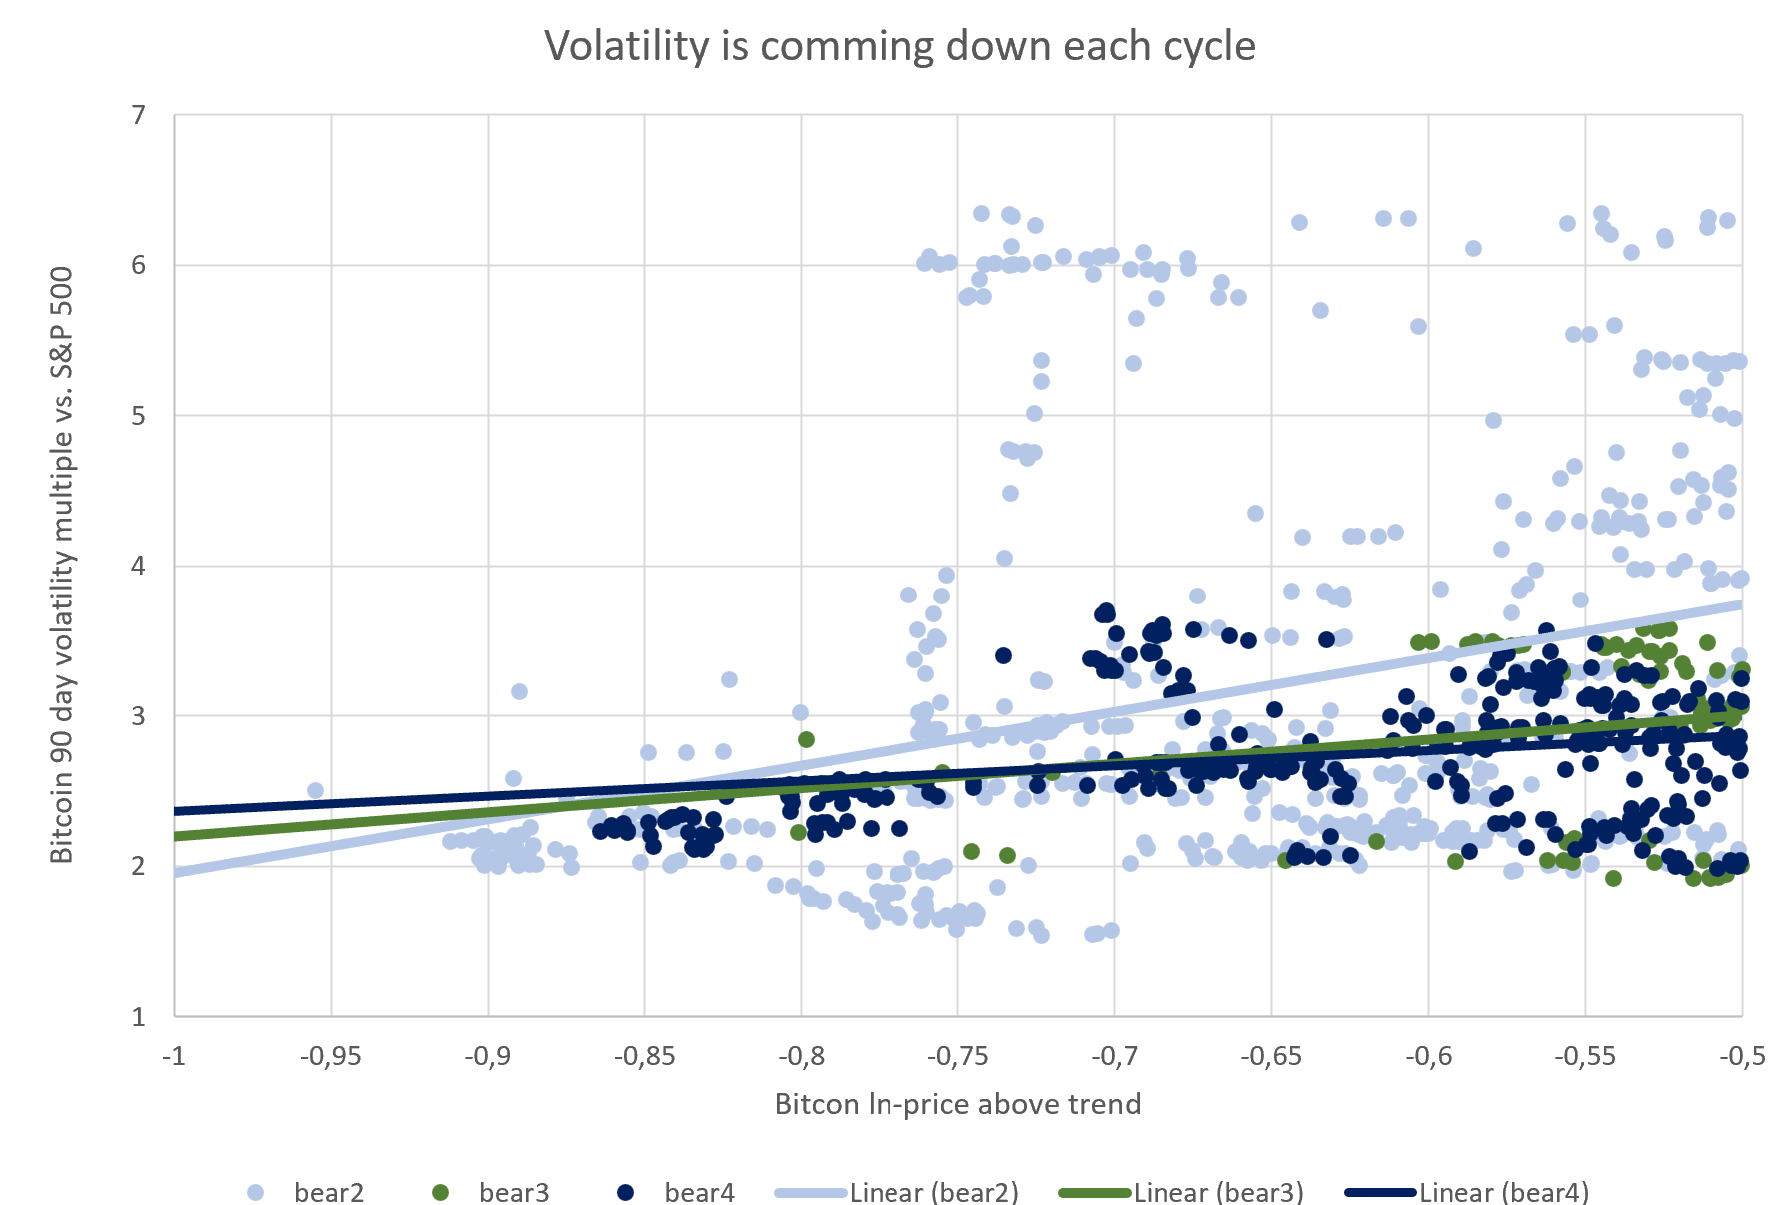
And I made a chart with only the most recent 2 bear markets as well:


We can observe below average volatility in a severe bear markets (-0,75 and lower). The combination of low valuation AND high volatiltiy was especially unlikely in the past, and I would not expect dots in the "unexpected are" in the future either.


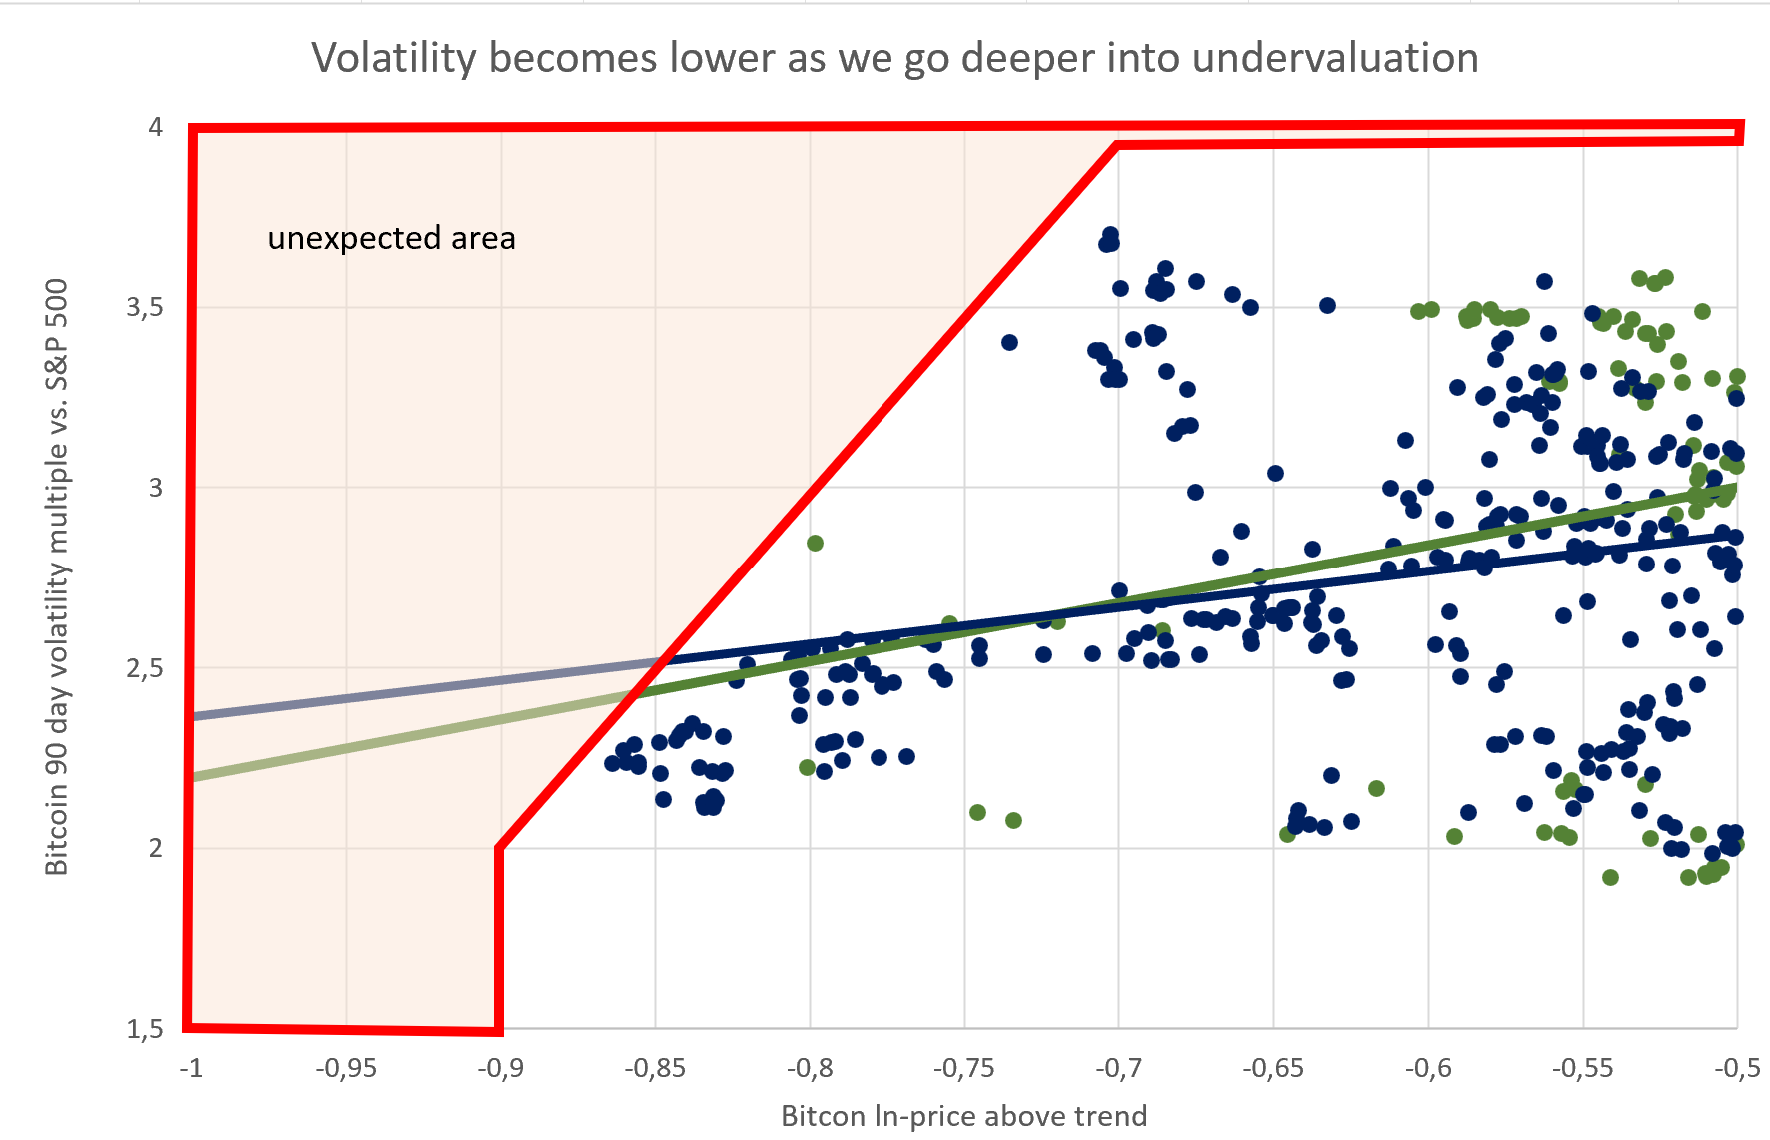
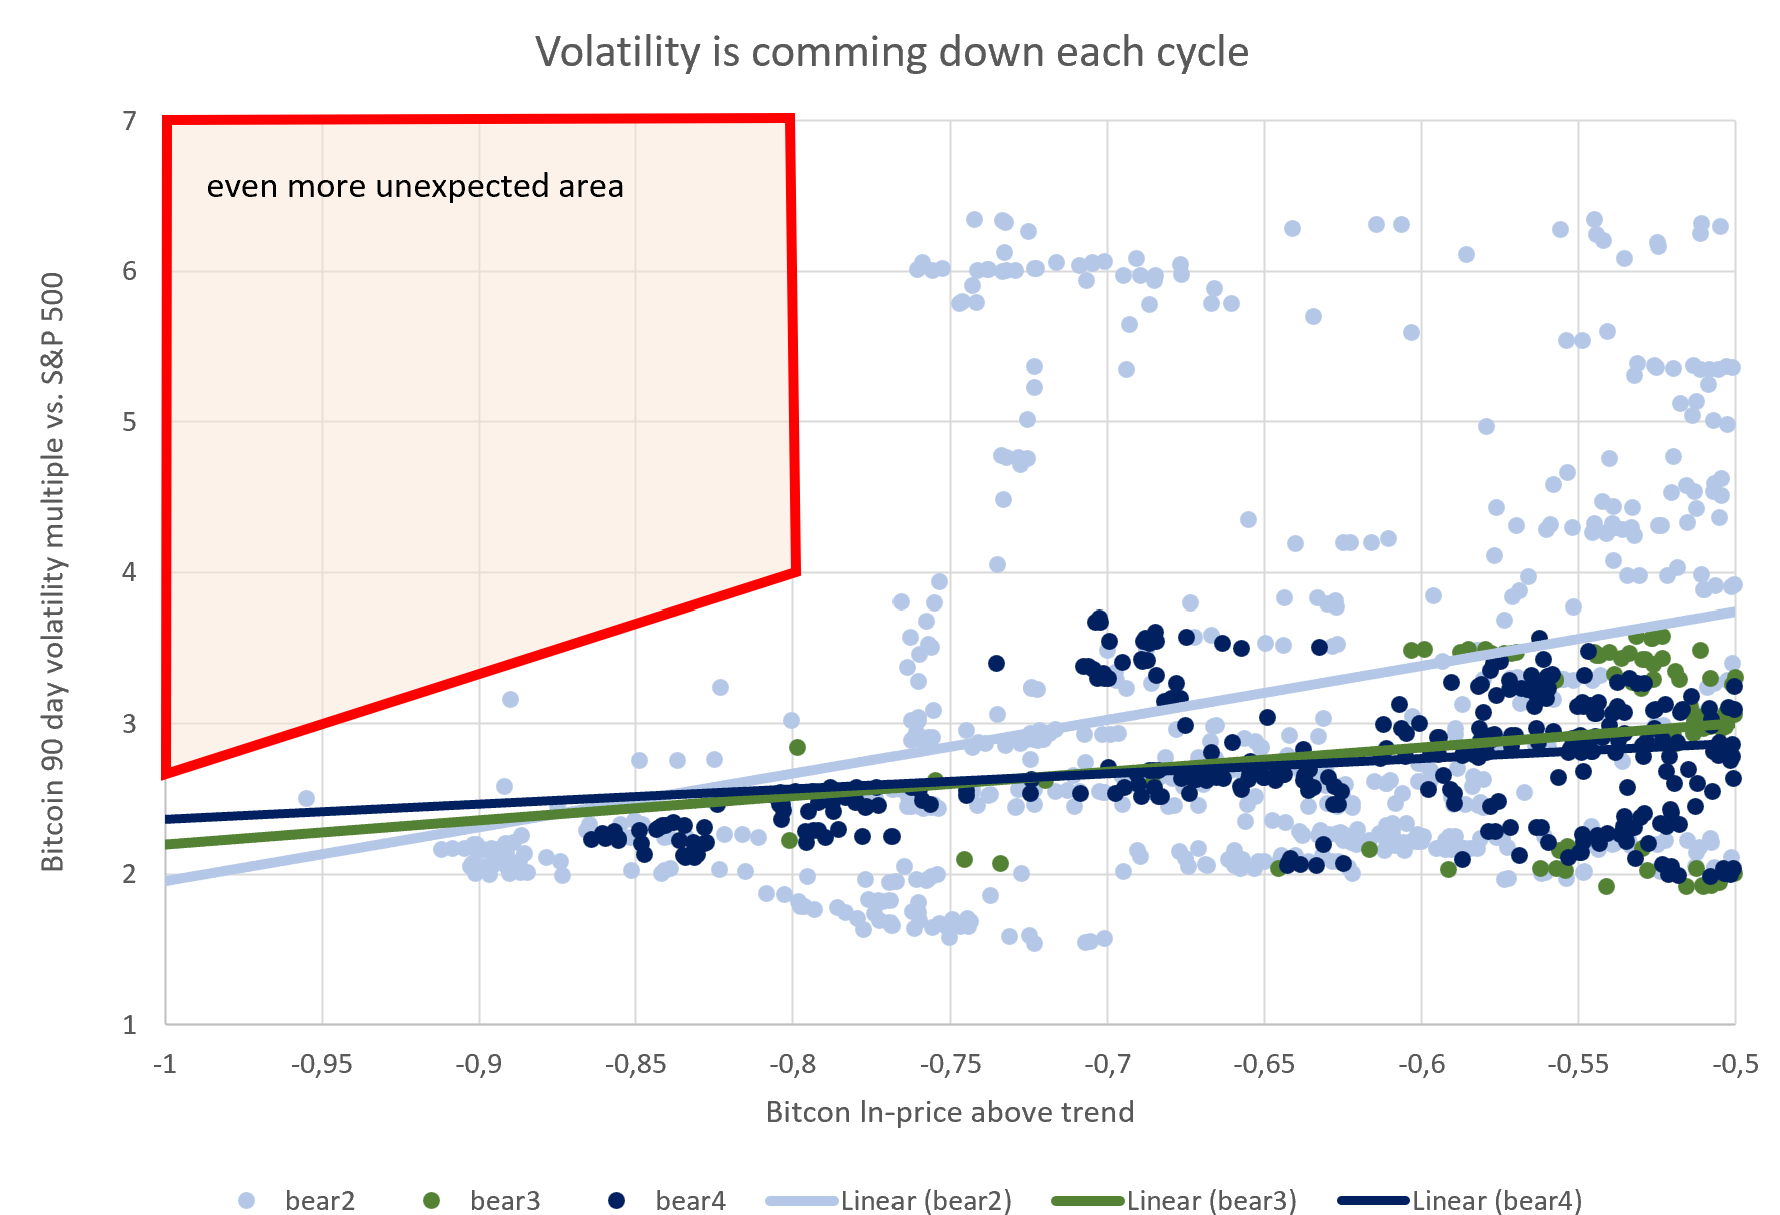
The two red boxes "unexpected area" and "even more unexpected area" are drawn via hand. An alternative visualization would be to mark all points, which were not exceeded during previous 4 bear markets.


The yellow line marks the frontier data points in the first bear market. All the points above the yellow line, we have no observation of higher volatility given a certain level of undervaluation. So all observed data points, even the worst data points are below the curve. The 3 other lines (bear 2, bear 3, bear 4) show the worst observed combinations of drawdown and volatility during the respective bear market.


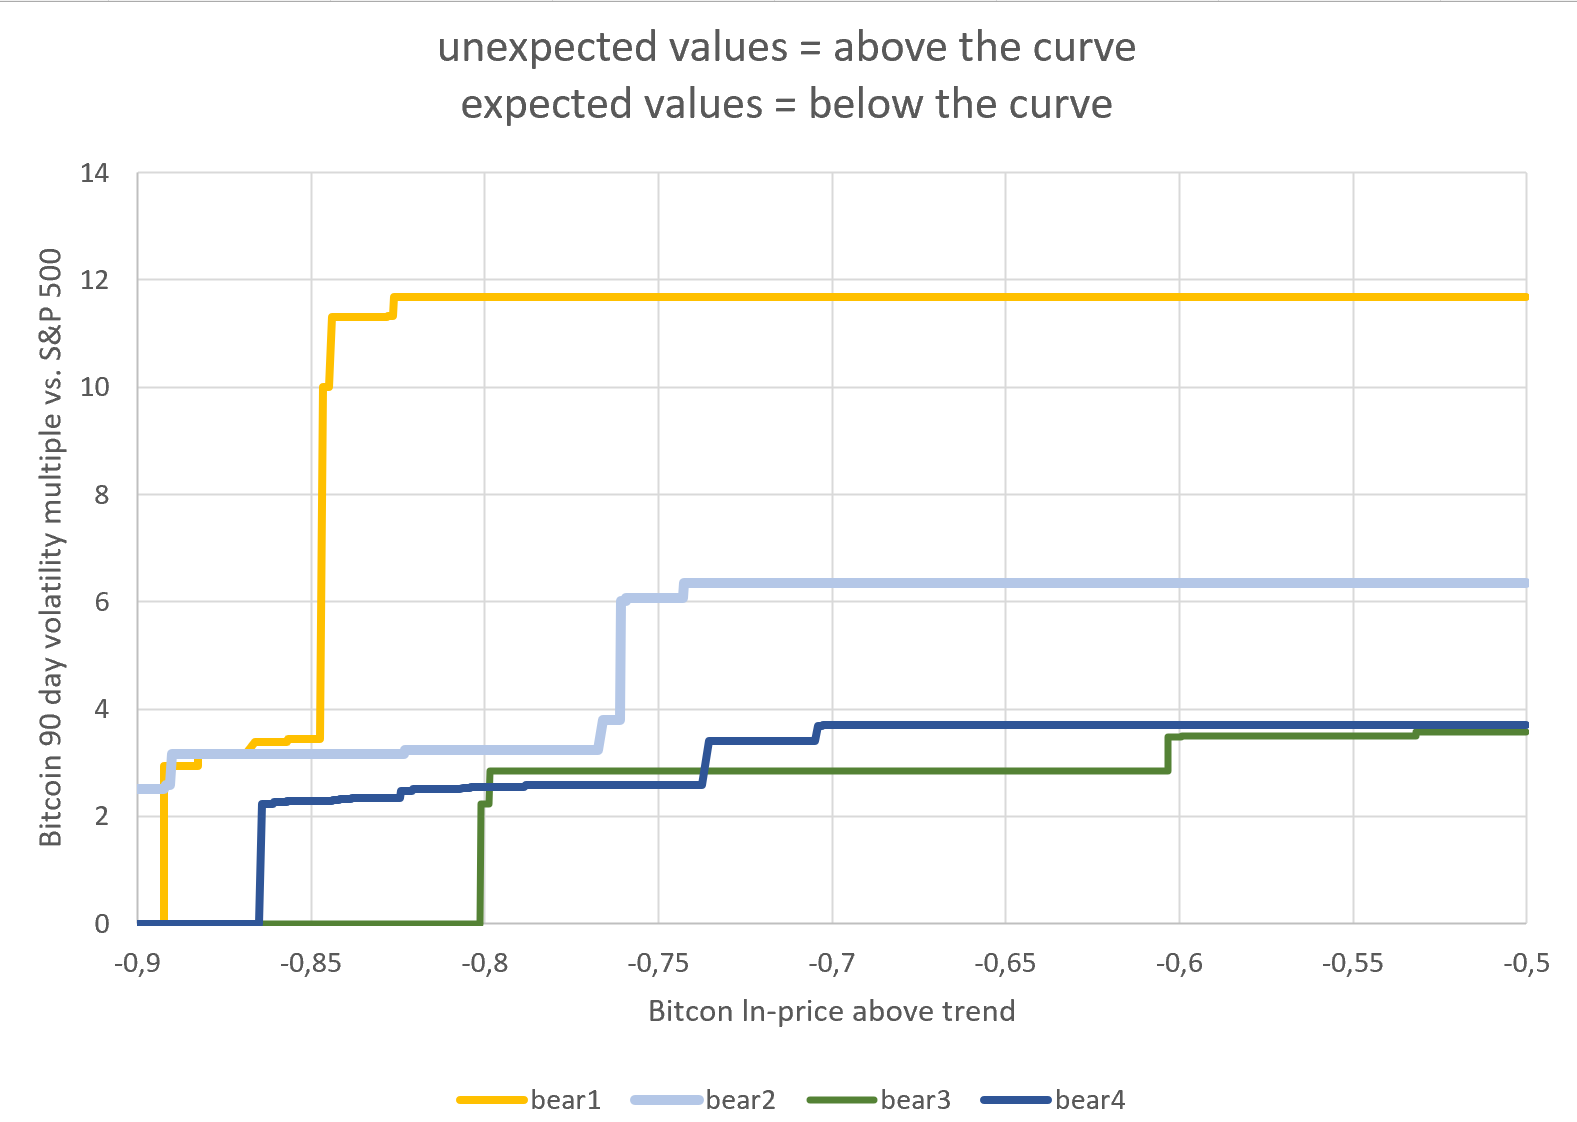
From bear1 to bear2 to bear3 we can see a clear reduction in volatility. The worst data points for bear3 and bear4 however look pretty similar, so I will lump them together in future charts. These frontiers only give us a binary indicator. If our newly observed data point is outside of the frontier (above the curve), our observation is worse than historical data points. If our newly observed data point is inside of the frontier, our observation is within historical observations. To quantify "Know how bad is it?" we have to rank our data points somehow.


We want to create a metric, which shows (i) high volatility is bad, (ii) low valuation is bad, (iii) a valuation decline from -0,5 to -0,7 much ist less bad than a valuation decline from -0,85 to 1,05 and (iv) a combination of high volatility AND low valuation is worse than any one of both.

The valuations during bear market (Bitcoin price below trend) shows many observations of average bear market and fewer observations as the bear market become more extreme. Describing the valuation data in a bear market with a normal distribution seems fitting to me.


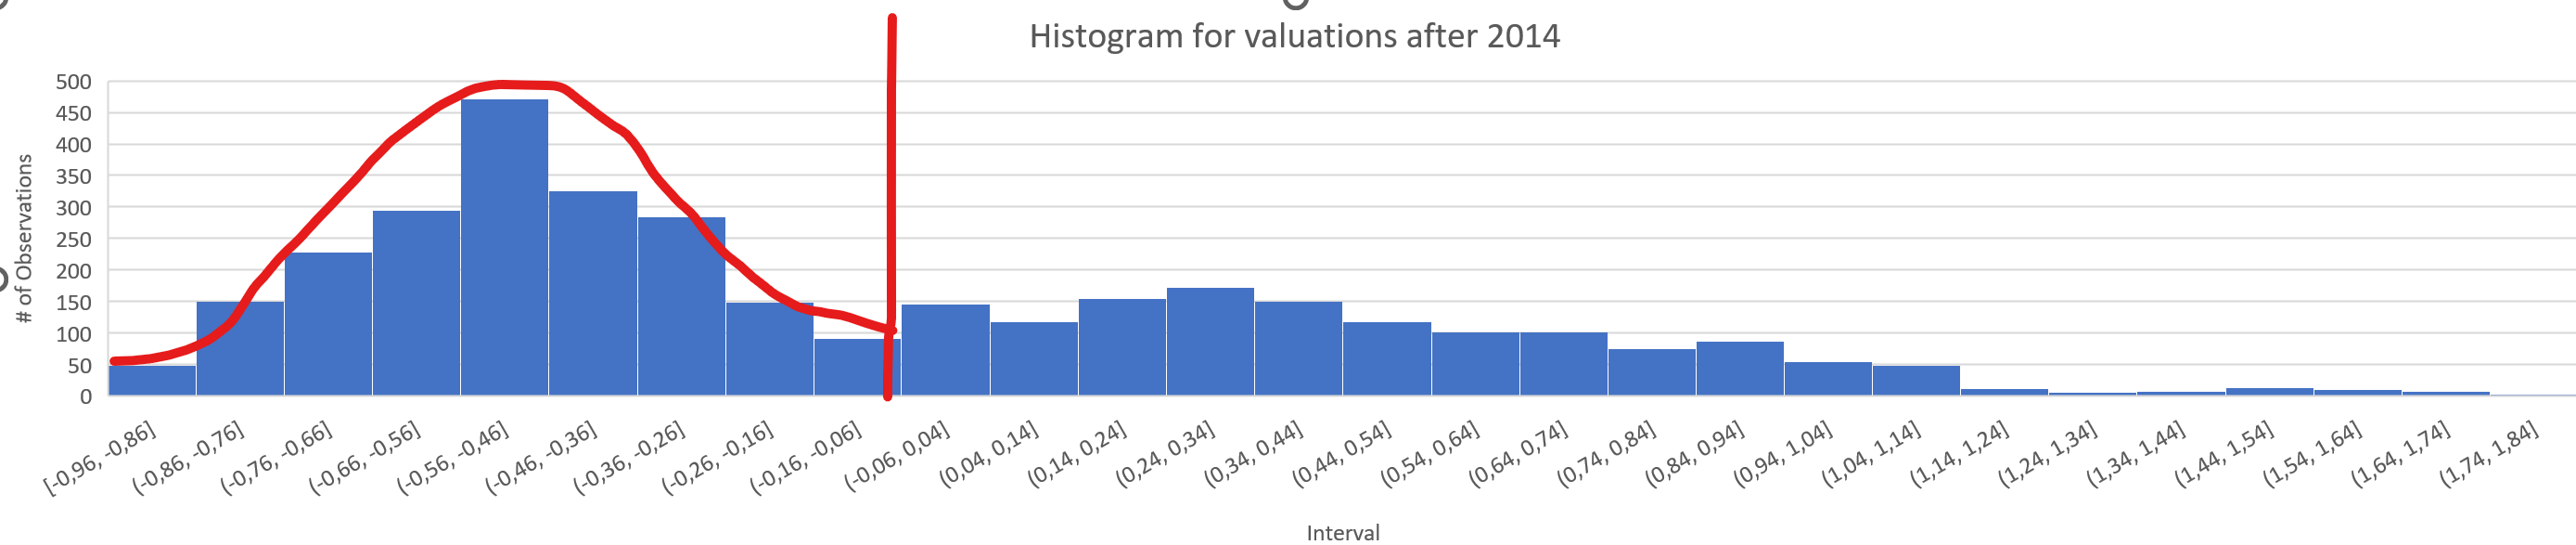
Whereas the the volatility does not suggest a normal distribution. The higher the volatility the lower the probability, with a volatility floor slightly below 2.


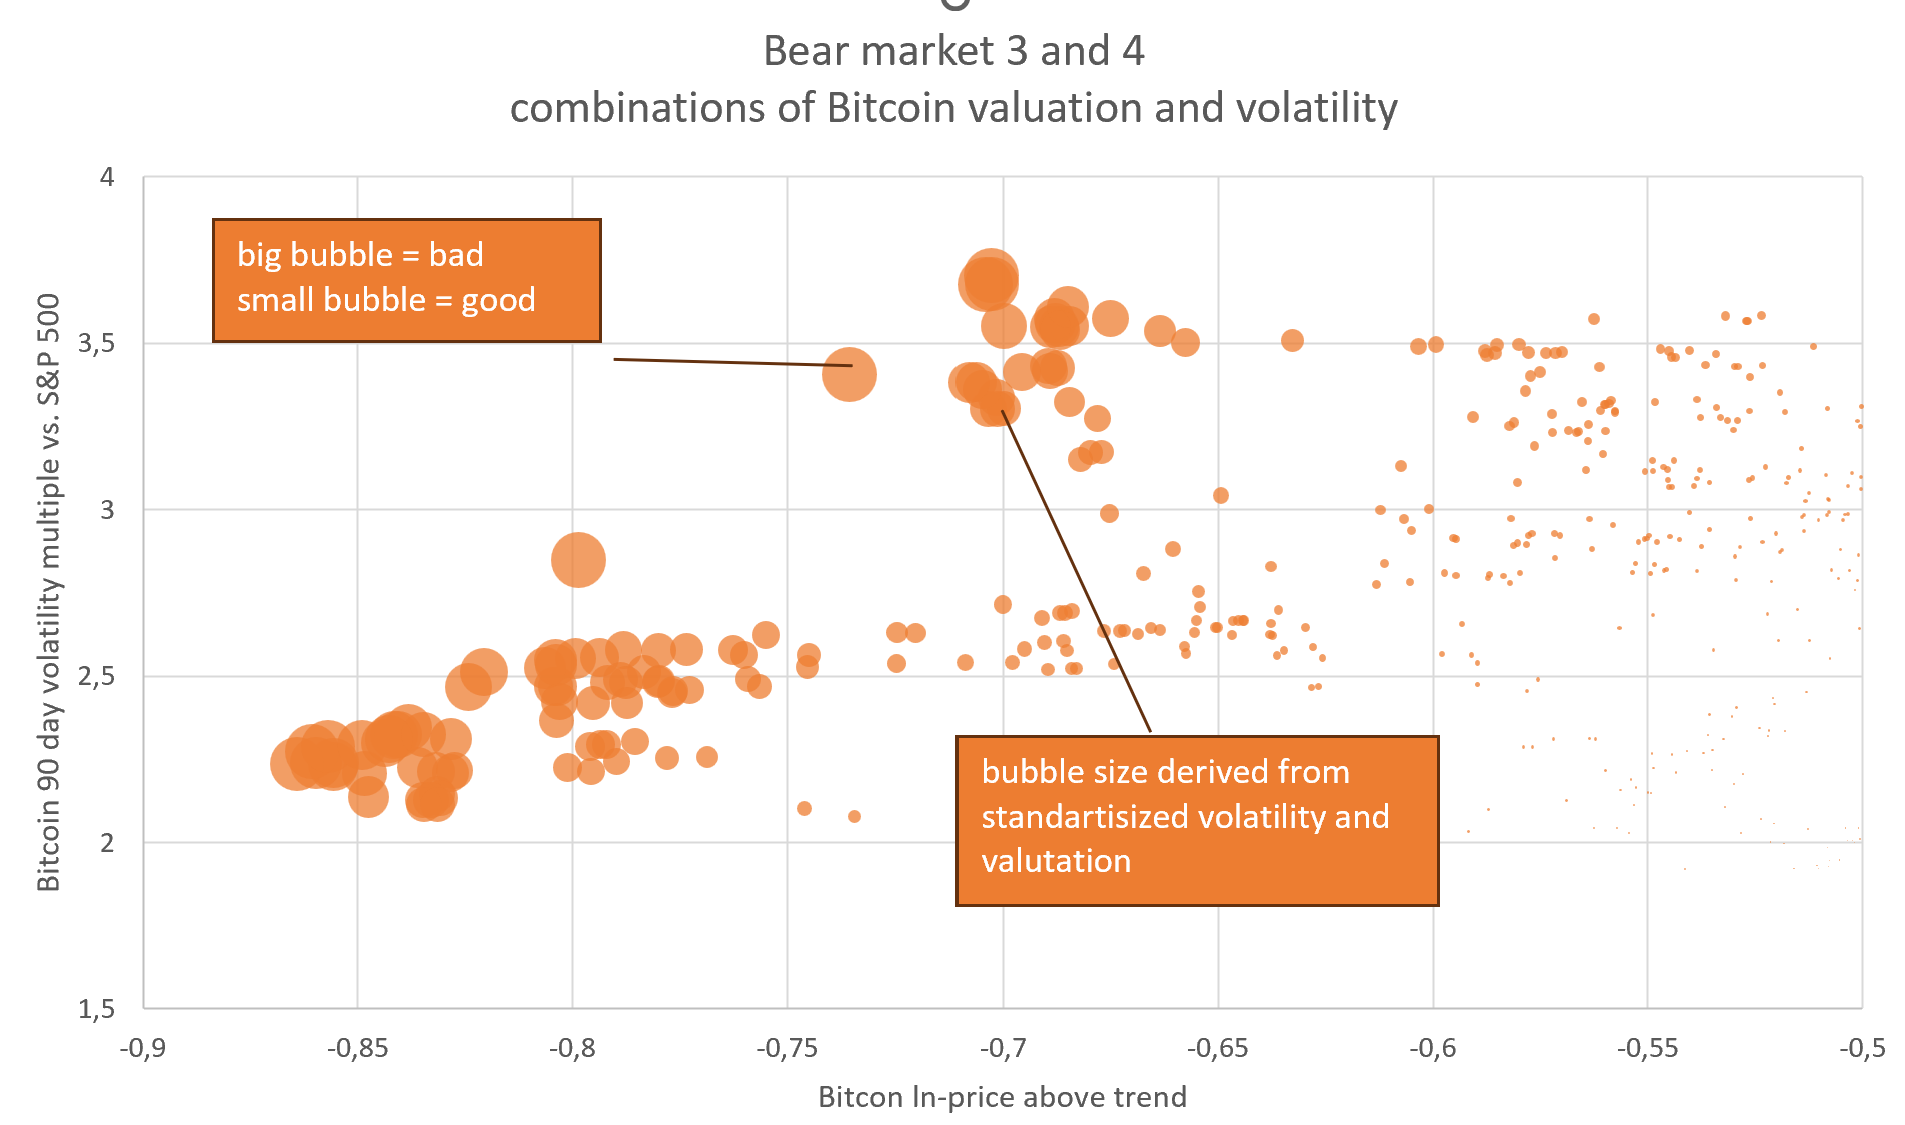
With this information I create a formula for calculating risk scores, which seems fitting to me. The risk score measures the risk of a sudden break in my model to the downside. Each blue dot represents a day in the bear market bear3 or bear4. The size of the dot represents how risky a break down of the model to the downside was for each day.


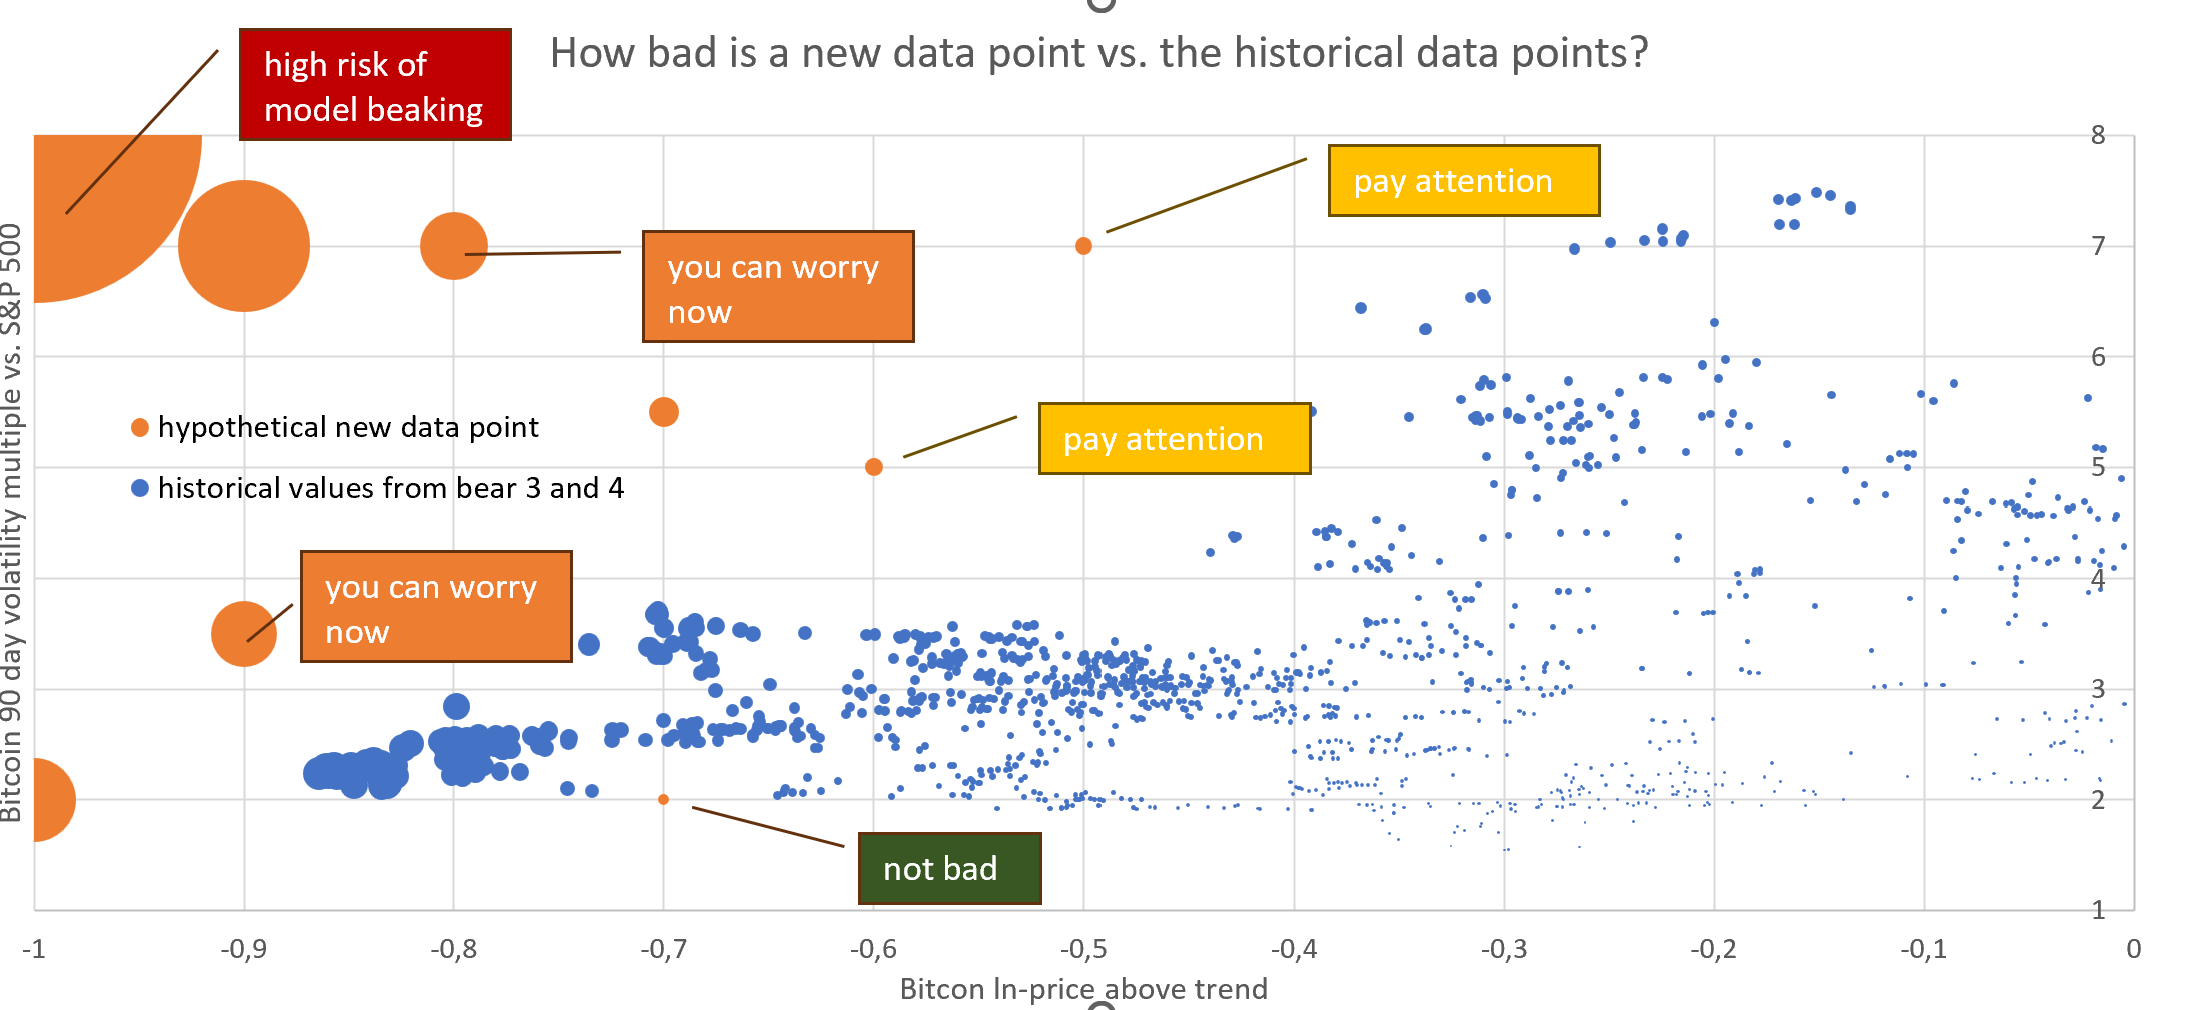
The orange points are hypothetical new data points in the future to show how much risk each data point would have:
- A Bitcoin price at trend*e^-0.7 with a volatility of 2, would be low risk, since we have historical data points with am even lower Bitcoin price with higher volatility. This data point would be a green traffic light.
- A day of (-0.6, 5) or (-0.5, 7) would be slightly elevated risk. The combination of Bitcoin price and volatility seems a bit high compared to the last 2 bear markets. However Bitcoin was cheaper or more volatile in the past, so we have to pay attention. This data point would be a yellow traffic light.
- A hypothetical day of (-1, 2) or (-0.9, 3.5) or (-0.8, 7) would indicate elevated risk of a model break down, since drawdown and volatility exceeds historical data from the last two bear markets. This data point would be a orange traffic light.
- A hypothetical day of (-1, 8 ) would indicate a high risk of our model breaking, since the historically Bitcoin price didn't sink so far below trend and the high level of volatility is also very unusual.


The 10 days with the highest risk value were end of 2022 / beginning of 2023, with high drawdown, but only moderate volatility. I added a graph for the risk values since 2011 (blue line).


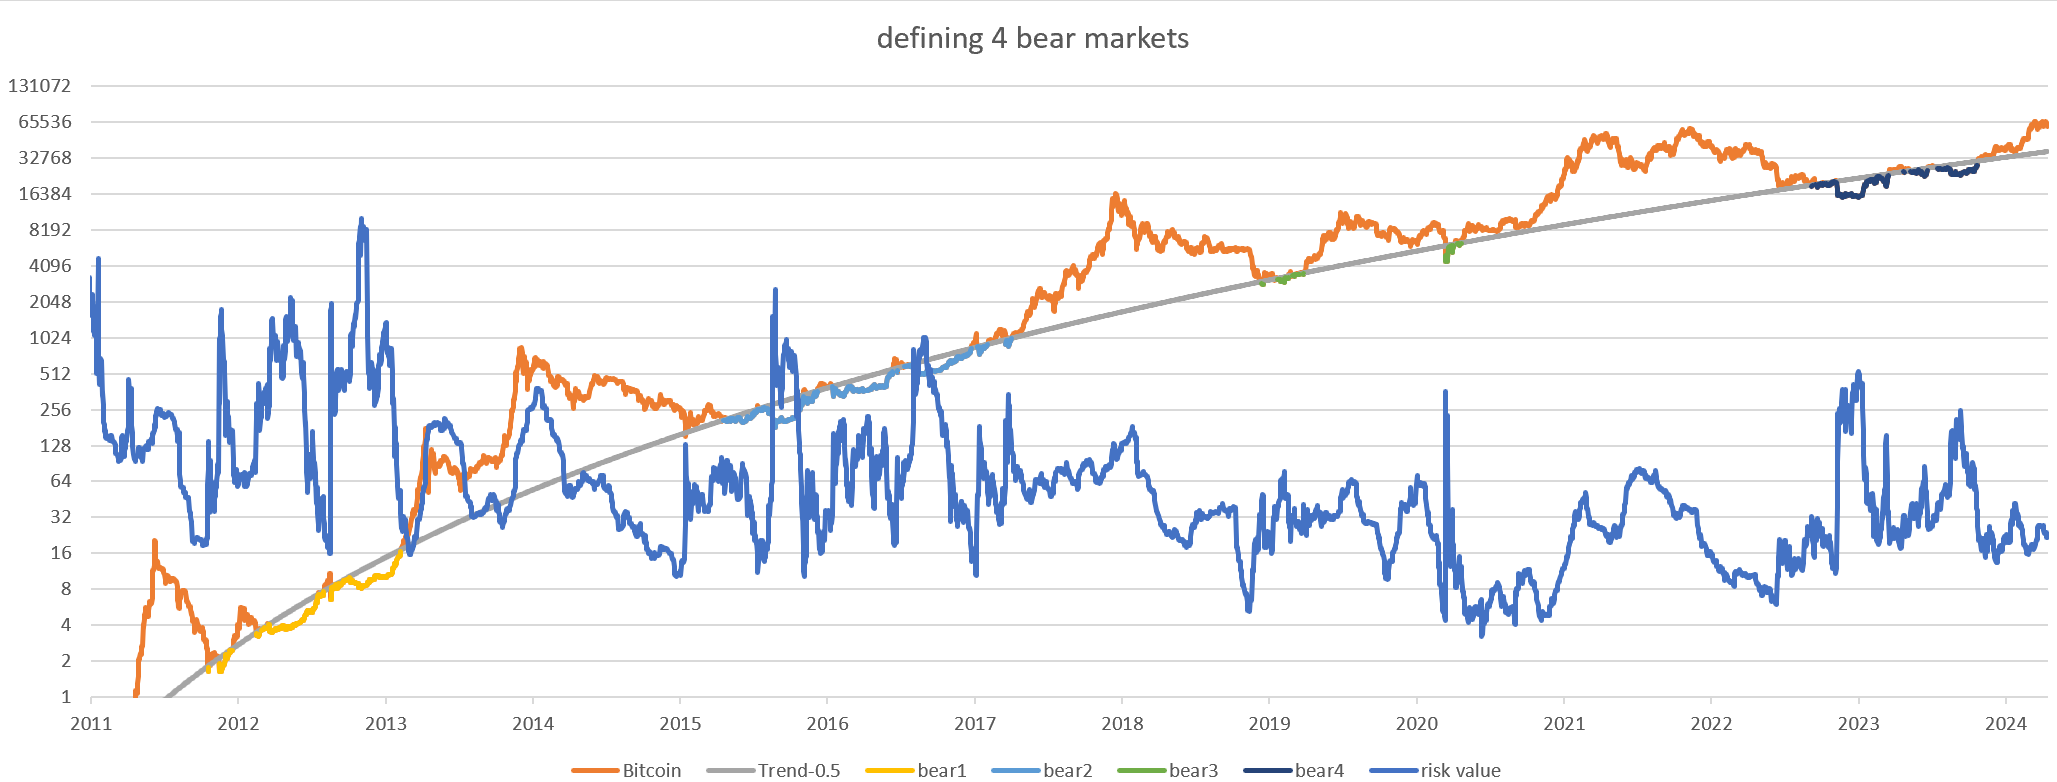
We couldn't have calculated the blue line in real time. However I still plottet the line to get a feeling how the risk value moved during Bitcoin's history.


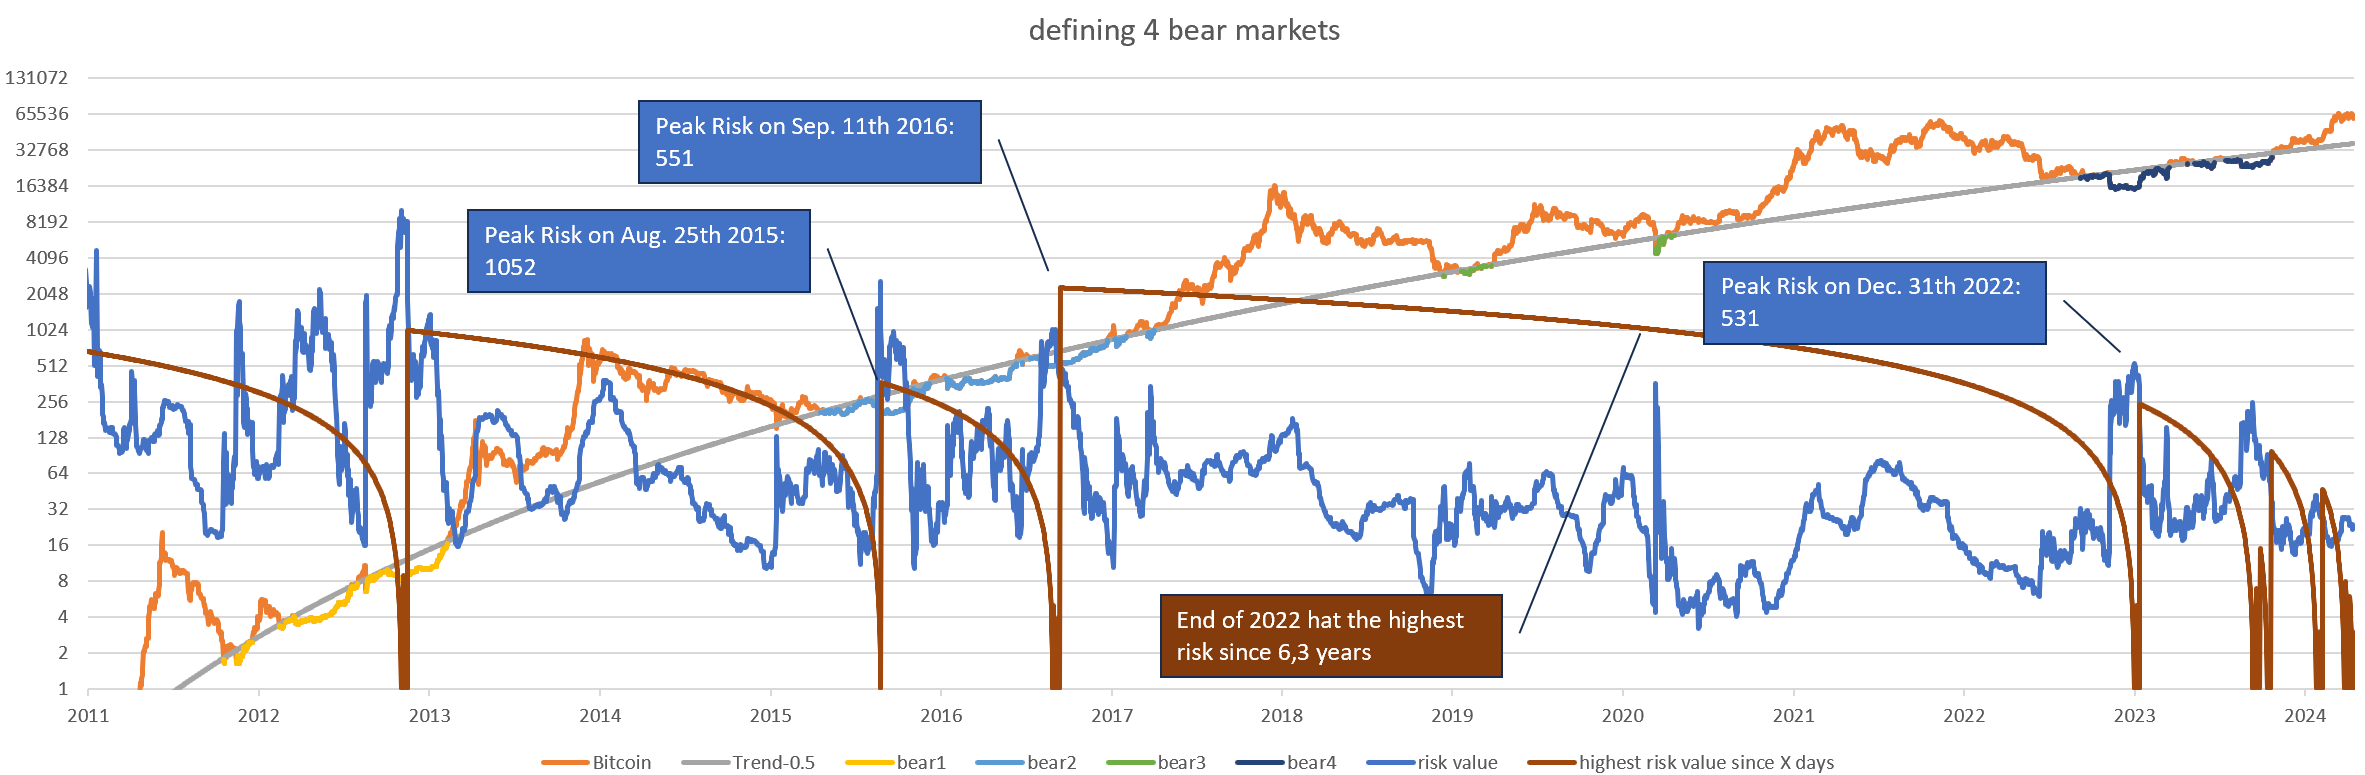
The highes recent risk value was 531 at Dec. 31th of 2022. This was the highest risk value since 551 on Sep. 11th 2016, which was 6.3 years earlier. The absolute risk value has not important meaning for our interpretation. However our risk value in comparison to previous risk values is important for our interpretation.

Genrally Bitcoin's risk is declining. If on one day we exceed the risk of multiple prior years, we can for sure say is a sign of elevated risk.


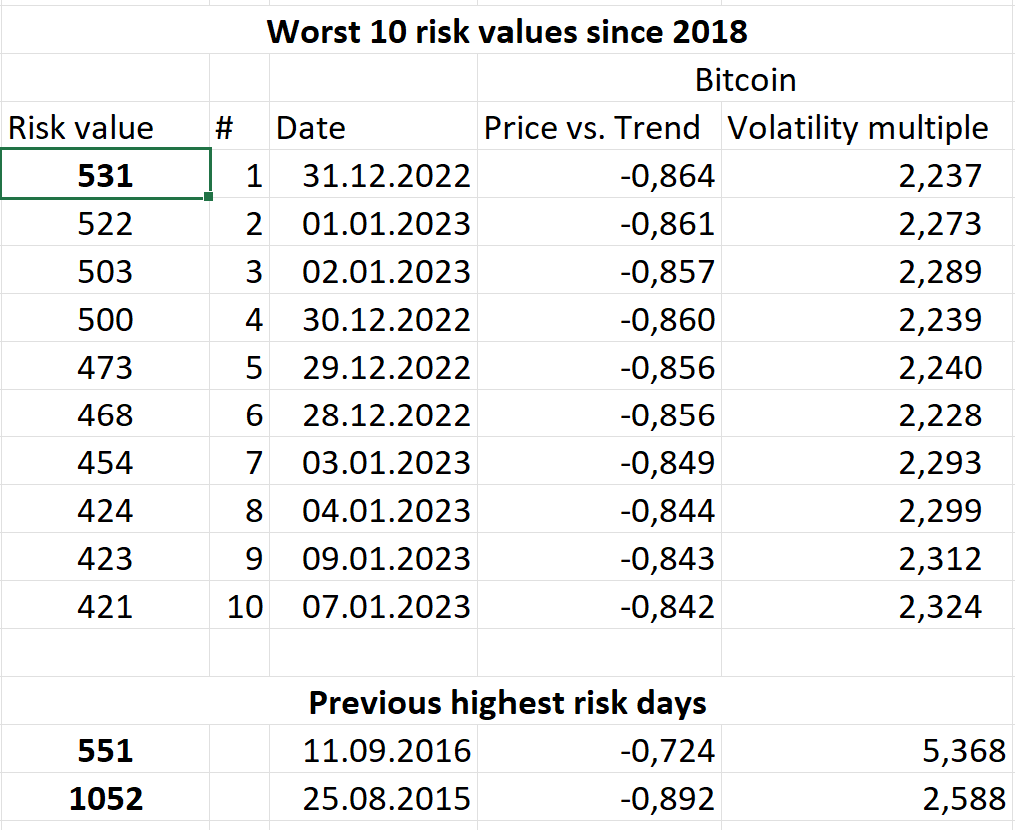
Our historical data enables us to set cutoff points for acceptable risk. I think a risk value 550 does not indicate a break down of our model, since we reached this neighborhood 2016, 2022, 2023 and 2020.

A risk level of more then 1000 would indicate possible model breakdown, since we would reach the risk neighborhood of 2015 or even 2013. This would be surprising, since we would exceed the risk values of the previous decade and breaking the trend of decreasing risk in Bitcoin.

Since now we have our risk levels (<550 for green light, >1000 for red light and yellow light for 550-1000) we can draw them into our plotter chart.


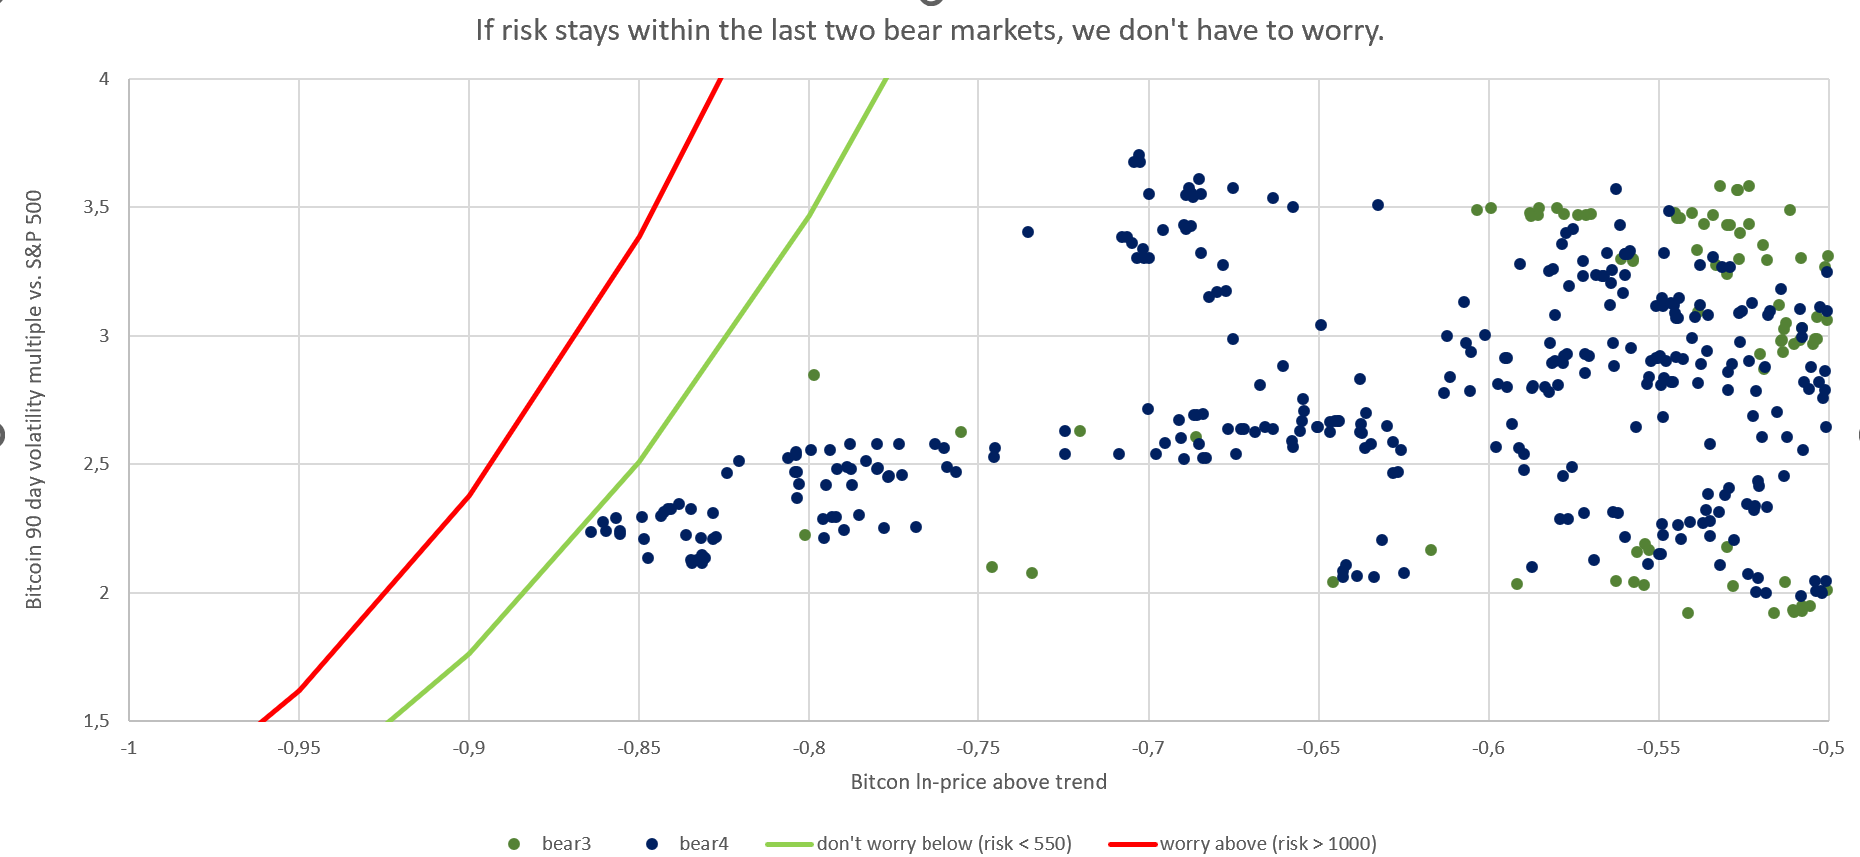
All datapoints for bear3 and bear4 are below the green line, which means we can sleep well and trust in our model (Bitcoin trend price growth and moving around cycle). While everybody is scared, we sleep like a baby. We have no data points above the red line, therefore on no days we had to question our model.

Since we calibrated our at bear3 and bear4 this result is not surprising.


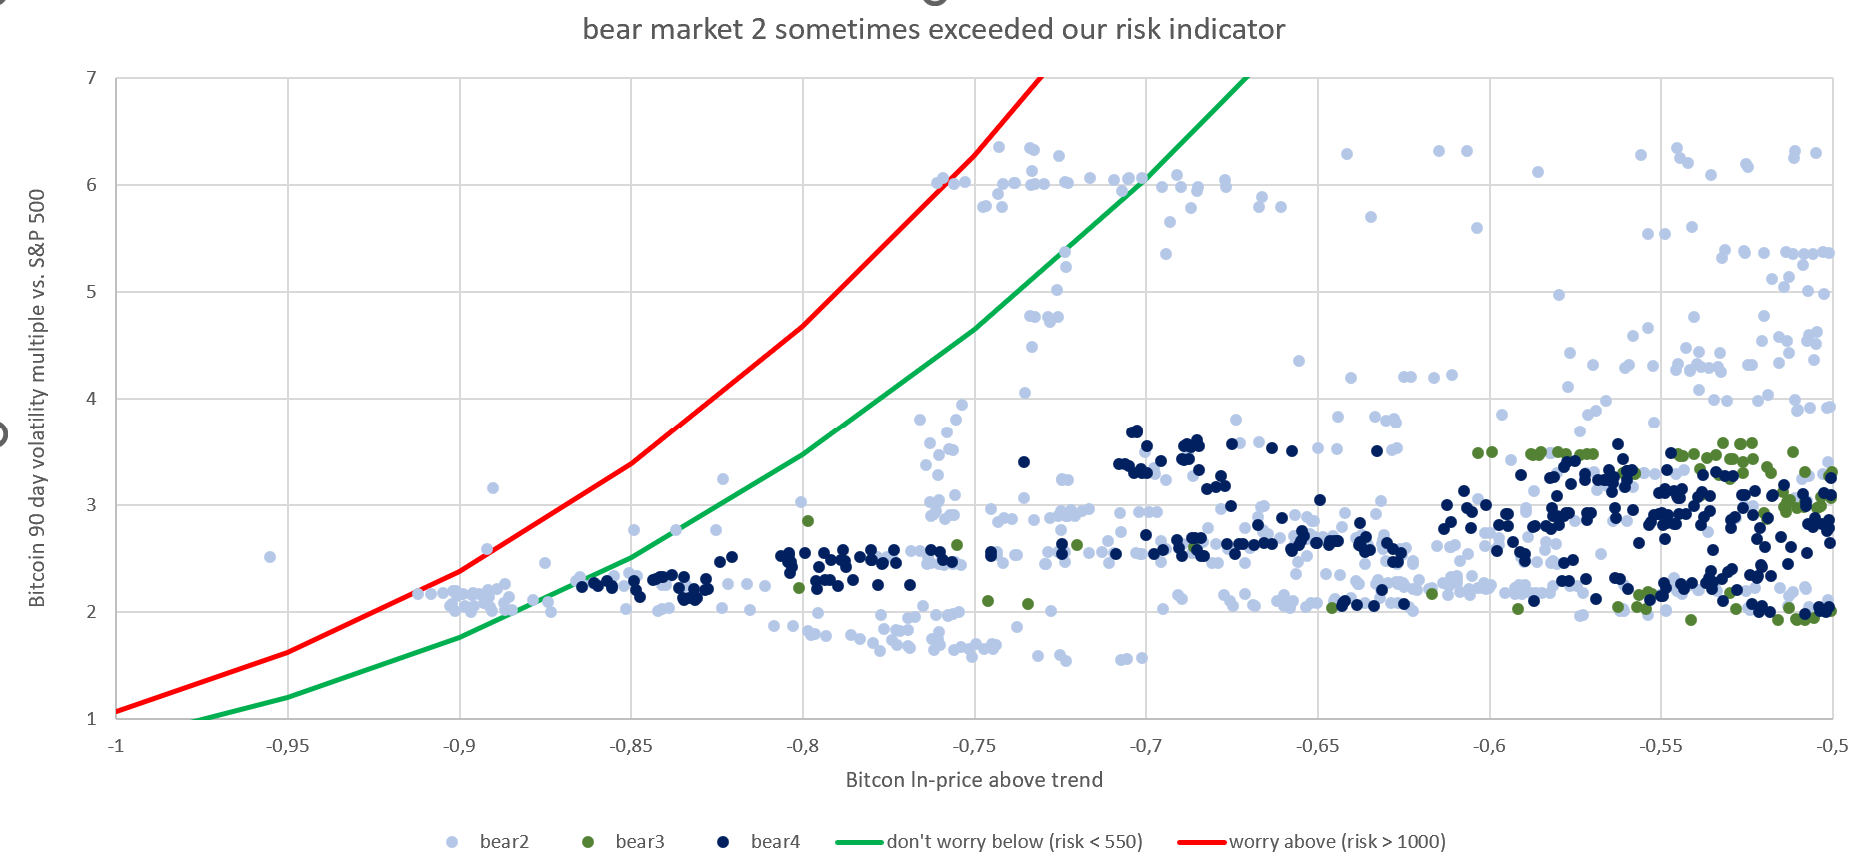
If we add bear2, we can see some dots get a yellow traffic light from us (those dots are between the green and the red line). A few dots are are even north of the red line meaning on those days we should check our model for possible break down. I think this calibration is reasonable, because getting risk values during bear market 5, which were last seen in bear3, should make us cautious.


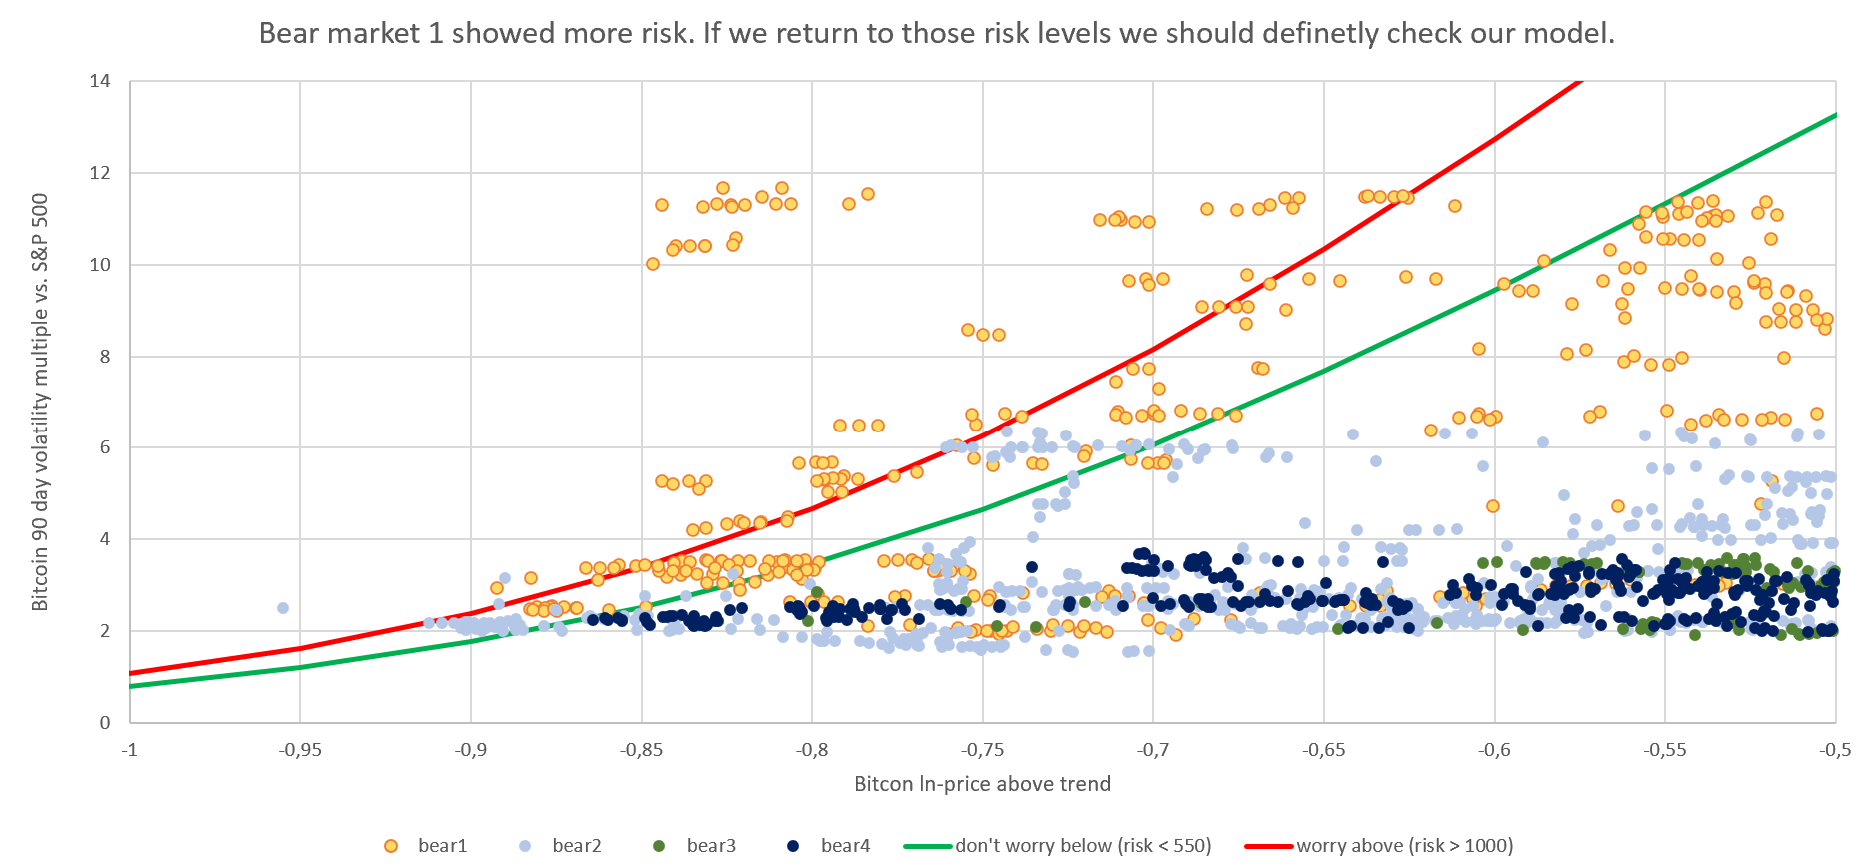
We add bear1, now we see multiple values exceeding our red line.

Traffic light is ...
- red, if Risk_value > 1000
- green, if Risk_value < 550
- yellow otherwise

Code:
risk_value = risk_value_below_trend * risk_value_volatility
risk_value_below_trend = 1 / NORMSDIST(z)
z = (Bitcoin_vs_trend - Bitcoin_vs_trend_average) / Standarddeviation(all Bitcoin_vs_trend from bear3 and bear4)
Bitcoin_vs_trend = ln(Bitcoin_price) - ln(Bitcoin_price_trend)
risk_value_volatility = (Standarddeviation(daily Bitcoin price returns from previous 90 days) / Standarddeviation(daily S%P 500 price returns from previous 90 days)^2

Sicherheit für deine Familie, dich und deine BTC, dank der fundierten Sicherheits-Tipps der KryptoArche. Wir kaufen Bitcoin zum Vermögensaufbau oder zur Krisenvorsorge. Wir kaufen Bitcoin dezentral als Schutz vor Räubern, mit guter Historie und verwahren unsere Bitcoin sicher vor Verlust, Räubern und Dieben sowie versteckt Wir nutzen sichere Passwörter, BetriebssystemeSoftware und sufen sicher. Sicher dir deinen kostenlosen Platz auf der KryptoArche! Die Zeit läuft ab! Steig ein, bevor es zu spät ist! Gemeinsam bleiben wir immer über Wasser!
slaman29
Legendary
*
Offline Offline

Activity: 2632
Merit: 1212


Livecasino, 20% cashback, no fuss payouts.


View Profile
April 16, 2024, 07:06:46 AM
Merited by virginorange (2)
 #38

Brilliant! I think a lot of valid points here and for sure, an investor would gain advantage over pure DCA but I still think it's not as simple as it seems to switch from pure DCA to 'better' DCA.

I always support pure DCA, which is buying whenever you set, be it a fixed time, which is what I do, more or less beginning of the month when salary comes, or a fixed amount, which is what I consider my small earnings on forum, sig campaign, which is fixed at $$.

Sure, you can view trends and predict and time, but that asks for additional management. First is to monitor market, and this seems easy, but anyone who traded knows the temptation is to get smart and then start to measure, and try to perform better. This alone is time consuming and possibly gets into emotion. It's very easy to get dragged in and get absorbed believe me. Even not to mention distraction of altcoins!!

Second, less of issue but still management, is to set aside cash to buy, and to use it up in low price. That's also very hard to do with discipline.

I like pure DCA because it removes me from market monitoring, therefore removing emotional aspect.  I don't even look at price anymore when I buy, or when I receive. And if ATH comes, I just try to sell whatever I can for a nice treat, save it for when big crash comes.

You may not make it the most effective, but all that time saved, all that thinking taken out, you focus on other meaningful things, like study and work and leisure.

People really don't know how to estimate the emotional and time investment of monitoring markets, that's the main issue.

██
██
██
██
██
██
██
██
██
██
██
██
██
... LIVECASINO.io    Play Live Games with up to 20% cashback!...██
██
██
██
██
██
██
██
██
██
██
██
██
Patrol69
Sr. Member
****
Offline Offline

Activity: 546
Merit: 274


View Profile
April 16, 2024, 11:03:01 AM
 #39

Dollar Cost Averaging DCA investment method, this method is definitely the best and very effective method for investing. Basically in this method an investor can invest quite easily and he gets the opportunity to invest as and when he wants.  Currently most of the investors are investing in this method. The DCA investment method is generally more effective when an investor invests in a long-term plan. This investment strategy comes in handy when the investor invests in long term investment plans. I follow the DCA investment methodology in terms of holding my investments and maintaining investment consistency.

.
SPIN

       ▄▄▄██████████▄▄▄
     ▄███████████████████▄
   ▄██████████▀▀███████████▄
   ██████████    ███████████
 ▄██████████      ▀█████████▄
▄██████████        ▀█████████▄
█████████▀▀   ▄▄    ▀▀▀███████
█████████▄▄  ████▄▄███████████
███████▀  ▀▀███▀      ▀███████
▀█████▀          ▄█▄   ▀█████▀
 ▀███▀   ▄▄▄  ▄█████▄   ▀███▀
   ██████████████████▄▄▄███
   ▀██████████████████████▀
     ▀▀████████████████▀▀
        ▀▀▀█████████▀▀▀
.
RIUM
.
███
███
███
███
███
███
███
███
███
███
███
███
SAFE GAMES
WITH WITHDRAWALS
       ▄▀▀▀▀▀▀▄▄▄▄
 ▄▀▀▀▀▀▀▀▀▀▀▀▀▄  ▀▀▄
█    ▄         █   ▀▌
█   █ █        █    ▌
█      ▄█▄     █   ▐
█     ▄███▄    █   ▌
█    ███████   █  ▐
█    ▀▀ █ ▀▀   █  ▌
█     ▄███▄    █ ▐
█              █▐▌
█        █ █   █▌
 ▀▄▄▄▄▄▄▄▄█▄▄▄▀
       ▄▀▀▀▀▀▀▄▄▄▄
 ▄▀▀▀▀▀▀▀▀▀▀▀▀▄  ▀▀▄
█    ▄         █   ▀▌
█   █ █        █    ▌
█      ▄█▄     █   ▐
█     ▄███▄    █   ▌
█    ███████   █  ▐
█    ▀▀ █ ▀▀   █  ▌
█     ▄███▄    █ ▐
█              █▐▌
█        █ █   █▌
 ▀▄▄▄▄▄▄▄▄█▄▄▄▀
.
███
███
███
███
███
███
███
███
███
███
███
███
▄▀▀▀


▀▄▄▄
▀▀▀▀▀▀▀▀▀▀▀▀▀▀▀▀▀▀▀▀▀▀▀▀▀▀▀▀▀▀▀▀▀▀▀▀▀▀▀▀▀▀▀▀▀▀
.
SIGN UP


▄▄▄▄▄▄▄▄▄▄▄▄▄▄▄▄▄▄▄▄▄▄▄▄▄▄▄▄▄▄▄▄▄▄▄▄▄▄▄▄▄▄▄▄▄▄
▀▀▀▄


▄▄▄▀
jaberwock
Legendary
*
Offline Offline

Activity: 2534
Merit: 1073


View Profile
April 20, 2024, 05:23:23 AM
 #40

Dollar Cost Averaging DCA investment method, this method is definitely the best and very effective method for investing. Basically in this method an investor can invest quite easily and he gets the opportunity to invest as and when he wants.  Currently most of the investors are investing in this method. The DCA investment method is generally more effective when an investor invests in a long-term plan. This investment strategy comes in handy when the investor invests in long term investment plans. I follow the DCA investment methodology in terms of holding my investments and maintaining investment consistency.
There are other methods to invest and some investors can prefer them over the Dollar Cost Averaging. In DCA we are buying no matter what the price is. Investing in Bitcoin is an opportunity already but another opportunity is if you can wait for the price to dip more and buy more coins.

We cannot please anyone anyway and they are still patient when they HODL the coins that they DCA long enough and it's a must because sometimes they can buy even when the price is a bit high. Consistency is important too in each good thing that we are doing. It helps us to maintain the momentum and we are sure that we can always reap greater benefits.

Pages: « 1 [2] 3 »  All
  Print  
 
Jump to:  

Powered by MySQL Powered by PHP Powered by SMF 1.1.19 | SMF © 2006-2009, Simple Machines Valid XHTML 1.0! Valid CSS!