|
hacknoid (OP)
|
 |
July 30, 2014, 02:34:09 PM |
|
OK, so many of us love looking at trends and graphs. And for those that do, here is an interesting little tidbit I noticed yesterday. Take it FWIW, but it's interesting, to say the least. I was looking at the year-over-year exponential price graph as shown below: 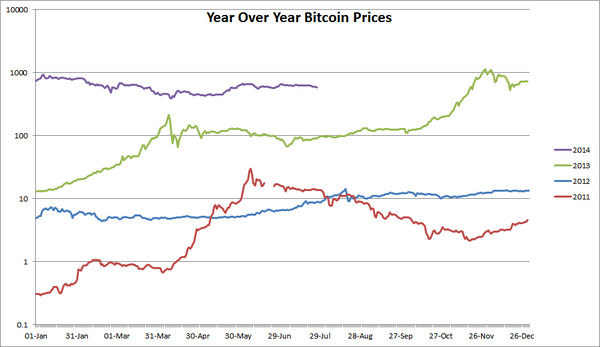 Notice anything interesting? 2014 looks a lot more like 2012 than 2013. And for that matter, 2013 looks a lot like 2011. This becomes even more apparant if you adjust the data from the last 2 years to line up the peaks (adjust by 61 days): 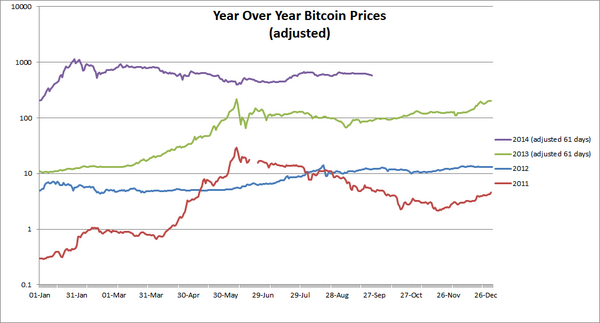 Taking this data, I created a longer cycle graph. I present to you - the Bitcoin 670-day price cycle! 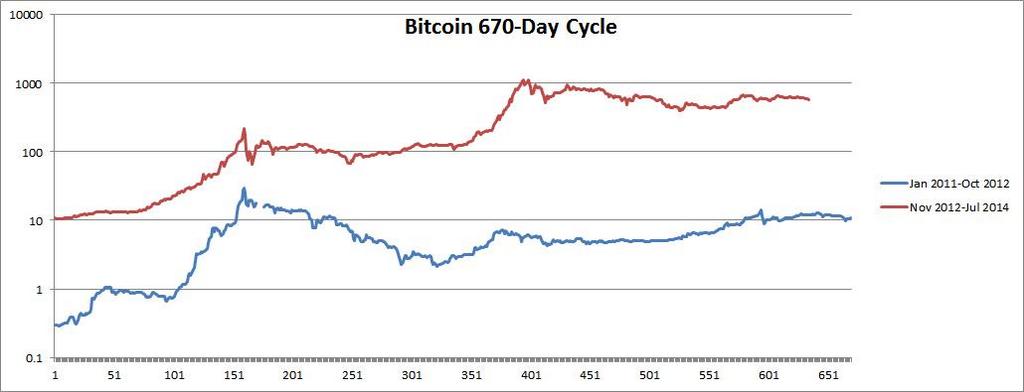 Of course, with only two cycles to look at this means almost nothing, but I do find it interesting that it correlates better than trying to work in the 33-week cycle everyone talks about. This trend also corresponds to a longer "development" phase between each major peak. And it also means we are about 110 days from the start of the next run-up. Have fun with it.... |
|
|
|
|
|
|
The grue lurks in the darkest places of the earth. Its favorite diet is adventurers, but its insatiable appetite is tempered by its fear of light. No grue has ever been seen by the light of day, and few have survived its fearsome jaws to tell the tale.
|
|
|
Advertised sites are not endorsed by the Bitcoin Forum. They may be unsafe, untrustworthy, or illegal in your jurisdiction.
|
|
|
|
fonsie
|
|
July 30, 2014, 02:42:06 PM |
|
Of course, with only two cycles to look at this means almost nothing
^ And you better left it at that. Would have saved you the time spent on painting those pictures above. |
I decided to no longer use a signature, because people were trolling me about it.
|
|
|
|
fallinglantern
|
|
July 30, 2014, 03:09:50 PM |
|
It's definitely interesting to take a longer view on price movements over time. If the observations hold, we should be launching another bubble by year end. I'd be okay with that.
|
|
|
|
|
|
fonsie
|
|
July 30, 2014, 03:33:38 PM |
|
Either everybody buys before the next bubble in anticipation of one -> bubble starts too early
Either everybody waits until the bubble begins in anticipation of one -> bubble starts too late
Either way it won't happen when it's expected and you should have bought before it actually happens.
|
I decided to no longer use a signature, because people were trolling me about it.
|
|
|
notme
Legendary

 Offline Offline
Activity: 1904
Merit: 1002

|
|
July 30, 2014, 03:44:13 PM |
|
Either everybody buys before the next bubble in anticipation of one -> bubble starts too early
Either everybody waits until the bubble begins in anticipation of one -> bubble starts too late
Either way it won't happen when it's expected and you should have bought before it actually happens.
Or maybe, just maybe, the hundreds of thousands of individual actors with different priorities, beliefs, and understanding will somehow manage to behave differently from each other and the two camps cancel each other out, starting the bubble right on time. |
|
|
|
wobber
Legendary
Offline
Activity: 1064
Merit: 1001
|
|
July 30, 2014, 03:52:31 PM |
|
While I respect the work you have done, I cannot help to say that we have too few data to say that bitcoin follows a certain cycle. The only path I see now is downwards, and not because bitcoin is overvalued or because it has not so many uses, but because our speculator friends freak out and sell.
1 Bitcoin should be, as of now, because of the economic set the world is in, at over 2000, more than gold. Actually I say gibberish, bitcoin should be used everywhere where people want freedom from the goverments, making the USD price irrelevant.
Stop using banks, VISA, Mastercard and Paypal and we'll have a new world.
|
If you hate me, you can spam me here: 19wdQNKjnATkgXvpzmSrkSYhJtuJWb8mKs
|
|
|
|
InwardContour
|
|
July 30, 2014, 03:58:02 PM |
|
I agree with this price cycle view, according to the charts we are about in the middle between the last bubble and the next one,
so let's just hold and wait for the ( I hope) huge rally of late 2014.
|
|
|
|
|
|
fonsie
|
|
July 30, 2014, 04:15:58 PM |
|
Either everybody buys before the next bubble in anticipation of one -> bubble starts too early
Either everybody waits until the bubble begins in anticipation of one -> bubble starts too late
Either way it won't happen when it's expected and you should have bought before it actually happens.
Or maybe, just maybe, the hundreds of thousands of individual actors with different priorities, beliefs, and understanding will somehow manage to behave differently from each other and the two camps cancel each other out, starting the bubble right on time. If all the involved actors would cancel each other, the prise would remain the same. But I get what you are saying, but you have to admit that it sounds quite stupid... 100 000 people equally spread 50/50, to buy exactly on the moment some chart predicted it would. |
I decided to no longer use a signature, because people were trolling me about it.
|
|
|
|
ensurance982
|
|
July 30, 2014, 05:44:06 PM |
|
Wow, I don't really know if this should make us feel excited about an incoming bubble, a bit later than previously expected, or if we are now resorting to tweaking charts until they support what we want them to   |
We Support Currencies: BTC, LTC, USD, EUR, GBP
|
|
|
|
hacknoid (OP)
|
|
July 30, 2014, 07:05:32 PM |
|
Wow, I don't really know if this should make us feel excited about an incoming bubble, a bit later than previously expected, or if we are now resorting to tweaking charts until they support what we want them to There seem to be two ways to do the analysis - analyze the fundamentals and determine where the price should be, then compare that to the real numbers, or look at history of actual numbers and apply trends to them, to see where we will be going. My analysis above is clearly the latter, and simply an observation of the trend - I'll freely say that I have no clue where we are headed! It'll be interesting to see if it follows the longer term trend. Honestly, my gut reaction is I cannot see how Bitcoin price can follow any sort of predictable pattern. There are just too many factors (news, regulation, speculation, legalization, banning, permitting, adoption, etc.) that would seem to have effect, but underlying it all is basic human psychology. And maybe that is predictable to a certain extent - after a certain period of time, I believe we come to accept that the current price is reasonable, and so we can establish a new baseline. And that probably takes a certain period of time. Also, while people are crazy speculating and driving the price up people get distracted from building new technology and doing research. When things settle down we get into a new period of innovation where people can focus again. Are these quantifiable? I don't know... I guess maybe we'll know better if the cycle repeats (670 days or something different). |
|
|
|
|
ensurance982
|
|
July 30, 2014, 07:27:28 PM |
|
Wow, I don't really know if this should make us feel excited about an incoming bubble, a bit later than previously expected, or if we are now resorting to tweaking charts until they support what we want them to There seem to be two ways to do the analysis - analyze the fundamentals and determine where the price should be, then compare that to the real numbers, or look at history of actual numbers and apply trends to them, to see where we will be going. My analysis above is clearly the latter, and simply an observation of the trend - I'll freely say that I have no clue where we are headed! It'll be interesting to see if it follows the longer term trend. Honestly, my gut reaction is I cannot see how Bitcoin price can follow any sort of predictable pattern. There are just too many factors (news, regulation, speculation, legalization, banning, permitting, adoption, etc.) that would seem to have effect, but underlying it all is basic human psychology. And maybe that is predictable to a certain extent - after a certain period of time, I believe we come to accept that the current price is reasonable, and so we can establish a new baseline. And that probably takes a certain period of time. Also, while people are crazy speculating and driving the price up people get distracted from building new technology and doing research. When things settle down we get into a new period of innovation where people can focus again. Are these quantifiable? I don't know... I guess maybe we'll know better if the cycle repeats (670 days or something different). Didn't mean to rain on your parade! I think all those speculations are interesting and a lot of people have put effort in making one of their own. I don't know what'll come either, and can only hope for the best, so your guess is as good as mine. You did have some quite unique ideas. |
We Support Currencies: BTC, LTC, USD, EUR, GBP
|
|
|
notme
Legendary
Offline
Activity: 1904
Merit: 1002
|
|
July 30, 2014, 08:16:56 PM |
|
Either everybody buys before the next bubble in anticipation of one -> bubble starts too early
Either everybody waits until the bubble begins in anticipation of one -> bubble starts too late
Either way it won't happen when it's expected and you should have bought before it actually happens.
Or maybe, just maybe, the hundreds of thousands of individual actors with different priorities, beliefs, and understanding will somehow manage to behave differently from each other and the two camps cancel each other out, starting the bubble right on time. If all the involved actors would cancel each other, the prise would remain the same. But I get what you are saying, but you have to admit that it sounds quite stupid... 100 000 people equally spread 50/50, to buy exactly on the moment some chart predicted it would. I was trying to take your polar view and break it up to show you the actual continuum. Don't just stare at the middle. There are millions of shades of grey between black and white. |
|
|
|
|
fonsie
|
|
July 30, 2014, 08:25:47 PM |
|
All I was trying to say is that people are so focused on charts and what not for bubbles to appear, that they probably won't appear because of that.
That a new one will appear no doubt about it, but expecting it to happen x number of days in between, that's just silly.
|
I decided to no longer use a signature, because people were trolling me about it.
|
|
|
Anduck
Legendary
Offline
Activity: 1511
Merit: 1072
quack
|
|
July 30, 2014, 09:40:07 PM |
|
Correlates well, yes.. But with just so small amount of data it's quite easy to find matching charts.
|
|
|
|
|
DjPxH
|
|
July 30, 2014, 09:42:01 PM |
|
Correlates well, yes.. But with just so small amount of data it's quite easy to find matching charts.
But hey, cut him some slack! People are always looking for patterns in the bitcoin charts. But this is a very well crafted example of it! |
▄▄▄▄▄▄▄▄▄▄▄▄▄▄▄▄▄▄▄▄▄▄▄▄▄▄▄▄▄▄▄▄▄▄▄▄▄▄▄▄▄
PRIMEDICE The Premier Bitcoin Gambling Experience @PrimeDice
▀▀▀▀▀▀▀▀▀▀▀▀▀▀▀▀▀▀▀▀▀▀▀▀▀▀▀▀▀▀▀▀▀▀▀▀▀▀▀▀▀
|
|
|
|
hacknoid (OP)
|
|
July 30, 2014, 10:19:41 PM |
|
Didn't mean to rain on your parade! I think all those speculations are interesting and a lot of people have put effort in making one of their own. I don't know what'll come either, and can only hope for the best, so your guess is as good as mine. You did have some quite unique ideas.
Hey - no worries! As I say - nobody really knows the future, and there certainly isn't enough information to draw any conclusions (and then there's the caveat that always applies - past results are not indicative of future performance). I admit it's just an interesting pattern, and it just shows that maybe it's not a 33-week cycle that everyone is expecting. |
|
|
|
Febo
Legendary
Offline
Activity: 2730
Merit: 1288
|
|
August 02, 2014, 04:36:05 PM |
|
2 cycles cant be a trend. you need to make at least 3.
so use year
2010&2011
2012&2013
2014&and just predict the year 2015 then.
Come on off to work!
|
|
|
|
|
azguard
Legendary
Offline
Activity: 1484
Merit: 1001
Crypto-News.net: News from Crypto World
|
|
August 02, 2014, 08:03:08 PM |
|
Nice graph.
All to say is this from start of this 2014 year, to many big companies are involved in BTC story that can implement market price to change.
Think that end of this year and first quarter of next will balance place in long term.
|
▄▄▄██████▄▄▄
▄██████████████████▄
▄████████████████████████▄
▄▄ ▄████████████████████████████▄
███████████████████████████████████▄
▀▀█████████████████████████████████▄
██████████████████████████████████
██████████████████████████████████
██████████████████████████████████
██████████████████████████████████
▀████████████████████████████████▀
▀██████████████████████████████▀
▀▀██████████████████████████▀
▀██████████████████████▀
▀▀▀████████████▀▀▀ | .
| .....█
.....█
.....█
.....█
.....█
.....█ | | █
█
█
█
█
█ |
|
|
|
|
giveBTCpls
|
|
August 03, 2014, 10:04:32 PM |
|
Well see continued stability until dumbasses outside the BTC choo choo train realize they are late as big players jump in.
|
|
|
|
wachtwoord
Legendary
Offline
Activity: 2324
Merit: 1125
|
|
August 03, 2014, 11:00:38 PM |
|
Cool graph  As long as everyone takes this for what it is: a nice idea which needs further confirmation. |
|
|
|
|
|
bassclef
|
|
August 04, 2014, 12:30:19 AM |
|
Well see continued stability until dumbasses outside the BTC choo choo train realize they are late as big players jump in.
This is how it goes every time. Once the train gets going it gets more and more expensive to jump on. We are still refueling and doing engine maintenance IMO. Once we actually leave the station price will be around $800. |
|
|
|
|
Skele
Full Member
 Offline
Activity: 224
Merit: 100
VocalPlatform.com
|
|
August 04, 2014, 12:59:18 AM |
|
You all should stick to helping bitcoin adoption not only waiting for next bubble, or triying to predict it.
|
|
|
|
|
|
hacknoid (OP)
|
|
August 04, 2014, 01:21:06 AM |
|
You all should stick to helping bitcoin adoption not only waiting for next bubble, or triying to predict it.
But it's fun trying to predict the future!  And who says we aren't actively doing something to promote adoption? I chat it up every chance I get (with merchants and everyone else), and have more than a few projects in the works. One does not preclude the other. Relax, and have fun with it. |
|
|
|
wachtwoord
Legendary
Offline
Activity: 2324
Merit: 1125
|
|
August 06, 2014, 02:05:20 AM |
|
You all should stick to helping bitcoin adoption not only waiting for next bubble, or triying to predict it.
But it's fun trying to predict the future! And who says we aren't actively doing something to promote adoption? I chat it up every chance I get (with merchants and everyone else), and have more than a few projects in the works. One does not preclude the other. Relax, and have fun with it. Keep trying to predict and try to see patterns. If the future shows you you're wrong often enough you'll learn to deal with overconfidence in being able to spot patterns any human possesses. |
|
|
|
|
money420weed
Member
Offline
Activity: 78
Merit: 10
|
|
August 06, 2014, 02:49:33 AM |
|
You all should stick to helping bitcoin adoption not only waiting for next bubble, or triying to predict it.
But it's fun trying to predict the future! It is very difficult to attempt to predict the future. There are many people that try this (financial analysts) and they only make very broad predictions, but they do not have a very good track record. It is very unlikely that you will be able to make these long term of predictions with any level of accuracy. |
|
|
|
|
|
sed
|
|
August 06, 2014, 03:08:02 AM |
|
Of course, with only two cycles to look at this means almost nothing
^ And you better left it at that. Would have saved you the time spent on painting those pictures above. Nah, the pictures made the post! And FWIW, it *is* spookily similar Now we just have to wait 2 more years to see if the prediction is borne out! |
|
|
|
|
|
Wary
|
|
August 18, 2014, 09:29:03 AM |
|
Cool graph As long as everyone takes this for what it is: a nice idea which needs further confirmation.  The small dip in the end of blue line correspond to current dip and happened exactly 670 days ago  And this 670-day period is good fit with risto's "2-year pregnancy" theory. |
Fairplay medal of dnaleor's trading simulator.
|
|
|
zby
Legendary
Offline
Activity: 1592
Merit: 1001
|
|
August 18, 2014, 09:49:07 AM |
|
Cool graph As long as everyone takes this for what it is: a nice idea which needs further confirmation. The small dip in the end of blue line correspond to current dip and happened exactly 670 days ago And this 670-day period is good fit with risto's "2-year pregnancy" theory. That red circle on the blue line is in 2012 and $2 happened in 2011. |
|
|
|
|
|
gjgjg
|
|
August 18, 2014, 10:21:48 AM |
|
You could be on to something there, lets wait and see, but it does look like it has potential.
Who cares if the price moves to fit the chart because the people are buying expecting a chart fulfilled prophecy or if there really is a natural cycle set that would have occurred without people knowing the charts. Either way, things move in cycles in nature all the time, and sometimes the cycle looks too easy to fit because it fits. Sometimes things change when you observe them:p
|
██████████████████████████████████████████████████████████████████████████████████████████████████████████████████████████████████████████████████████████████████████████████████████████████████████████████████████████████████████████████████████████████████████████████████████████████████████████████████████████████████████████████████████████████████████████████████████████████████████████████████████████████████████████████████████████████████████████████████████████████████████████████████████████████████████████████████████████████████████████████████████████████████████████████████████████████████████████████████████████████████████████████████████████████████████████████████████████████████████████████████████████████████████████████████████████████████████████████████████████████████████████████████████████████████████████████████████████████████████████████████ |
|
|
holomen
Newbie
Offline
Activity: 54
Merit: 0
|
|
November 21, 2014, 08:52:33 AM |
|
Hacknoid,
Could you extrapolate the graph till current date. Interesting where we are in the cycle now.
|
|
|
|
|
|
8up
|
|
November 21, 2014, 12:47:58 PM |
|
Hacknoid,
Could you extrapolate the graph till current date. Interesting where we are in the cycle now.
If OP is right. Bubble is about to start from here. |
Always wrong until not.
|
|
|
|
hacknoid (OP)
|
|
November 21, 2014, 04:00:56 PM |
|
Well, it's been interesting to watch the price cycle, but just before I post the updated chart to reflect the trends to today, I just wanted to reiterate a few things. First, I'm not saying this is what will happen. The price will be what it will be. But people spend so much time saying stuff to compare year to year, like 365 days is some magic number, when it really doesn't mean much (well, other than it being an Earth year). Cycles in nature happen all the time, but time periods vary. Risto's 2-year theory makes a lot of sense to me, and I do think if you objectively look at the trends we are more likely on some sort of longer cycle than one year. Is it 670 days? Who knows? Second, remember this is the speculation subforum. We're always voting on what we think the price will be in a month, a year, 5 years. Speculation is exactly that. I hope nobody takes the chart and bets money on it (I wouldn't, although I would be happy for it to pan out like this!) Anyways, time will tell what price will do. So many factors involved nobody knows for sure, but let's wait and see. So, here's the updated chart: 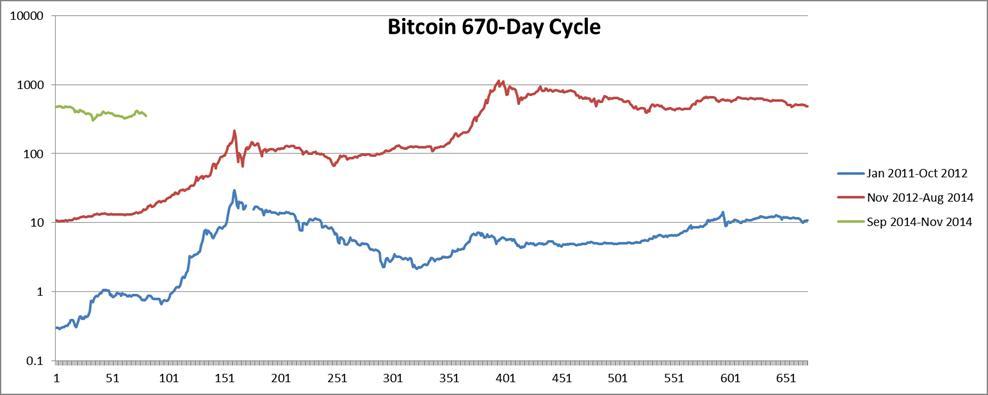 Now some fun  Comparing the plots, we experienced the same slight downturn at the end of the second (just-ended) cycle that we did at the end of the first cycle. All three cycles have begun with a more-or-less sideways trend. I actually thought the rise up about 10 days ago would coincide nicely with when we were "due" for a start to the run-up, but alas, it was not to be. If you want to use this as a crystal ball, comparing the peaks we are about 79 days from the next peak. If something like that happens, a run-up can feel free to start any time now, depending on how steep a slope it takes. Cheers |
|
|
|
|
SmoothCurves
|
|
November 21, 2014, 06:48:27 PM |
|
Well, it's been interesting to watch the price cycle, but just before I post the updated chart to reflect the trends to today, I just wanted to reiterate a few things. First, I'm not saying this is what will happen. The price will be what it will be. But people spend so much time saying stuff to compare year to year, like 365 days is some magic number, when it really doesn't mean much (well, other than it being an Earth year). Cycles in nature happen all the time, but time periods vary. Risto's 2-year theory makes a lot of sense to me, and I do think if you objectively look at the trends we are more likely on some sort of longer cycle than one year. Is it 670 days? Who knows? Second, remember this is the speculation subforum. We're always voting on what we think the price will be in a month, a year, 5 years. Speculation is exactly that. I hope nobody takes the chart and bets money on it (I wouldn't, although I would be happy for it to pan out like this!) Anyways, time will tell what price will do. So many factors involved nobody knows for sure, but let's wait and see. So, here's the updated chart: Now some fun Comparing the plots, we experienced the same slight downturn at the end of the second (just-ended) cycle that we did at the end of the first cycle. All three cycles have begun with a more-or-less sideways trend. I actually thought the rise up about 10 days ago would coincide nicely with when we were "due" for a start to the run-up, but alas, it was not to be. If you want to use this as a crystal ball, comparing the peaks we are about 79 days from the next peak. If something like that happens, a run-up can feel free to start any time now, depending on how steep a slope it takes. Cheers Thanks for the post. Very interesting. 79 days from today would be February 8th 2015. Now, it could be that we are on a longer cycle this time around...if so - let's multiply 79 days by fib 1.68 and we get a date of April 2 2015. |
|
|
|
|
wachtwoord
Legendary
Offline
Activity: 2324
Merit: 1125
|
|
November 22, 2014, 04:41:55 PM |
|
Thanks for the post. Very interesting. 79 days from today would be February 8th 2015. Now, it could be that we are on a longer cycle this time around...if so - let's multiply 79 days by fib 1.68 and we get a date of April 2 2015.
Yes, cycles will exist but it's unlikely the period of these will be constant. Still interesting though |
|
|
|
|
smoothie
Legendary
Offline
Activity: 2492
Merit: 1473
LEALANA Bitcoin Grim Reaper
|
|
November 22, 2014, 09:41:09 PM |
|
Given how the price hasn't been falling really hard but more of a back and forth in the recent months/weeks I'd say we are in a stabilizing phase which will slowly but surely end on the upside in the next 80-120 days.
|
███████████████████████████████████████
,╓p@@███████@╗╖,
,p████████████████████N,
d█████████████████████████b
d██████████████████████████████æ
,████²█████████████████████████████,
,█████ ╙████████████████████╨ █████y
██████ `████████████████` ██████
║██████ Ñ███████████` ███████
███████ ╩██████Ñ ███████
███████ ▐▄ ²██╩ a▌ ███████
╢██████ ▐▓█▄ ▄█▓▌ ███████
██████ ▐▓▓▓▓▌, ▄█▓▓▓▌ ██████─
▐▓▓▓▓▓▓█,,▄▓▓▓▓▓▓▌
▐▓▓▓▓▓▓▓▓▓▓▓▓▓▓▓▓▌
▓▓▓▓▓▓▓▓▓▓▓▓▓▓▓▓▓▓▓▓▓▓▓▓▓▓▓▓▓▓▓▓─
²▓▓▓▓▓▓▓▓▓▓▓▓▓▓▓▓▓▓▓▓▓▓▓▓▓▓▓▓╩
▀▓▓▓▓▓▓▓▓▓▓▓▓▓▓▓▓▓▓▓▓▓▓▀
²▀▀▓▓▓▓▓▓▓▓▓▓▓▓▀▀`
²²²
███████████████████████████████████████
| . ★☆ WWW.LEALANA.COM My PGP fingerprint is A764D833. History of Monero development Visualization ★☆ .
LEALANA BITCOIN GRIM REAPER SILVER COINS.
|
|
|
|
Useli Violent
Member
Offline
Activity: 68
Merit: 10
|
|
November 22, 2014, 09:50:08 PM |
|
Well, it's been interesting to watch the price cycle, but just before I post the updated chart to reflect the trends to today, I just wanted to reiterate a few things. First, I'm not saying this is what will happen. The price will be what it will be. But people spend so much time saying stuff to compare year to year, like 365 days is some magic number, when it really doesn't mean much (well, other than it being an Earth year). Cycles in nature happen all the time, but time periods vary. Risto's 2-year theory makes a lot of sense to me, and I do think if you objectively look at the trends we are more likely on some sort of longer cycle than one year. Is it 670 days? Who knows? Second, remember this is the speculation subforum. We're always voting on what we think the price will be in a month, a year, 5 years. Speculation is exactly that. I hope nobody takes the chart and bets money on it (I wouldn't, although I would be happy for it to pan out like this!) Anyways, time will tell what price will do. So many factors involved nobody knows for sure, but let's wait and see. So, here's the updated chart: Now some fun Comparing the plots, we experienced the same slight downturn at the end of the second (just-ended) cycle that we did at the end of the first cycle. All three cycles have begun with a more-or-less sideways trend. I actually thought the rise up about 10 days ago would coincide nicely with when we were "due" for a start to the run-up, but alas, it was not to be. If you want to use this as a crystal ball, comparing the peaks we are about 79 days from the next peak. If something like that happens, a run-up can feel free to start any time now, depending on how steep a slope it takes. Cheers Thanks for the post. Very interesting. 79 days from today would be February 8th 2015. Now, it could be that we are on a longer cycle this time around...if so - let's multiply 79 days by fib 1.68 and we get a date of April 2 2015. Very interesting. Marking post for future reference. |
|
|
|
azguard
Legendary
Offline
Activity: 1484
Merit: 1001
Crypto-News.net: News from Crypto World
|
|
November 25, 2014, 12:07:34 PM |
|
Well, it's been interesting to watch the price cycle, but just before I post the updated chart to reflect the trends to today, I just wanted to reiterate a few things. First, I'm not saying this is what will happen. The price will be what it will be. But people spend so much time saying stuff to compare year to year, like 365 days is some magic number, when it really doesn't mean much (well, other than it being an Earth year). Cycles in nature happen all the time, but time periods vary. Risto's 2-year theory makes a lot of sense to me, and I do think if you objectively look at the trends we are more likely on some sort of longer cycle than one year. Is it 670 days? Who knows? Second, remember this is the speculation subforum. We're always voting on what we think the price will be in a month, a year, 5 years. Speculation is exactly that. I hope nobody takes the chart and bets money on it (I wouldn't, although I would be happy for it to pan out like this!) Anyways, time will tell what price will do. So many factors involved nobody knows for sure, but let's wait and see. So, here's the updated chart: Now some fun Comparing the plots, we experienced the same slight downturn at the end of the second (just-ended) cycle that we did at the end of the first cycle. All three cycles have begun with a more-or-less sideways trend. I actually thought the rise up about 10 days ago would coincide nicely with when we were "due" for a start to the run-up, but alas, it was not to be. If you want to use this as a crystal ball, comparing the peaks we are about 79 days from the next peak. If something like that happens, a run-up can feel free to start any time now, depending on how steep a slope it takes. Cheers Thanks for the post. Very interesting. 79 days from today would be February 8th 2015. Now, it could be that we are on a longer cycle this time around...if so - let's multiply 79 days by fib 1.68 and we get a date of April 2 2015. Yea this is great we can all get some big time btc or some other crypto. Cuz in btc goes up all alts go up. Nice graphic and will keep my eye on this. |
▄▄▄██████▄▄▄
▄██████████████████▄
▄████████████████████████▄
▄▄ ▄████████████████████████████▄
███████████████████████████████████▄
▀▀█████████████████████████████████▄
██████████████████████████████████
██████████████████████████████████
██████████████████████████████████
██████████████████████████████████
▀████████████████████████████████▀
▀██████████████████████████████▀
▀▀██████████████████████████▀
▀██████████████████████▀
▀▀▀████████████▀▀▀ | .
| .....█
.....█
.....█
.....█
.....█
.....█ | | █
█
█
█
█
█ |
|
|
|
|
bajlox
|
|
November 25, 2014, 12:09:32 PM |
|
Graph is cool and look promising with same pattern. Hope to see this happen in first quarter of 2015. if graphic is correct and pattern is the same. |
|
|
|
|
keystroke
|
|
November 25, 2014, 12:54:57 PM |
|
Nice post but Konrad S. Graf should be credited as well as he created the original YoY graphs. www.konradsgraf.com |
"The difference between a castle and a prison is only a question of who holds the keys."
|
|
|
wobber
Legendary
Offline
Activity: 1064
Merit: 1001
|
|
November 25, 2014, 04:11:15 PM |
|
 Not exactly trollish but I think we'll see something like this. First 2 plots seem similar but nothing points to a third one happening in the same manner |
If you hate me, you can spam me here: 19wdQNKjnATkgXvpzmSrkSYhJtuJWb8mKs
|
|
|
|
|
|
keystroke
|
|
November 25, 2014, 07:33:35 PM |
|
+1 |
"The difference between a castle and a prison is only a question of who holds the keys."
|
|
|
|
keystroke
|
|
March 03, 2015, 10:42:59 AM |
|
Can we get an updated graph?
|
"The difference between a castle and a prison is only a question of who holds the keys."
|
|
|
HarmonLi
Sr. Member
Offline
Activity: 350
Merit: 250
Honest 80s business!
|
|
March 03, 2015, 03:04:55 PM |
|
Can we get an updated graph?
Yeah that would be interesting! We actually went down quite a bit form the price in late July 2014! I think this doesn't match up to any previous performance! |
|
|
|
Kipsy89
Sr. Member
Offline
Activity: 280
Merit: 250
Relax!
|
|
March 03, 2015, 03:46:02 PM |
|
Yeah, please provide an updated version, I think this looks very interesting. I like all those graphs and keep thinking that they're a good indicator of what's to come since people act on them - a self-fulfilling prophecy just like TA!
|
|
|
|
azguard
Legendary
Offline
Activity: 1484
Merit: 1001
Crypto-News.net: News from Crypto World
|
|
March 03, 2015, 05:25:49 PM |
|
agreed update graph will give more conversation and speculation on price pls add it
|
▄▄▄██████▄▄▄
▄██████████████████▄
▄████████████████████████▄
▄▄ ▄████████████████████████████▄
███████████████████████████████████▄
▀▀█████████████████████████████████▄
██████████████████████████████████
██████████████████████████████████
██████████████████████████████████
██████████████████████████████████
▀████████████████████████████████▀
▀██████████████████████████████▀
▀▀██████████████████████████▀
▀██████████████████████▀
▀▀▀████████████▀▀▀ | .
| .....█
.....█
.....█
.....█
.....█
.....█ | | █
█
█
█
█
█ |
|
|
|
|
sed
|
|
March 03, 2015, 07:38:04 PM |
|
Yeah, please provide an updated version, I think this looks very interesting. I like all those graphs and keep thinking that they're a good indicator of what's to come since people act on them - a self-fulfilling prophecy just like TA!
I like the thought of influencing people by telling them the price cycle to expect then they just do it. Still, what's the "TA"? I didn't understand that reference. |
|
|
|
|
|
hacknoid (OP)
|
|
March 03, 2015, 08:02:59 PM |
|
I was just thinking about this this week actually... Sure, I'll do up an updated graph either tonight or tomorrow. I know it won't match at this point (we're past the point where the old peaks aligned), but let's see what it looks like...
|
|
|
|
BitCoinNutJob
Legendary
Offline
Activity: 1316
Merit: 1000
|
|
March 03, 2015, 10:53:30 PM |
|
agreed update graph will give more conversation and speculation on price pls add it
Agreed, looks like the price is trying to get back and stay into the long term trend atm. If we can keep up on up from here over next month things will be looking great. |
|
|
|
|
|
hacknoid (OP)
|
|
March 04, 2015, 05:34:33 PM |
|
OK, as requested here is the updated graph to 4 March 2015:  Now clearly we are falling behind the original trend, so the model is falling apart (I can't help but notice how much this graph actually is starting to look like Wobber's prediction!). However, I think there is room to wiggle with. For example, if I align the initial high points of the second peak in each cycle, we get a 694-day cycle which is still OK:  In this model, the run-up to the second peaks align across both previous cycles, and the general run-up to the first peaks also is more or less in agreement. While we have been in a decline over the first part of the current (third) cycle, if we are indeed currently seeing a turnaround and a general upswing that would be in agreement with this revised model. As I said before, I am mainly having some fun with this. The data is what it is, but I am not (yet) convinced that this is really indicative of a recurring pattern, although I still believe there are natural patterns that will occur in nature (that is the basis for all TA, now, isn't it?) |
|
|
|
|
hacknoid (OP)
|
|
November 24, 2015, 12:42:22 AM |
|
I'm going to close off this thread by posting some final updates on the graphs; by now it's clear the trend was not followed, however, it has led me to do some more analysis and come up with some more interesting results, discussed in this new thread. Here are the final graphs for the 670 day and 694 day price cycles, showing them breaking down:   |
|
|
|
NorrisK
Legendary
Offline
Activity: 1946
Merit: 1007
|
|
November 24, 2015, 10:36:20 PM |
|
Nice work on the graphs. Too bad the trends weren't followed, could have been interesting for many people and their wallets  Maybe a new trend is emerging. |
|
|
|
|
|


