|
bassclef
|
 |
August 04, 2014, 12:30:19 AM |
|
Well see continued stability until dumbasses outside the BTC choo choo train realize they are late as big players jump in.
This is how it goes every time. Once the train gets going it gets more and more expensive to jump on. We are still refueling and doing engine maintenance IMO. Once we actually leave the station price will be around $800. |
|
|
|
|
|
|
|
|
|
|
Advertised sites are not endorsed by the Bitcoin Forum. They may be unsafe, untrustworthy, or illegal in your jurisdiction.
|
|
|
|
|
|
|
Skele
Full Member

 Offline Offline
Activity: 224
Merit: 100
VocalPlatform.com

|
|
August 04, 2014, 12:59:18 AM |
|
You all should stick to helping bitcoin adoption not only waiting for next bubble, or triying to predict it.
|
|
|
|
|
|
hacknoid (OP)
|
|
August 04, 2014, 01:21:06 AM |
|
You all should stick to helping bitcoin adoption not only waiting for next bubble, or triying to predict it.
But it's fun trying to predict the future!  And who says we aren't actively doing something to promote adoption? I chat it up every chance I get (with merchants and everyone else), and have more than a few projects in the works. One does not preclude the other. Relax, and have fun with it. |
|
|
|
wachtwoord
Legendary
 Offline
Activity: 2324
Merit: 1125
|
|
August 06, 2014, 02:05:20 AM |
|
You all should stick to helping bitcoin adoption not only waiting for next bubble, or triying to predict it.
But it's fun trying to predict the future! And who says we aren't actively doing something to promote adoption? I chat it up every chance I get (with merchants and everyone else), and have more than a few projects in the works. One does not preclude the other. Relax, and have fun with it. Keep trying to predict and try to see patterns. If the future shows you you're wrong often enough you'll learn to deal with overconfidence in being able to spot patterns any human possesses. |
|
|
|
|
money420weed
Member
Offline
Activity: 78
Merit: 10
|
|
August 06, 2014, 02:49:33 AM |
|
You all should stick to helping bitcoin adoption not only waiting for next bubble, or triying to predict it.
But it's fun trying to predict the future! It is very difficult to attempt to predict the future. There are many people that try this (financial analysts) and they only make very broad predictions, but they do not have a very good track record. It is very unlikely that you will be able to make these long term of predictions with any level of accuracy. |
|
|
|
|
|
sed
|
|
August 06, 2014, 03:08:02 AM |
|
Of course, with only two cycles to look at this means almost nothing
^ And you better left it at that. Would have saved you the time spent on painting those pictures above. Nah, the pictures made the post! And FWIW, it *is* spookily similar  Now we just have to wait 2 more years to see if the prediction is borne out! |
|
|
|
|
|
Wary
|
|
August 18, 2014, 09:29:03 AM |
|
Cool graph As long as everyone takes this for what it is: a nice idea which needs further confirmation.  The small dip in the end of blue line correspond to current dip and happened exactly 670 days ago  And this 670-day period is good fit with risto's "2-year pregnancy" theory. |
Fairplay medal of dnaleor's trading simulator.
|
|
|
zby
Legendary
Offline
Activity: 1592
Merit: 1001
|
|
August 18, 2014, 09:49:07 AM |
|
Cool graph As long as everyone takes this for what it is: a nice idea which needs further confirmation. The small dip in the end of blue line correspond to current dip and happened exactly 670 days ago And this 670-day period is good fit with risto's "2-year pregnancy" theory. That red circle on the blue line is in 2012 and $2 happened in 2011. |
|
|
|
|
|
gjgjg
|
|
August 18, 2014, 10:21:48 AM |
|
You could be on to something there, lets wait and see, but it does look like it has potential.
Who cares if the price moves to fit the chart because the people are buying expecting a chart fulfilled prophecy or if there really is a natural cycle set that would have occurred without people knowing the charts. Either way, things move in cycles in nature all the time, and sometimes the cycle looks too easy to fit because it fits. Sometimes things change when you observe them:p
|
██████████████████████████████████████████████████████████████████████████████████████████████████████████████████████████████████████████████████████████████████████████████████████████████████████████████████████████████████████████████████████████████████████████████████████████████████████████████████████████████████████████████████████████████████████████████████████████████████████████████████████████████████████████████████████████████████████████████████████████████████████████████████████████████████████████████████████████████████████████████████████████████████████████████████████████████████████████████████████████████████████████████████████████████████████████████████████████████████████████████████████████████████████████████████████████████████████████████████████████████████████████████████████████████████████████████████████████████████████████████████ |
|
|
holomen
Newbie
Offline
Activity: 54
Merit: 0
|
|
November 21, 2014, 08:52:33 AM |
|
Hacknoid,
Could you extrapolate the graph till current date. Interesting where we are in the cycle now.
|
|
|
|
|
|
8up
|
|
November 21, 2014, 12:47:58 PM |
|
Hacknoid,
Could you extrapolate the graph till current date. Interesting where we are in the cycle now.
If OP is right. Bubble is about to start from here. |
Always wrong until not.
|
|
|
|
hacknoid (OP)
|
|
November 21, 2014, 04:00:56 PM |
|
Well, it's been interesting to watch the price cycle, but just before I post the updated chart to reflect the trends to today, I just wanted to reiterate a few things. First, I'm not saying this is what will happen. The price will be what it will be. But people spend so much time saying stuff to compare year to year, like 365 days is some magic number, when it really doesn't mean much (well, other than it being an Earth year). Cycles in nature happen all the time, but time periods vary. Risto's 2-year theory makes a lot of sense to me, and I do think if you objectively look at the trends we are more likely on some sort of longer cycle than one year. Is it 670 days? Who knows? Second, remember this is the speculation subforum. We're always voting on what we think the price will be in a month, a year, 5 years. Speculation is exactly that. I hope nobody takes the chart and bets money on it (I wouldn't, although I would be happy for it to pan out like this!) Anyways, time will tell what price will do. So many factors involved nobody knows for sure, but let's wait and see. So, here's the updated chart: 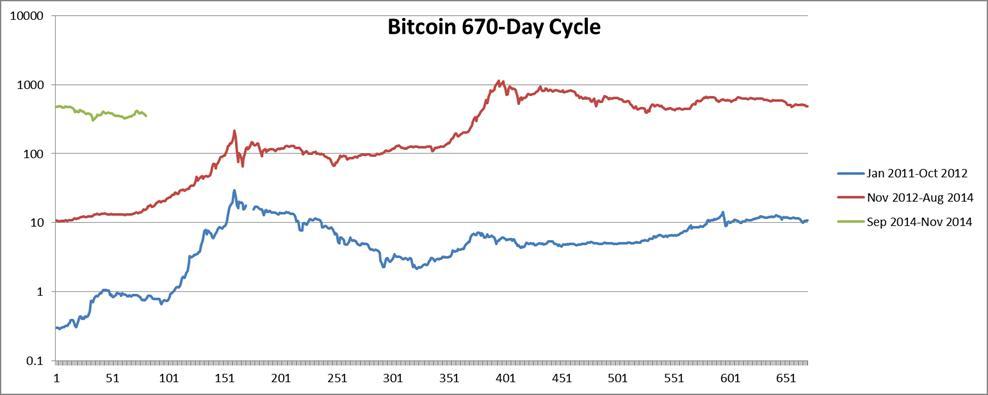 Now some fun  Comparing the plots, we experienced the same slight downturn at the end of the second (just-ended) cycle that we did at the end of the first cycle. All three cycles have begun with a more-or-less sideways trend. I actually thought the rise up about 10 days ago would coincide nicely with when we were "due" for a start to the run-up, but alas, it was not to be. If you want to use this as a crystal ball, comparing the peaks we are about 79 days from the next peak. If something like that happens, a run-up can feel free to start any time now, depending on how steep a slope it takes. Cheers |
|
|
|
|
SmoothCurves
|
|
November 21, 2014, 06:48:27 PM |
|
Well, it's been interesting to watch the price cycle, but just before I post the updated chart to reflect the trends to today, I just wanted to reiterate a few things. First, I'm not saying this is what will happen. The price will be what it will be. But people spend so much time saying stuff to compare year to year, like 365 days is some magic number, when it really doesn't mean much (well, other than it being an Earth year). Cycles in nature happen all the time, but time periods vary. Risto's 2-year theory makes a lot of sense to me, and I do think if you objectively look at the trends we are more likely on some sort of longer cycle than one year. Is it 670 days? Who knows? Second, remember this is the speculation subforum. We're always voting on what we think the price will be in a month, a year, 5 years. Speculation is exactly that. I hope nobody takes the chart and bets money on it (I wouldn't, although I would be happy for it to pan out like this!) Anyways, time will tell what price will do. So many factors involved nobody knows for sure, but let's wait and see. So, here's the updated chart: Now some fun Comparing the plots, we experienced the same slight downturn at the end of the second (just-ended) cycle that we did at the end of the first cycle. All three cycles have begun with a more-or-less sideways trend. I actually thought the rise up about 10 days ago would coincide nicely with when we were "due" for a start to the run-up, but alas, it was not to be. If you want to use this as a crystal ball, comparing the peaks we are about 79 days from the next peak. If something like that happens, a run-up can feel free to start any time now, depending on how steep a slope it takes. Cheers Thanks for the post. Very interesting. 79 days from today would be February 8th 2015. Now, it could be that we are on a longer cycle this time around...if so - let's multiply 79 days by fib 1.68 and we get a date of April 2 2015. |
|
|
|
|
wachtwoord
Legendary
Offline
Activity: 2324
Merit: 1125
|
|
November 22, 2014, 04:41:55 PM |
|
Thanks for the post. Very interesting. 79 days from today would be February 8th 2015. Now, it could be that we are on a longer cycle this time around...if so - let's multiply 79 days by fib 1.68 and we get a date of April 2 2015.
Yes, cycles will exist but it's unlikely the period of these will be constant. Still interesting though |
|
|
|
|
smoothie
Legendary
Offline
Activity: 2492
Merit: 1473
LEALANA Bitcoin Grim Reaper
|
|
November 22, 2014, 09:41:09 PM |
|
Given how the price hasn't been falling really hard but more of a back and forth in the recent months/weeks I'd say we are in a stabilizing phase which will slowly but surely end on the upside in the next 80-120 days.
|
███████████████████████████████████████
,╓p@@███████@╗╖,
,p████████████████████N,
d█████████████████████████b
d██████████████████████████████æ
,████²█████████████████████████████,
,█████ ╙████████████████████╨ █████y
██████ `████████████████` ██████
║██████ Ñ███████████` ███████
███████ ╩██████Ñ ███████
███████ ▐▄ ²██╩ a▌ ███████
╢██████ ▐▓█▄ ▄█▓▌ ███████
██████ ▐▓▓▓▓▌, ▄█▓▓▓▌ ██████─
▐▓▓▓▓▓▓█,,▄▓▓▓▓▓▓▌
▐▓▓▓▓▓▓▓▓▓▓▓▓▓▓▓▓▌
▓▓▓▓▓▓▓▓▓▓▓▓▓▓▓▓▓▓▓▓▓▓▓▓▓▓▓▓▓▓▓▓─
²▓▓▓▓▓▓▓▓▓▓▓▓▓▓▓▓▓▓▓▓▓▓▓▓▓▓▓▓╩
▀▓▓▓▓▓▓▓▓▓▓▓▓▓▓▓▓▓▓▓▓▓▓▀
²▀▀▓▓▓▓▓▓▓▓▓▓▓▓▀▀`
²²²
███████████████████████████████████████
| . ★☆ WWW.LEALANA.COM My PGP fingerprint is A764D833. History of Monero development Visualization ★☆ .
LEALANA BITCOIN GRIM REAPER SILVER COINS.
|
|
|
|
Useli Violent
Member
Offline
Activity: 68
Merit: 10
|
|
November 22, 2014, 09:50:08 PM |
|
Well, it's been interesting to watch the price cycle, but just before I post the updated chart to reflect the trends to today, I just wanted to reiterate a few things. First, I'm not saying this is what will happen. The price will be what it will be. But people spend so much time saying stuff to compare year to year, like 365 days is some magic number, when it really doesn't mean much (well, other than it being an Earth year). Cycles in nature happen all the time, but time periods vary. Risto's 2-year theory makes a lot of sense to me, and I do think if you objectively look at the trends we are more likely on some sort of longer cycle than one year. Is it 670 days? Who knows? Second, remember this is the speculation subforum. We're always voting on what we think the price will be in a month, a year, 5 years. Speculation is exactly that. I hope nobody takes the chart and bets money on it (I wouldn't, although I would be happy for it to pan out like this!) Anyways, time will tell what price will do. So many factors involved nobody knows for sure, but let's wait and see. So, here's the updated chart: Now some fun Comparing the plots, we experienced the same slight downturn at the end of the second (just-ended) cycle that we did at the end of the first cycle. All three cycles have begun with a more-or-less sideways trend. I actually thought the rise up about 10 days ago would coincide nicely with when we were "due" for a start to the run-up, but alas, it was not to be. If you want to use this as a crystal ball, comparing the peaks we are about 79 days from the next peak. If something like that happens, a run-up can feel free to start any time now, depending on how steep a slope it takes. Cheers Thanks for the post. Very interesting. 79 days from today would be February 8th 2015. Now, it could be that we are on a longer cycle this time around...if so - let's multiply 79 days by fib 1.68 and we get a date of April 2 2015. Very interesting. Marking post for future reference. |
|
|
|
azguard
Legendary
Offline
Activity: 1484
Merit: 1001
Crypto-News.net: News from Crypto World
|
|
November 25, 2014, 12:07:34 PM |
|
Well, it's been interesting to watch the price cycle, but just before I post the updated chart to reflect the trends to today, I just wanted to reiterate a few things. First, I'm not saying this is what will happen. The price will be what it will be. But people spend so much time saying stuff to compare year to year, like 365 days is some magic number, when it really doesn't mean much (well, other than it being an Earth year). Cycles in nature happen all the time, but time periods vary. Risto's 2-year theory makes a lot of sense to me, and I do think if you objectively look at the trends we are more likely on some sort of longer cycle than one year. Is it 670 days? Who knows? Second, remember this is the speculation subforum. We're always voting on what we think the price will be in a month, a year, 5 years. Speculation is exactly that. I hope nobody takes the chart and bets money on it (I wouldn't, although I would be happy for it to pan out like this!) Anyways, time will tell what price will do. So many factors involved nobody knows for sure, but let's wait and see. So, here's the updated chart: Now some fun Comparing the plots, we experienced the same slight downturn at the end of the second (just-ended) cycle that we did at the end of the first cycle. All three cycles have begun with a more-or-less sideways trend. I actually thought the rise up about 10 days ago would coincide nicely with when we were "due" for a start to the run-up, but alas, it was not to be. If you want to use this as a crystal ball, comparing the peaks we are about 79 days from the next peak. If something like that happens, a run-up can feel free to start any time now, depending on how steep a slope it takes. Cheers Thanks for the post. Very interesting. 79 days from today would be February 8th 2015. Now, it could be that we are on a longer cycle this time around...if so - let's multiply 79 days by fib 1.68 and we get a date of April 2 2015. Yea this is great we can all get some big time btc or some other crypto. Cuz in btc goes up all alts go up. Nice graphic and will keep my eye on this. |
▄▄▄██████▄▄▄
▄██████████████████▄
▄████████████████████████▄
▄▄ ▄████████████████████████████▄
███████████████████████████████████▄
▀▀█████████████████████████████████▄
██████████████████████████████████
██████████████████████████████████
██████████████████████████████████
██████████████████████████████████
▀████████████████████████████████▀
▀██████████████████████████████▀
▀▀██████████████████████████▀
▀██████████████████████▀
▀▀▀████████████▀▀▀ | .
| .....█
.....█
.....█
.....█
.....█
.....█ | | █
█
█
█
█
█ |
|
|
|
|
bajlox
|
|
November 25, 2014, 12:09:32 PM |
|
Graph is cool and look promising with same pattern. Hope to see this happen in first quarter of 2015. if graphic is correct and pattern is the same. |
|
|
|
|
keystroke
|
|
November 25, 2014, 12:54:57 PM |
|
Nice post but Konrad S. Graf should be credited as well as he created the original YoY graphs. www.konradsgraf.com |
"The difference between a castle and a prison is only a question of who holds the keys."
|
|
|
wobber
Legendary
Offline
Activity: 1064
Merit: 1001
|
|
November 25, 2014, 04:11:15 PM |
|
 Not exactly trollish but I think we'll see something like this. First 2 plots seem similar but nothing points to a third one happening in the same manner |
If you hate me, you can spam me here: 19wdQNKjnATkgXvpzmSrkSYhJtuJWb8mKs
|
|
|
|


