|
Title: Globb0 BTC charts Post by: Globb0 on April 06, 2020, 01:56:13 PM OK as this thread for BTC charts as I learn about charting and trends I will add more details.
All feedback and observations are welcomed I'm learning. Here is my daily based BTC chat with resistance and support imposed in yellow. A healthy looking (slightly) ascending triangle? https://i.imgur.com/CiHneZd.jpg Zooming in on the hourly https://i.imgur.com/jfie81K.jpg We are at top edge within the triangle. Breakout from here up? Title: Re: Globb0 BTC charts Post by: Quidat on April 06, 2020, 02:58:01 PM We are at top edge within the triangle. Breakout from here up? For 1D TF then i can say that it will most likely to have a breakout but if we do try to look for some confirmation on 1h TH then it would still play out into these levels either it would breakout or would just bounce down when it do hit up that resistance. For shorting or active trade then i would wait a little bit before making an entry but well it depends on you though. Title: Re: Globb0 BTC charts Post by: Globb0 on April 06, 2020, 02:59:42 PM Yes I am looking for any confirmation to happen on the 1d candles chart and they must be closed for that day.
Thanks for the response. Title: Re: Globb0 BTC charts Post by: Tytanowy Janusz on April 06, 2020, 03:18:25 PM Such triangles very often break out in fake direction and return with huge strength. That's why i don't like to trade based on this formation.
We need to remember that BTC looks very bullish fundamentally. 1- 1.5 bilion newly printed tethers (+30% supply) 2- halving around the corner 3- helicopter of fiat money - unlimited QE Title: Re: Globb0 BTC charts Post by: Globb0 on April 06, 2020, 06:20:59 PM Such triangles very often break out in fake direction and return with huge strength. That's why i don't like to trade based on this formation. We need to remember that BTC looks very bullish fundamentally. 1- 1.5 bilion newly printed tethers (+30% supply) 2- halving around the corner 3- helicopter of fiat money - unlimited QE Is that not the point of waiting for a 1d candle to close to confirm things? Title: Re: Globb0 BTC charts Post by: Tytanowy Janusz on April 06, 2020, 06:37:57 PM Is that not the point of waiting for a 1d candle to close to confirm things? It works for you? Candle close at random time. Different time on every exchange. There is a chance that you will have perfect buy signal on binance when candle close at 00:00 and perfect sell signal on kraken when candle close at 4:00 (just example). Its not stocks - end of candle is end of day session with fixing (CLOSING AUCTION - last 5-30 min depending on country) where lots of volume is added after it with fixed auctioned price.In my opinion end of candle does not matter in crypto. Title: Re: Globb0 BTC charts Post by: LFC_Bitcoin on April 06, 2020, 06:38:11 PM Nice one Globb0, mate.
I dont do TA myself but will be interesting to follow your price projections. Were already starting to rise a little so youre spot on at the moment (currently observing $7,215). Will drop by this thread again in a couple of days. Take care bro! https://i.ibb.co/mJvfSHC/0-D43-AFB6-C848-454-E-B3-E2-908-F48-BD4-B43.jpg (Photo credit: Bitstamp) Title: Re: Globb0 BTC charts Post by: VB1001 on April 07, 2020, 05:52:29 AM His triangle broke as expected hitting 7,464 on Bitstamp, he has now taken a break but will try again towards 7,500 (next step 8,000)
Title: Re: Globb0 BTC charts Post by: Globb0 on April 07, 2020, 07:06:52 AM Is that not the point of waiting for a 1d candle to close to confirm things? It works for you? Candle close at random time. Different time on every exchange. There is a chance that you will have perfect buy signal on binance when candle close at 00:00 and perfect sell signal on kraken when candle close at 4:00 (just example). Its not stocks - end of candle is end of day session with fixing (CLOSING AUCTION - last 5-30 min depending on country) where lots of volume is added after it with fixed auctioned price.In my opinion end of candle does not matter in crypto. Thanks I didn't really think, but you are spot on the world is not 1 day its timezones. Also the finance market shenanigans happen in the last 30 mins, too true. Does crypto have that? its never really the end (ah is that what you are telling me?) That daily close bit is the confirmation for me, Im often looking at the hourly but in the context of the daily. Daily will confirm if trend broke or held. Thanks for the comments. Please DYOR but lets see what was or wasn't an indication as we go on. Cheers Title: Re: Globb0 BTC charts Post by: Tytanowy Janusz on April 07, 2020, 07:23:52 AM That daily close bit is the confirmation for me, Im often looking at the hourly but in the context of the daily. Daily will confirm if trend broke or held. If it works for you and you are actually earning using that than go for it :) I never profit using this formation -it always fake me and go opposite direction. If you do earn than I'm not the person that should give you tips:) I think that this trend line puts current price into another, bigger triangle. Breaking through both may push price very fast. https://i.imgur.com/PpW3LrG.png Cheers Title: Re: Globb0 BTC charts Post by: Globb0 on April 07, 2020, 07:59:02 AM So, the daily closed above that triangle, trend seems confirmed, still a bit bellow the resistance so no real challenges.
https://i.imgur.com/HTXyHoR.jpg Zooming to the hourly, OK, here a new little support level. :) https://i.imgur.com/fzO4Chl.jpg Title: Re: Globb0 BTC charts Post by: Wind_FURY on April 07, 2020, 08:12:39 AM Subscribed!
Plus OP, your title should also include, "Globb0 BTC charts, AND complimentary funny Starwars memes". 8) Title: Re: Globb0 BTC charts Post by: exstasie on April 07, 2020, 08:48:17 AM Nice, love to see threads like this.
It's looking more like a wedge than a triangle to me. No matter though, BTC likes to break upwards from bearish wedges. Stocks had a major upside breakout today which supports the bull case for BTC too. That sell zone in the low $8,000s looks tasty. I'm eyeing it as well. Lots of good pivot resistance there, as well as the 200-day MA. Title: Re: Globb0 BTC charts Post by: Globb0 on April 07, 2020, 08:59:42 AM Subscribed! Plus OP, your title should also include, "Globb0 BTC charts, AND complimentary funny Starwars memes". 8) Thanks :) https://i.pinimg.com/originals/9d/0c/19/9d0c19e352f5cc50221bfa0bf7b49265.gif Title: Re: Globb0 BTC charts Post by: buwaytress on April 07, 2020, 09:48:46 AM Mo TA mo happy, I say;) I've always said I read TA occasionally and only for the ones I actually find interesting, after all, it's entertainment we're all after, plus the bit of learning.
Are you putting any trades on your charts, Globb0? I find if you put something on it, even if a token sum, psychologically makes you a bit more diligent when putting strats together. Couple more hours to ensure the day's high so far is tested in the same timezone *7465*. That's where I'm thinking people are going to make their minds up. Title: Re: Globb0 BTC charts Post by: JL0 on April 07, 2020, 10:51:51 AM Do you think we can break up to the daily SMA 200 (~8500) ? Thank you for your TA
Title: Re: Globb0 BTC charts Post by: Globb0 on April 07, 2020, 12:33:58 PM Hourly is well past the triangle now and I added the suggested line for the bigger triangle too.
https://i.imgur.com/Fr1qf6k.jpg About to burst through the last little bit of hourly resistance, hmm or maybe not. There is an uncertainty at this zoom level Title: Re: Globb0 BTC charts Post by: Toxic2040 on April 07, 2020, 06:45:17 PM Title: Re: Globb0 BTC charts Post by: El duderino_ on April 07, 2020, 08:04:28 PM Thx for sharing your thoughts... my man Globb0 !!! Gonna follow this thread closely
:D :D :D Title: Re: Globb0 BTC charts Post by: STT on April 08, 2020, 06:30:05 AM Nifty, I prefer the dark side charts also. I have a similar outlook though I think its best to have several takes and see which plays out as most accurate, not be too attached to any one point of view. I dont have the December lows as a trend, I was thinking that range could relate as prior volume and so some resistance or boundary. Top price recently have been 50 day but indicators dont cap prices beyond immediate perception.
Most important is the uptrend line and how that plays out vs any delay in progress upwards. Its a similar recovery that we saw through January though from a much lower point. Title: Re: Globb0 BTC charts Post by: Globb0 on April 08, 2020, 07:27:49 AM Nifty, I prefer the dark side charts also. I have a similar outlook though I think its best to have several takes and see which plays out as most accurate, not be too attached to any one point of view. I dont have the December lows as a trend, I was thinking that range could relate as prior volume and so some resistance or boundary. Top price recently have been 50 day but indicators dont cap prices beyond immediate perception. Most important is the uptrend line and how that plays out vs any delay in progress upwards. Its a similar recovery that we saw through January though from a much lower point. Thanks. Totally agree with your points. Look to see what's happening, then see if it held. Reflect and hopefully learn. The daily was threatening a shooting star but in the end it just closed a bit down, not much to see, not worth a picture long thin ends on the candle shows the market shuffling their positions around. Hourly did dip back a bit but tentatively OK. At this point I would not decide to build my house on the ground. *edit* And I did say no chart but here is something different, something of a recovery from the horrible zone https://i.imgur.com/jdpHBlE.jpg */edit* :) Title: Re: Globb0 BTC charts Post by: Globb0 on April 08, 2020, 08:56:42 AM Cleaned up my triangles now and back to the hourly,
This is where the battle is at https://i.imgur.com/uSbP4v3.jpg Title: Re: Globb0 BTC charts Post by: Tytanowy Janusz on April 08, 2020, 10:32:24 AM Yes. I agree that 7100 is a key support here ... but i would not underestimate 7250 that seems to be important test in Wyckoff formation. What do you think Globb0?
https://i.imgur.com/HPzrho1.png Title: Re: Globb0 BTC charts Post by: Globb0 on April 08, 2020, 10:39:21 AM What do you think Globb0? Yes interesting. It could be the start of a little bit of oscillation similar to that I saw a while back on XMR. I was asking Kurious about it at the time. I think its an indicator things are very finely balanced, also good news is that went up eventually when it broke the oscillations. https://i.imgur.com/9utD36S.jpg https://www.newtraderu.com/wp-content/uploads/2016/06/CandlestickCheatSheetweb-01-1024x724.jpg Title: Re: Globb0 BTC charts Post by: Globb0 on April 09, 2020, 08:20:47 AM So I feel I was right we had a few oscilations.
They aren't perfect but Im sure it shows a situation of fine balance. I notice how the support seems to be building in each time and that's making me lean towards up next. We are still within the main battle channel, so until that is breached, well. https://i.imgur.com/ohXMAzF.jpg i would not underestimate 7250 Good call, I added more supports above, Title: Re: Globb0 BTC charts Post by: cryptomaniac_xxx on April 09, 2020, 08:36:55 AM Thanks for the chart. But the way I look at it, seems to be running on some resistance. However, if we can manage to close the daily candle above the 50 day MA and potentially convergences at the 200 day MA @79xx levels, interesting to see how everything will pan out.
Title: Re: Globb0 BTC charts Post by: exstasie on April 09, 2020, 08:43:57 AM So I feel I was right we had a few oscilations. They aren't perfect but Im sure it shows a situation of fine balance. I notice how the support seems to be building in each time and that's making me lean towards up next. We are still within the main battle channel, so until that is breached, well. I still think we'll eventually hit the low $8,000s, filling this gap in the volume profile and tagging the 200-day MA: https://i.imgur.com/4FMcAZg.png Tim West's TAM system has me second guessing the short term though. On that chart we can see a 13-day mode (see the yellow line ~ $6,700). Per his system, we are on Day 3 of a range expansion out of that mode. If we don't hit ~ $7,800 by today's close, the signal is invalidated. Usually that suggests a retest of the mode (the $6,700 area). Assuming it holds as support, we're on for the $8,000s again. I like this theory because the timing works better with the halving narrative. It means the final top will be a week or three out, which suits my theory that sellers will distribute ahead of the halving just like 2016. It also provides much better risk/reward on new long entries. Risk wise, this is a dangerous area to enter longs. Title: Re: Globb0 BTC charts Post by: LFC_Bitcoin on April 09, 2020, 09:14:56 AM Enjoying your analysis Globb0, I didnt know you were able to do TA. You hid your skills from us for too long :D
Im interested to see where we go price wise in the next 8 or so weeks, obviously a month before & a month after the halving. Id expect to see a speculative rise pre halving followed by the inevitable dump shortly post halving like previous times. Well then continue to rise slowly throughout 2020, calling a top of $13,000 by end of 2020. Title: Re: Globb0 BTC charts Post by: cryptomaniac_xxx on April 09, 2020, 09:17:33 AM I like this theory because the timing works better with the halving narrative. It means the final top will be a week or three out, which suits my theory that sellers will distribute ahead of the halving just like 2016. It also provides much better risk/reward on new long entries. Risk wise, this is a dangerous area to enter longs. I have seen your thread as well, if I remember correctly, you may have predicted (prior to the corona virus outbreak) that we might see some a sell-off in March which eventually happened and then April, the start of the recovery ahead of the block halving in May. Good call btw. Yes, there are risks, but I will be bullish and anticipating some big moves along the way. Title: Re: Globb0 BTC charts Post by: Globb0 on April 09, 2020, 09:41:50 AM Enjoying your analysis Globb0, I didnt know you were able to do TA. You hid your skills from us for too long :D Im interested to see where we go price wise in the next 8 or so weeks, obviously a month before & a month after the halving. Id expect to see a speculative rise pre halving followed by the inevitable dump shortly post halving like previous times. Well then continue to rise slowly throughout 2020, calling a top of $13,000 by end of 2020. I did a udemy course to get me started, it was focussed on resistance and reversal/confirmation indicators. I plan to learn more. Will be good to get back zoomed out to the daily then for your purposes. Hopefully something good to see soon as idling atm. Title: Re: Globb0 BTC charts Post by: akhjob on April 09, 2020, 10:17:45 AM I did a udemy course to get me started, it was focussed on resistance and reversal/confirmation indicators. I plan to learn more. Will be good to get back zoomed out to the daily then for your purposes. Hopefully something good to see soon as idling atm. I hope you started learning a few days back because of the lockdown. If so can you please share the course link? Because I myself started to reading a book suggested by my friend recently and having a hard time figuring out the patterns. Considering how fast you learnt, if you could share the link, it would be very helpful. Thanks. Title: Re: Globb0 BTC charts Post by: Globb0 on April 09, 2020, 11:45:47 AM Sorry it was ages ago I kept adding any free well rated courses.
I got a few on BTC and trading. I have an alert setup for when they have deals usually free (for a day or 2) courses. Add as many as you like. by way of an example here is a list from yesterday https://www.hotukdeals.com/deals/free-best-sellers-highest-rated-udemy-courses-video-production-bootcamp-python-javascript-photoshop-digital-marketing-masterclass-3437263 Topics are a bit hit and miss, but over time you see what you want free. Not too bad. Title: Re: Globb0 BTC charts Post by: buwaytress on April 09, 2020, 02:01:10 PM I have seen your thread as well, if I remember correctly, you may have predicted (prior to the corona virus outbreak) that we might see some a sell-off in March which eventually happened and then April, the start of the recovery ahead of the block halving in May. Good call btw. Yes, there are risks, but I will be bullish and anticipating some big moves along the way. Yeah, actually I count at least 3 forum gentlemen who rather made the right -- if slightly unpopular -- call about the fallback in March and lows below $4k, though to be fair, I bet none of them expected all these converging banking/economy/geopolitics/pandemic threats to come together at once. I rather enjoy being a pessimist, but it still sends chills down my spine to read TAs that come together nicely. Title: Re: Globb0 BTC charts Post by: akhjob on April 09, 2020, 04:54:02 PM Sorry it was ages ago I kept adding any free well rated courses. I got a few on BTC and trading. I have an alert setup for when they have deals usually free (for a day or 2) courses. Add as many as you like. by way of an example here is a list from yesterday https://www.hotukdeals.com/deals/free-best-sellers-highest-rated-udemy-courses-video-production-bootcamp-python-javascript-photoshop-digital-marketing-masterclass-3437263 Topics are a bit hit and miss, but over time you see what you want free. Not too bad. Oh.. From your conversation with LFC, I thought you started recently and excelled at a miraculous speed :D So my friend was right about the "patience" needed for trading after all :) Anyways thanks for the link, hope the codes are not (UK) region-specific. Title: Re: Globb0 BTC charts Post by: Globb0 on April 09, 2020, 05:54:08 PM Oh.. From your conversation with LFC, I thought you started recently and excelled at a miraculous speed :D So my friend was right about the "patience" needed for trading after all :) Anyways thanks for the link, hope the codes are not (UK) region-specific. Kind words, I have been watching here for years and years that was my real education. Patience surely is a thing don't end up all mindrust. Support has grown and we continue in the channel. For sparta! https://i.imgur.com/sjsi7kK.jpg Title: Re: Globb0 BTC charts Post by: Globb0 on April 10, 2020, 08:16:55 AM RED ALERT!
Smashed down through the channel on the hourly, bears won for now. RSI in the gutter. https://i.imgur.com/PbM6NxZ.jpg But remember I need to see where to daily closes it may not yet be breached after all? War rages on, long tips on candles, positions are shuffling about. Title: Re: Globb0 BTC charts Post by: cryptomaniac_xxx on April 10, 2020, 10:28:04 AM ^ Oh well, it was a short-live rally, bears won, I thought we have the upper hand, game over for bulls for now. So obviously, trend line is falling, but I'm not ready to buy yet, the price hasn't break the resistance line yet.
@buwaytress - if I'm not mistaken, @mikeywith also made a good call back then. Title: Re: Globb0 BTC charts Post by: El duderino_ on April 10, 2020, 12:41:53 PM Enjoying your analysis Globb0, I didnt know you were able to do TA. You hid your skills from us for too long :D Im interested to see where we go price wise in the next 8 or so weeks, obviously a month before & a month after the halving. Id expect to see a speculative rise pre halving followed by the inevitable dump shortly post halving like previous times. Well then continue to rise slowly throughout 2020, calling a top of $13,000 by end of 2020. Dont underestimate the Globmeister, his skills are unknown for us mortals Title: Re: Globb0 BTC charts Post by: Tytanowy Janusz on April 11, 2020, 11:13:06 AM I like this theory because the timing works better with the halving narrative. It means the final top will be a week or three out, which suits my theory that sellers will distribute ahead of the halving just like 2016. It also provides much better risk/reward on new long entries. Risk wise, this is a dangerous area to enter longs. I might be wrong (and i accept criticism with open hands) but i think that halving may not have big influence on the price. Here are few numbers. 1- first halving decrease inflation from ~27% to ~13%, third one will decrease inflation from 3.6% to 1.8%. Every halving has lower fundamental input into price. It's becoming only speculative pump and dump event and investors knows about that. 2- We weren't in pandemic fear during last halvings, we also weren't recovering after 60% dump. 3-FED just announced 2.3 trillion $ print "fighting with covid-19" (it's not the first print last month). Doing that they increased whole world money supply by ~3%. During single print. In my opinion it may have bigger fundamental influence on bitcoin price than halving. the broad money supply ($80.9 trillion). (https://www.businessinsider.com/all-of-worlds-money-in-one-chart-2015-12?IR=T) Federal Reserve takes additional actions to provide up to $2.3 trillion in loans to support the economy (https://www.federalreserve.gov/newsevents/pressreleases/monetary20200409a.htm) Am i wrong with my calculation? It looks so unrealistic. 4-We base only on 2 previous events. It may be not enough to draw conclusions (when you play coin toss 2 times there is a chance that you will have 2 times tails - you could make a false conclusion that it will always land on tails) Of course there are a bunch of short term investors that play this strategy (buy and sell 1 month before halving) and the amount of money that stands behind them may push price as you described, but i'm not sure if they will be strong enough in current market situation. Especially that they are mostly under water now and part of them might already dump in fear of covid panic (or was liquidated due to margin-call). Title: Re: Globb0 BTC charts Post by: Globb0 on April 11, 2020, 11:39:47 AM People are always posting that meme 1 BTC = 1 BTC
Im womdering does 1 $ even equal 1 $ now? Perhaps its 1 $ = 0.7 $ :D Title: Re: Globb0 BTC charts Post by: Globb0 on April 12, 2020, 09:13:05 AM Well the daily did close under the old battle channel so it is lost.
Here is a rebase for the daily chart taking that into account. Also a scary triangle, break could be down. Not seeming in line with halving sentiment though? https://i.imgur.com/lJsGnb6.jpg Zooming into the hourly chart https://i.imgur.com/UItl6Lj.jpg Low volume noted. Its the bleakend. Its not inconceivable there is less general money slushing around as people lose their income streams and guard their bit of money for emergencies. Will that mean a blead down? Especially because its global not local, there is no bypass factor for some groups people. Title: Re: Globb0 BTC charts Post by: Tytanowy Janusz on April 12, 2020, 11:11:04 AM I'm bullish. After 5 years trading stocks and 2.5 years on crypto the only thing that cheated me the least is whale hunting.
Who is selling? 1- Halving traders 2- In need of money due to covid 3- TA traders due to perfect short position (breaking triangle and bouncing from strong trend line - target 4000$) 4- covid panic sellers Who is buying? Literally no one. I don't see even a single reason why to buy now. Even a single buy signal. My whale detector flashes red. We should test 6000-6400 and meanwhile we stay at 6800 - at perfect short/sell price. Market most often does not give you 2 days to open position in situation like this one. Maybe it's because of the holidays and price will crash making me looking like an idiot. Nevertheless, I posted that because based on my trading experience someone is buying the false breakout. Title: Re: Globb0 BTC charts Post by: cryptomaniac_xxx on April 12, 2020, 12:38:06 PM More of a $6150 retest to me, before going to the moon before halving.
Title: Re: Globb0 BTC charts Post by: exstasie on April 12, 2020, 09:02:15 PM I still think we'll eventually hit the low $8,000s, filling this gap in the volume profile and tagging the 200-day MA: https://i.imgur.com/4FMcAZg.png Tim West's TAM system has me second guessing the short term though. On that chart we can see a 13-day mode (see the yellow line ~ $6,700). Per his system, we are on Day 3 of a range expansion out of that mode. If we don't hit ~ $7,800 by today's close, the signal is invalidated. Usually that suggests a retest of the mode (the $6,700 area). Assuming it holds as support, we're on for the $8,000s again. We made it down to $6,750 and tested that mode area. Nice reaction, pumping back to $7,200. This bodes well for another leg up. One thing to keep in mind is BTC doesn't really have a mind of its own anymore. It just follows the stock market now. When stock and futures markets are closed, BTC price moves basically stop being meaningful. They don't follow through. Stock futures open in an hour. Let's see what they have to say about next week. If SPX and DOW mini futures open the week bullish, I would say that's very good news for BTC, which is already showing a propensity for upside from here. Title: Re: Globb0 BTC charts Post by: Tytanowy Janusz on April 13, 2020, 05:51:48 AM Maybe it's because of the holidays and price will crash making me looking like an idiot. And it happens ... :( I went to sleep seeing how BTC fights with 7200 being happy with my bullish call. In the meantime SP500 futures opens and show direction for whole world. I wake up as an Idiot and BTC below 6750 support. It looks like BTC was so lazy during last days only because of holidays. @exstasie good call with this: One thing to keep in mind is BTC doesn't really have a mind of its own anymore. It just follows the stock market now. When stock and futures markets are closed, BTC price moves basically stop being meaningful. They don't follow through. Stock futures open in an hour. Let's see what they have to say about next week. If SPX and DOW mini futures open the week bullish, I would say that's very good news for BTC, which is already showing a propensity for upside from here. Title: Re: Globb0 BTC charts Post by: adaseb on April 13, 2020, 06:08:25 AM The trend is still bullish until we hit the $8000 area where we fell hard and had that nasty crash last month. The issue is that it seems to be following S&P 500 if you were trading earlier both of them had a huge down move earlier. So if the stock markets are finally going to make LH and LL then I can see BTC retest the $4000 area.
However I wouldn't short yet, and in the $8K area I would wait for confirmation to short. Too many people want to short the $8K area which makes me cautious about opening any positions there. Plus who knows when the stock markets could turn. The S&P500 might end up makin a new ATH before it finally starts breaking down and breaks the low of March. Currently on the hourly its bullish and who even knows if they will stay correlated in the future. BTC might trade sideways or go down while S&P500 keeps going up and up or vice versa. Title: Re: Globb0 BTC charts Post by: Globb0 on April 13, 2020, 08:10:10 AM a scary triangle, break could be down. Ouch leaving the triangle, will it close under? https://i.imgur.com/nuiMceU.jpg Hourly news https://i.imgur.com/yL6BmMw.jpg Dare I say pump and dump or at least dump on pump. 1 obvious big dump effort on otherwise low volume. Big support drawn yellow, pushed back this time. Title: Re: Globb0 BTC charts Post by: cryptomaniac_xxx on April 13, 2020, 11:14:32 AM 2 trend lines have been broken already, not a good sign. Price have been slowly dropping after touching $7300, so that's around what? 5%-6% decline. And it seems that BTC have showed some correlations with stocks (others will argue with this, sorry), but it this is true it might take down crypto towards the lower $6k'sh.
Title: Re: Globb0 BTC charts Post by: exstasie on April 13, 2020, 08:22:06 PM The S&P500 might end up makin a new ATH before it finally starts breaking down and breaks the low of March. That's impossible. Nobody is that dumb. The market is pricing in massive economic contractions right now, not just slowdowns. We're past the point where this could be considered a few week long disruption. It's a confirmed recession now, one that is likely to continue into 2021 based on all reasonable projections. Many DOW and SPX companies (who have mostly yet to release financials for Q1 yet) are looking at 20-90% revenue reductions. The stock market maybe disconnected from overall economic health, but it is not that disconnected from company financial health. At best, the SPX might retrace to the 0.618-0.786 before it gets sold off to hell. And that's an optimistic view. Title: Re: Globb0 BTC charts Post by: Tytanowy Janusz on April 14, 2020, 06:04:25 AM That's impossible. Nobody is that dumb. Overleveraged shorts does not have brain. Liquidated positions will be buying that day. I would also like to point out that we never had recession combined with FED's "infinite money" [1] (https://www.youtube.com/watch?v=DUrlNHTxuJM) [2] (https://twitter.com/i/status/1241905410157805568). We may see 2200-3200 consolidation for next 5-10 years. Average investor will be close to 0% profit/loss but in the same time he will be lost 50% on purchasing power of his money. SP500 recover will increase market optimism and informations on subsequent prints will reduce risk aversion - I was never more bullish on bitcoin (long term 1-5 years) Just take a look how the market reacted to unemployment data that were many times worse than analysts' estimates. Resistance to bad data is the first determinant of the dip. Title: Re: Globb0 BTC charts Post by: buwaytress on April 14, 2020, 08:56:31 AM @Ty I actually agree with you, there's everyone selling and there isn't a buy signal, but just last week we were seeing record lows for deposits to exchanges. And on Friday we're seeing BitMEX refilling hot wallets with over $1B of btc.
Which tells me, people aren't selling. They're even withdrawing from exchanges. So they're holding. Not buying. Only traders, people who need money, all those like you said, are selling. So we're seeing slow drops at low volumes. Good news for us. Title: Re: Globb0 BTC charts Post by: Globb0 on April 14, 2020, 10:21:44 AM Title: Re: Globb0 BTC charts Post by: JL0 on April 14, 2020, 10:30:32 AM https://www.tradingview.com/x/y49nh2il/
We were rejected by the 50DMA again. Do you think we can see the $4-5K on the halving ? Title: Re: Globb0 BTC charts Post by: Globb0 on April 15, 2020, 08:09:22 AM We were rejected by the 50DMA again. Do you think we can see the $4-5K on the halving ? I recognise a similar triangle here, I cant say at the moment the price direction. I feel like I'm standing on shifting sand. Such a tease the triangle didn't close broken yet. What a tease, in fact look few days its been completely neutral like someone turned off the machine. Look also RSI. "Clear!" *KAchung* "Clear!" *Kachung* https://i.imgur.com/rpAgtaz.jpg Lets get into the hourly view and see https://i.imgur.com/JGClgrJ.jpg Well, look its conforming quite well to the boundaries, what will happen? hmmmmmm Oh yeah, forgot my other duties! https://3.bp.blogspot.com/-tVTWtKtC9go/UF9uWLLLFII/AAAAAAAADJ4/qlsCSUcIRA4/s1600/obi-wan.gif Title: Re: Globb0 BTC charts Post by: cryptomaniac_xxx on April 15, 2020, 10:14:29 AM Good thing $6600'ish hasn't been touch, but the pressure is still on the bulls.
This is the danger zone for me, we might see a big drop if that support levels are broken. So we need to wait if this is going to be validated in the next coming days. If it's invalidated then obviously, we might see some upside. Title: Re: Globb0 BTC charts Post by: vapourminer on April 15, 2020, 02:51:33 PM so, disclaimer: i dont do TA, rarely look at charts or even the price of corn most days. got some stuff laddered on exchange for whatever happens and the rest is hodl.
so why post? well went to log into a bank account today and the back end was down and was informed the system crashed "with all the people looking stimulus money." huh. so for years banks push us to bank online as much as possible and now that they have their wish.. only drive through and limited appoints for anything else that needs an in bank visit with a human. and they flub it with crappy infrastructure. so this is my TA: btc wins simply because no financial institution has the tech to play reliably anymore. all traditional banks have just patches to COBOL programs (heh i took that language in college) and patch patch patch print brrrr brrr brr Title: Re: Globb0 BTC charts Post by: Globb0 on April 16, 2020, 02:25:23 PM heh.
Lets see today the daily chart https://i.imgur.com/vhBlEOZ.jpg It did close out of the triangle, boooo! But then immediately what's this a reversal sign? highlighted and a few recent similar times. Down to the hourly, https://i.imgur.com/OyWIvcr.jpg As above, broke down strong from the triangle but what's this a reversal symbol? note the risen volume. At least again solid resistance and push back. Still I don't feel there is a clear direction, this is like don't trade time. Captains message - *Belts on as a precaution* Title: Re: Globb0 BTC charts Post by: exstasie on April 16, 2020, 08:36:16 PM Still I don't feel there is a clear direction, this is like don't trade time. Captains message - *Belts on as a precaution* My bias is bullish. Probably the most important question a trader can ask himself: where does the market not want to go? Yesterday sellers tried to initiate range expansion below the $6,555 low. They were fiercely rejected on solid volume and we quickly returned to the previous trading range. This is what Wyckoff called a "spring" and what Bollinger calls a "headfake." It's the fake-out before the market breaks out in the other direction. The market very clearly doesn't want to go down. We might drop to the $6,700-$6,900 zone to test support first but on the bigger picture, I strongly prefer the bull case. Breaking $7,200 and then $7,466 will help confirm my theory that BTC (as well as the stock market) will keep uptrending through April, before a major bearish consolidation event prior to the halving. This theory is invalidated if we break below yesterday's low ($6,456). Title: Re: Globb0 BTC charts Post by: Tytanowy Janusz on April 17, 2020, 06:46:42 AM Probably the most important question a trader can ask himself: where does the market not want to go? The market very clearly doesn't want to go down. Yes. My predictions look the same and I again believe in what i've posted here. I'm bullish. [...] I was faked by this dump and lost confidence:[...] My whale detector flashes red. We should test 6000-6400 and meanwhile we stay at 6800 - at perfect short/sell price. Market most often does not give you 2 days to open position in situation like this one. [...] https://i.imgur.com/LplPSb9.png But after yesterdays strong 1D green dildo I'm back in short term bull club (I'm always bullish for bitcoin in long term) Title: Re: Globb0 BTC charts Post by: Globb0 on April 18, 2020, 10:58:48 AM Right then, left it another day. Lets see what is unfolding on the daily.
https://i.imgur.com/yJ7e7o2.jpg Disappointing so far following the up a bit signal, almost immediately looks like a reversal to down. Need to see where the next daily closes. Looks precarious. Lets zoom in to the hourly view.... https://i.imgur.com/ut5Vae9.jpg Could that be a flagpole formation? ie going up to the same height again? At the same time its the doldrums, no volume idling along again. not exactly strong. Title: Re: Globb0 BTC charts Post by: cryptomaniac_xxx on April 18, 2020, 11:24:30 AM What did I missed?
Price did broke $6600, however, I didn't expect the price to bounce back quickly after and move to $7k. I thought we will see some double top to confirmed bearish trend, but I guess it was obviously rejected. So now the trend looks like we are in the bullish zone, but just under the resistance zone. So anything can still happened, need to break the resistance zone though to push the price to $7300-$7500. Title: Re: Globb0 BTC charts Post by: Globb0 on April 18, 2020, 11:38:15 AM What did I missed? Price did broke $6600, however, I didn't expect the price to bounce back quickly after and move to $7k. I thought we will see some double top to confirmed bearish trend, but I guess it was obviously rejected. So now the trend looks like we are in the bullish zone, but just under the resistance zone. So anything can still happened, need to break the resistance zone though to push the price to $7300-$7500. yes that's really why Id like to see where the current daily candle will close it feels right in the balance of up or down Title: Re: Globb0 BTC charts Post by: cryptomaniac_xxx on April 19, 2020, 11:35:45 PM What did I missed? Price did broke $6600, however, I didn't expect the price to bounce back quickly after and move to $7k. I thought we will see some double top to confirmed bearish trend, but I guess it was obviously rejected. So now the trend looks like we are in the bullish zone, but just under the resistance zone. So anything can still happened, need to break the resistance zone though to push the price to $7300-$7500. yes that's really why Id like to see where the current daily candle will close it feels right in the balance of up or down Start of the week, there might be some interesting movement. Just take note that April-June of last year was bullish and parabolic rise. Almost all of the traditional global markets are green right now, so we might want to take that into consideration as well. Title: Re: Globb0 BTC charts Post by: Tytanowy Janusz on April 20, 2020, 05:42:36 AM Start of the week, there might be some interesting movement. Just take note that April-June of last year was bullish and parabolic rise. Almost all of the traditional global markets are green right now, so we might want to take that into consideration as well. "Sell in May and Go Away" (https://www.investopedia.com/terms/s/sell-in-may-and-go-away.asp) didn't came from nowhere. "From 1950 to around 2013, the Dow Jones Industrial Average has had an average return of only 0.3% during the May to October period, compared with an average gain of 7.5% during the November to April period," Based on 63 years data. Good thing is that, based on last few years, this patter is less visible but I would not expect this or this: Quote Just take note that April-June of last year was bullish and parabolic rise to have big influence on price when we have: 1- fiat printers doing brrrr 2- covid panic and possible second wave of infections 3- halving 4- historic high fluctuation on stocks .... 50- Italy may not recover from financial crisis and sink whole EU - same currency .... 100- problems at OPEC+ that may end in a conflict in the Middle East (US will do a lot for the stability of oil prices) .... Title: Re: Globb0 BTC charts Post by: exstasie on April 20, 2020, 08:22:53 AM Start of the week, there might be some interesting movement. Just take note that April-June of last year was bullish and parabolic rise. Almost all of the traditional global markets are green right now, so we might want to take that into consideration as well. David thinks BTC is beginning its next parabolic bull run already: https://bitcointalk.org/index.php?topic=5140701.msg54255809#msg54255809 I think Q2 will be bullish overall, but I'm not not nearly as optimistic as him. Still thinking something more along these lines: With BTC following the stock market so closely, these factors may become relevant:
The market is very unpredictable right now. Another leg up is still possible in the next week or so. Liquidity still favors the bulls. However I would say a significant pullback (probably to the $5,000s) is a matter of time. Title: Re: Globb0 BTC charts Post by: Globb0 on April 20, 2020, 09:04:44 AM "Sell in May and Go Away" (https://www.investopedia.com/terms/s/sell-in-may-and-go-away.asp) didn't came from nowhere. Sell in May then stay at home and save lives 8) It still feels sideways at the moment, maybe even down on the daily? did we get our up from the up signal? a bit. https://i.imgur.com/Kn5ZO40.jpg Into the hourly view, we see not a lot going on. The flag pole pattern threatened to happen, would have broken us through but didn't. https://i.imgur.com/hcekEar.jpg Volume is nothing special and we are back to the flip flop. Title: Re: Globb0 BTC charts Post by: FullNode on April 20, 2020, 09:57:26 AM Selling in May and leaving, this rule does not apply for this year, the halving is close and I am almost sure of an upward movement in the to $8,500 o $ 9,000.
Title: Re: Globb0 BTC charts Post by: exstasie on April 20, 2020, 10:44:34 AM Selling in May and leaving, this rule does not apply for this year, the halving is close and I am almost sure of an upward movement in the of $ 9,000. I think the opposite. All the more reason to sell. "Buy the rumor, sell the news." I think $9K+ is very possible by the end of Q2 but the closer we get to the halving, the closer the possibility of a selloff. After 5 or 6 green weekly candles, don't be surprised when we get a few red ones. Title: Re: Globb0 BTC charts Post by: Tytanowy Janusz on April 20, 2020, 10:50:18 AM
It's because of contango (https://en.wikipedia.org/wiki/Contango). Some futures are rated at 13$ (https://www.marketwatch.com/investing/future/CLK20?mod=MW_story_quote), some at 23$ (https://stooq.pl/q/?s=cl.f) depends on delivery time (first one (13$) has delivery time set to May and expires tommorow. No one wants oil even at 13$ now because of storage shortage). Contract that expires in Jun is evaluated almost 80% higher, 28$ for oil delivered in July and 30$ for oil delivered in August. It's not as bad as it looks like but no matter if its 13$ or 40$ i agree that the corporate bond market for shale oil companies in the US is a ticking bomb. Title: Re: Globb0 BTC charts Post by: exstasie on April 20, 2020, 11:29:17 AM
It's because of contango (https://en.wikipedia.org/wiki/Contango). Some futures are rated at 13$ (https://www.marketwatch.com/investing/future/CLK20?mod=MW_story_quote), some at 23$ (https://stooq.pl/q/?s=cl.f) depends on delivery time (first one (13$) has delivery time set to May and expires tommorow. No one wants oil even at 13$ now because of storage shortage). Contract that expires in Jun is evaluated almost 80% higher, 28$ for oil delivered in July and 30$ for oil delivered in August. It's not as bad as it looks like. Contango explains the price difference between May and June contracts, but it doesn't explain why oil is crashing. I assume oil is crashing (now down 80% for the year) because of plummeting demand as global trade dies down. In that way, it may be a leading indicator of what's to come for stock markets, which I feel haven't fully priced in the revenue and GDP costs of the slowdown. I'm no expert though, just another spectator watching the fireworks. :D Title: Re: Globb0 BTC charts Post by: Tytanowy Janusz on April 20, 2020, 12:13:00 PM Contango explains the price difference between May and June contracts, but it doesn't explain why oil is crashing. It's extreme case. Average contango for oil is equal to few percent. Now its close to 80%. Currently, Oil is worth 11$ per barrel (damn 2 $ down from my last post) but you can earn +10$ per barrel only for storing it for a month. Tomorrow this contract will close and everyone will forget about it. New one will have different delivery time and will be priced ~20$. Yes it shows how extremely low demand we had in April compared to high supply that float market without OPEC+ but even more shows that everyone filled "storage bags" to the max and is not even able to get more in May and short Jun contract to earn 10$ per barrel guaranteed profit. Such high contango shows short term storage shortage. I would not look at contract that expires tomorrow in current circumstances. Title: Re: Globb0 BTC charts Post by: exstasie on April 20, 2020, 12:33:46 PM Contango explains the price difference between May and June contracts, but it doesn't explain why oil is crashing. It's extreme case. Average contango for oil is equal to few percent. Now its close to 80%. Currently, Oil is worth 11$ per barrel (damn 2 $ down from my last post) but you can earn +10$ per barrel only for storing it for a month. Tomorrow this contract will close and everyone will forget about it. New one will have different delivery time and will be priced ~20$. You're a real glass half full kind of guy, eh? :) Crude just dropped 38% in a day and 82% on the year. You think everyone will forget about that? I would say it this way: The current contract is the real price. The price differential between May and June implies an anticipated recovery by June. As you point out, the difference is normally only a couple % to account for storage costs. The June contract will drop due to premium decay and if the economic outlook worsens, it'll be right back near $10 again. That's the glass half empty scenario anyway..... Title: Re: Globb0 BTC charts Post by: Globb0 on April 20, 2020, 12:53:51 PM At some point when supply comes cheaper than extraction they will be shutting down operations and switching to buyer mode.
Relaxation of quarantine and unjamming of distribution systems would likely case a resurgence in oil price. The top point was the same at some points in BTC history. Buying directly was more efficient than buying mining equipment and then mining. Title: Re: Globb0 BTC charts Post by: Tytanowy Janusz on April 20, 2020, 04:49:30 PM You're a real glass half full kind of guy, eh? :) Only when i'm talking about bitcoin :) Meanwhile OIL price. https://i.imgur.com/GgoGKAy.png link (https://www.marketwatch.com/investing/future/clk20/charts) You still call it "real price"? Its contract price for delivery oil in May it may even go to ~0. This price shows not only shortage of oil demand but also short term shortage of storage and no trader will buy it now because he has to sell it today/tomorrow and a bunch of guys who bought month ago at 20$ are saving money selling now. I might be wrong (not the first time :) ) but it will close and next contract will open at ~20$ range. Edit: -35$! now. Didn't expect that. https://i.imgur.com/tDbnvVW.png Damn i went way to far with this off-topic. Its BTC TA thread not oil thread. Sorry for this. Back to BTC. RED ALLERT. Title: Re: Globb0 BTC charts Post by: cryptomaniac_xxx on April 21, 2020, 08:08:58 AM Oh well, all has been answered in the last couple of days.
$7250 got rejected again, the green candles around $6950 has been broken, and this scenario could point out to another bear trap. Although the movement is very slow and we might not see those big dumps, but definitely a bear flag has formed already. Title: Re: Globb0 BTC charts Post by: Plaguedeath on April 21, 2020, 08:18:23 AM Edit: -35$! now. Didn't expect that. https://i.imgur.com/tDbnvVW.png Damn i went way to far with this off-topic. Its BTC TA thread not oil thread. Sorry for this. Back to BTC. RED ALLERT. You will get payed by buying crude oil And hold for long time and then sell it Twice profit 8) https://i.ibb.co/GnLMwKj/crudeoilmeme.jpg (https://imgbb.com/) Title: Re: Globb0 BTC charts Post by: Globb0 on April 21, 2020, 12:10:50 PM You're a real glass half full kind of guy, eh? :) Only when i'm talking about bitcoin :) Meanwhile OIL price. https://i.imgur.com/GgoGKAy.png link (https://www.marketwatch.com/investing/future/clk20/charts) You still call it "real price"? Its contract price for delivery oil in May it may even go to ~0. This price shows not only shortage of oil demand but also short term shortage of storage and no trader will buy it now because he has to sell it today/tomorrow and a bunch of guys who bought month ago at 20$ are saving money selling now. I might be wrong (not the first time :) ) but it will close and next contract will open at ~20$ range. Edit: -35$! now. Didn't expect that. https://i.imgur.com/tDbnvVW.png Damn i went way to far with this off-topic. Its BTC TA thread not oil thread. Sorry for this. Back to BTC. RED ALLERT. Its all good everything in the world is part of the system. Discussion is welcomed. Negative interest rates, now You pay me to take oil? wtf? I definitely failed in the predicting the future sweepstakes 2010 I got none of these right. Working at the moment I will get to the charts later, I fear mor of the same old side rumble though ofc G0 Title: Re: Globb0 BTC charts Post by: Globb0 on April 21, 2020, 12:12:52 PM Edit: -35$! now. Didn't expect that. https://i.imgur.com/tDbnvVW.png Damn i went way to far with this off-topic. Its BTC TA thread not oil thread. Sorry for this. Back to BTC. RED ALLERT. You will get payed by buying crude oil And hold for long time and then sell it Twice profit 8) https://i.ibb.co/GnLMwKj/crudeoilmeme.jpg (https://imgbb.com/) I don't know if you will, what does the negative number even mean? how can something cost less than 0 in the future? Title: Re: Globb0 BTC charts Post by: Tytanowy Janusz on April 21, 2020, 12:44:37 PM I don't know if you will, what does the negative number even mean? how can something cost less than 0 in the future? As I already pointed out its extreme case but I didn't expect it to be that extreme. Negative prices has never happened before. What does that mean? This contract closes today. XXX barrels was contracted, XXX barrels was produced and XXX barrels has to be sent to buyers. If you hold this contract till tomorrow you will receive oil in May or you will have to pay for rolling contract (which simply means paying for storing actual goods. This fee is enormous now due to storage shortage - to be honest i don't know how much is that). Most retail trades does not want to store 1000 barrels in home (JK), so they need to sell. Everyone that actually need oil already bought to the maximum of storage space, and they can't get more even with negative price. So in other words price is negative because no one from actual users (f.e. refineries) is able to get more oil in May and a bunch of traders needs to get out of trade to not have problem with xxx barrels in front of their house (also paying for transport) or being hit with contract roll fee (which I don't know how high it is in current circumstances). So you (retail trader) pay someone (that's what selling in negative price is) for taking this risk out of you. Whole last month i was reading about going long on oil because Trump won't let oil to be that low for long. Those who did that now has to sell. At least that's how I understand this extreme case. Title: Re: Globb0 BTC charts Post by: exstasie on April 21, 2020, 01:34:56 PM I don't know if you will, what does the negative number even mean? how can something cost less than 0 in the future? As I already pointed out its extreme case but I didn't expect it to be that extreme. Negative prices has never happened before. That should serve as a reminder of the gravity of this situation. The scale of economic loss entailed by these shutdowns is completely unprecedented. We've never seen GDP contractions this big this quickly, or unemployment numbers nearly this large. Oil underpins the entire global economy, so when it collapses (due to both oversupply and unprecedented lack of demand) I think we should take note. It's not going to be "back to normal" in June no matter how much everyone hopes for it. In a way, the oil market is acting much more rationally than stocks, which seem totally disconnected from the economy right now. Title: Re: Globb0 BTC charts Post by: Globb0 on April 21, 2020, 04:26:37 PM The daily does look beary right now.
RSI continues to look flat in the middle https://i.imgur.com/OgjSoej.jpg Looking in the hourly there is almost an essence of a head and shoulders pattern. Hmmmm Title: Re: Globb0 BTC charts Post by: JayJuanGee on April 22, 2020, 05:04:14 AM I'm bullish. After 5 years trading stocks and 2.5 years on crypto the only thing that cheated me the least is whale hunting. Who is selling? 1- Halving traders 2- In need of money due to covid 3- TA traders due to perfect short position (breaking triangle and bouncing from strong trend line - target 4000$) 4- covid panic sellers Who is buying? Literally no one. I don't see even a single reason why to buy now. Even a single buy signal. My whale detector flashes red. We should test 6000-6400 and meanwhile we stay at 6800 - at perfect short/sell price. Market most often does not give you 2 days to open position in situation like this one. Maybe it's because of the holidays and price will crash making me looking like an idiot. Nevertheless, I posted that because based on my trading experience someone is buying the false breakout. I note your above comment of seeming frustration, Tytanowy Janusz: "Who is buying? Literally no one. I don't see even a single reason why to buy now. Even a single buy signal." Actually one of the strongest tactics in bitcoin is to play the longer term, so in that regard, it is always good to buy bitcoin, so long as your time horizon for any one purchase is 4 years or longer. Additionally, if you have 10 years or more in your investment horizon, then a lot of your buys early in your time horizon will likely give you an additional 6 years of more for them to just ride out, and in that regard, bitcoin seems to continue to be an asymmetric bet that has very great odds of paying off well. Sure, there is no problem with what Globb0 is attempting to do here, which is perhaps try to play around with some short term and try to stack some more sats, but hopefully the overall strategy remains trying to accumulate bitcoin and perhaps even just stacking sats aside (that you do not trade) in order to make sure that you continue to build your principle, don't gamble too much and are largely attempting to hedge on the long term (rather than short term) upside (even if maybe in the short term, from time to time, you might make some decent calls, if you are mostly aiming for the long term and largely accumulating, then it might NOT make a whole hell of a lot of difference if you happen to stack some sats around our current $6,800 prices or if you got some in the lower $4ks a month ago or if you happen to have to buy some in the $8-$9k range a year ago (or maybe even later in this year). TLDR: Anytime is good to buy bitcoin, whether others are buying it or not, as long as you do not get too overly excited and you can just continue to buy on a regular basis. One of the realities, especially of younger folks, will be that they might not have any kind of lump sum of cash, and therefore they have to buy over years and years and years, and once a bit of principle is built up, then maybe they can take a part of what they have built up and play around with it (just always paying attention that they the are continuing to stack on the side and not gambling with too much of their principle on short term bets that may or may not play out). Title: Re: Globb0 BTC charts Post by: FullNode on April 22, 2020, 06:46:27 AM I think the opposite. All the more reason to sell. "Buy the rumor, sell the news." Precisely this, now people believe that before halving the price will fall and I am convinced that it will rise. 8)Title: Re: Globb0 BTC charts Post by: JayJuanGee on April 22, 2020, 07:04:37 AM I think the opposite. All the more reason to sell. "Buy the rumor, sell the news." Precisely this, now people believe that before halving the price will fall and I am convinced that it will rise. 8)Well, this time around, we had a couple of run ups in the BTC price that caused BTC prices to be above the mean of the four year fractal or where the stock to flow model might suggest, and so currently, we are in a spot that is very close to the mean. Yeah, none of those models are even close to guarantee, but there is likely some truth in a kind of tension that is created from the passage of time, increased adoption and the coupling of a halvening (every 4 years) in the midst of it. I have very few doubts that the halvening is going to create upwards pressures on BTC price, but I have a lot less confidence in trying to assert that allowance of that pressure to go upwards is going to play out either like the past cycles or even in a way that we can say that it has to happen now. At the same time, we have forces that want to either show that the models are not true or to cause them to shift down on the curve, so even if they are true, they are a smaller magnitude than expected. So in the end we cannot really count on when exactly or how exactly a likely upwards pressure is going to play out, even though betting on the likelihood of upwards movement seems to be a bet that is in your favor... and there is really no reason to doubt that bitcoin is not going continue as amongst the better performing assets, if not the best... does that mean it is the best because it is the least worse, well I hope not, but we are really in uncertain times, and there might be some people pushing for Armageddon to play out too... Armageddon scenarios still seem to be less than 8-10% odds - sure they have come up from the about 1% or less odds from a couple of months ago, but they are not something to be putting too much preparations into when the way more likely scenarios do not end in Armageddon.. but instead end in various ways that bitcoin performs relatively well (closest competition seems to be gold, and that remains quite heavy and even difficult to divide and verify or to otherwise to really practically deal with, even if Armageddon were to come). Title: Re: Globb0 BTC charts Post by: exstasie on April 22, 2020, 07:40:48 AM I think the opposite. All the more reason to sell. "Buy the rumor, sell the news." Precisely this, now people believe that before halving the price will fall and I am convinced that it will rise. 8)People seem awfully bullish to me. The majority in the Wall Observer poll are expecting higher prices, with most expecting $10K+. So I wish I could be bullish on the halving from a contrarian sentiment point of view but I sense very little fear in the market. This is unlike early 2016 where there was persistent fear around dropping hash rate, which the market bucked, and price doubled by June. This time, the market has already doubled and bulls seem expectant of more. That makes me wary. The $8,000s are still possible in the shorter term but my overall sense is that bulls are greedy and need to be shaken out. Same with the stock market. Title: Re: Globb0 BTC charts Post by: Globb0 on April 22, 2020, 08:10:59 AM Sure, there is no problem with what Globb0 is attempting to do here, which is To see what we can learn over time and when we were right or wrong. This is a learning thread from my point of view. and then a record so you cant mysteriously shift to the opposite all the time (like all the fakers) or forget the wrong calls. Im bringing in a post from elsewhere this morning.... thanks Toxic Shall we talk about....bitcoin? :o The Corona crawl continues... Bitcoin still seems to working...not much other than that to report today. The consolidation between $6.95k and $6.75k is showing us some resiliency as legacy markets continue to take a beating. 1h https://i.imgur.com/aq0muKF.jpg I think we will see some acceleration in movement as we get closer to the end of the week. Orca in the waters brings change. 4h https://i.imgur.com/7ScSXgh.jpg Looks to be a little bit of a spinning top forming, usually a indicator signaling traders are unsure which way the market wants to go. #dyor D https://i.imgur.com/vEfFivp.jpg #stronghands Quote usually a indicator signaling traders are unsure which way the market wants to go Definitely getting this feeling. I suppose it will go and catch a lot of people out 1 way or the other. Title: Re: Globb0 BTC charts Post by: cryptomaniac_xxx on April 22, 2020, 11:06:46 AM ^^ The good thing is that so far we're trading above strong support levels, personally, shorting when we are near the bitcoin block halving, doesn't makes sense.
So we should look closely at the $6950 levels and see how it goes. Title: Re: Globb0 BTC charts Post by: Globb0 on April 22, 2020, 03:44:55 PM Moar sidewayz
Is this going to ping off suddenly? then in which direction? mix of bearish and bullish around the place. What will happen, halving, world chaos, no one has any spare money, etc. etc. I feel the uncertainty is reflected here https://i.imgur.com/hvzHgzX.jpg Title: Re: Globb0 BTC charts Post by: cryptomaniac_xxx on April 23, 2020, 08:40:06 AM Moar sidewayz Is this going to ping off suddenly? then in which direction? mix of bearish and bullish around the place. What will happen, halving, world chaos, no one has any spare money, etc. etc. I feel the uncertainty is reflected here I feel you mate, really lots of uncertainty, geo-politics, geo-economics, the world is changing. Although their is a feeling that money will come pouring to the market because of the halving, but this is not we are seeing. Some so called 'experts' even predicts the the stimulus package--> crypto, but we are not sure if that is going to happen. And recently, we have witnessed and for many years, we held on the 'philosophy' that it is a safe harbor asset, with no correlation to the global traditional markets. Those narrative was put to test when Covid-19 struck us and we become to question bitcoin and crypto in general. Others call this the 'black swan'. As you have said, we have been struck in the side-way patterns for the last two-three weeks, volume is weak and it seems that this spike is just for a short term only. So yes, we might be still in chaos, we don't really pray for recessions to test the bitcoins safe haven narrative. But it looks like we're in the zone, wherein there is a looming economic recession in the horizon. Title: Re: Globb0 BTC charts Post by: Globb0 on April 23, 2020, 02:49:52 PM Obvious pump is obvious. Caution fellows.
https://i.imgur.com/9ELKPLg.jpg Looking for the daily to close above the resistance for confirmation https://i.imgur.com/qpuWBnF.jpg Title: Re: Globb0 BTC charts Post by: cryptomaniac_xxx on April 24, 2020, 03:27:38 PM Title: Re: Globb0 BTC charts Post by: Globb0 on April 25, 2020, 09:36:07 AM Looking for the daily to close above the resistance for confirmation And it does https://i.imgur.com/UJcjGmk.jpg What now? feeling a little retest and then maybe go for the up Looking at the hourly great news the resistance seems to have turned to support. https://i.imgur.com/NbDhUMo.jpg Title: Re: Globb0 BTC charts Post by: cryptomaniac_xxx on April 27, 2020, 04:38:11 AM What do you think about the volumes though? it looks weak to me, I don't know if we are going to push through $7800-$7900. The bullish pattern is slowing down, and i don't like to be buying at that resistance.
Title: Re: Globb0 BTC charts Post by: Globb0 on April 27, 2020, 07:40:38 AM yeah, it was the weak end. But looking back a few charts volume is a concern a few times.
https://i.imgur.com/CJpBJye.jpg Lets see where Monday takes us. Still above atmo Title: Re: Globb0 BTC charts Post by: Tytanowy Janusz on April 27, 2020, 07:43:17 AM I note your above comment of seeming frustration, Tytanowy Janusz: "Who is buying? Literally no one. I don't see even a single reason why to buy now. Even a single buy signal." I was not frustrated at all :) I was excited. In my post i was trying to show one of my thoughts about market - that in middle term you can earn by "whale hunting". Which was also well described by exstasie: Probably the most important question a trader can ask himself: where does the market not want to go? We had a lot of easy to spot sell signals, no technical buy signal and price didn't want to go down. Someone was filling bags - in most cases it is worth to join him. Of course i agree with all your statements about buying bitcoin all the time because in longer term it will yell better ROI than from speculations and for sure some buys was made by this type of investors but i think that their power is too small and too widely distributed to stop price in the best short position price from technical point of view. My other system is observing market reactions to big news. Here I predicted that 6100 is only a short stop during 3500-14000 bull run based on that. I'm very bullish for bitcoin since finally it is bad news resistant. That's the first indicator of the end of bear market We had CBOE delisting news without any dump (i know its not bad news but look at it from lambo investor perspective. All of them was waiting for bakkt and btc etf and ... bum bitcoin is being delisted from cboe) It was, in my opinion, fud producing news and should dump bitcoin). We had "bitfinex print 850 MM" news and only 3% dump? Under resistance? We should see dump at least 10% without this news simply from TA (fighting with very strong resistance, resting from 60% pump) had we had 3% dump with this news. We had binance 40MM hack and next day we have break 6k resistance. We are growing constantly with bad news hitting the market one after another. Guess what will happen when good news will hit market. What do you think about the volumes though? it looks weak to me, I don't know if we are going to push through $7800-$7900. The bullish pattern is slowing down, and i don't like to be buying at that resistance. I think that every trader should make decisions based on the best data. Charts that you look at show 300 BTC volume where there was 8 000 BTC volume on binance futures. I think that it is the best practise to observe charts and volume bars on the most traded exchanges because that's where whales are trading to buy/dump coins without pushing price. Real volume is showed there. https://i.imgur.com/dNbB0j0.png Based on that breakout volume on 4h candle was almost as big as during 7500-5200 dump and currently is close to average even though price is closed in 7400-7600 consolidation for 4 days. Im conclusion its not that bad. Title: Re: Globb0 BTC charts Post by: JayJuanGee on April 27, 2020, 05:13:18 PM [edit out] Of course i agree with all your statements about buying bitcoin all the time because in longer term it will yell better ROI than from speculations and for sure some buys was made by this type of investors but i think that their power is too small and too widely distributed to stop price in the best short position price from technical point of view. I think that my overall point was not even really any kind of an attempt to predict short term BTC prices. Yeah, we can have all kinds of analysis and theories about where the BTC price might be going in the short term and why, and even when we are seeming to be 90% right in our analysis regarding what way the BTC price should go, the price still ends up going in the opposite direction, and perhaps those kinds of opposites happen because bitcoin still is quite relatively illiquid as compared to other assets, and if some BIG player wants to push the BTC price in one direction or another in the short term, maybe other whales might not really feel so strongly as to go against him, so he is able to push the BTC price, in the short term, in the direction that he wants because he is willing to inject capital in that direction. Sure, sometimes, such whale fails to achieve his short term objectives, too. So, in essence, I tend to poo poo technical analysis quite a bit, even though sometimes it is interesting to view what some members are saying in regards to price pressures and dynamics that they see based on a variety of indicators in the charts.... but in the end, there has been a lot of appreciation of value that had come to people who have either completely refrained from trading and/or engaged in tactics that merely involve buying regularly and maybe from time to time attempting to buy a bit more on dips. I am NOT suggesting to NOT play around at all, but I personally believe that any trading should be a tactic that involves a minority of the value of the BTC holdings of anyone who seriously wants to profit overall from the ongoing accumulation of BTC. Of course, one of the main sure things in bitcoin continues to be its ongoing and seemingly inevitable volatility, so even if we consider that maybe the BTC price is ultimately going to go up in the long term, and it has good odds in terms of being a seemingly decently great asymmetric bet towards the upside. In the short term, there are likely ways to attempt to profit from the seeming inevitable volatility - without having great insight towards how much probability to assign to one price direction or another. So, yeah it seems that some of BTC's volatility has gone down somewhat with the increases in the market cap, so it takes much BIGGER players to push BTC prices in extremes, but the ongoing entrance of BIGGER and BIGGER players into bitcoin does seem to cause a decent amount of continued ongoing extreme volatility, and maybe BTC has to accomplish another 50x to 100x increase in its market cap before the volatility simmers down a bit, and even a 50x increase in BTC market only puts bitcoin in the neighborhood of Gold's current market cap, and many folks theorize that bitcoin has attributes that make it much better than gold in terms of scarcity, verifiability, portability, divisibility and ease of NOT having to rely on as many third parties, so in many senses, even 100x price appreciation from here remains a kind of small potatoes, and likely will continue to experience volatility, but likely continued lessening of volatility as the world gets used to bitcoin and its various value propositions.. so in the meantime, HODLers should be able to figure out ways to profit from the ongoing likely upwards potential that is likely to be accompanied by inevitable and diminishing volatility, but it still could take a few more halvening cycles for bitcoin to solidly get above gold's market cap, but at the same time, we cannot even be sure about how quickly any of the outrageousness can happen based on seemingly crazy-ass monetary (and safe haven asset) times in which we currently live. Title: Re: Globb0 BTC charts Post by: Globb0 on April 28, 2020, 07:58:59 AM Here is todays news.
Nothing much to see on the daily. We are OK. Nice run of green candles, where will we close today? https://i.imgur.com/F4Evg1y.jpg The hourly chart is looking noisy, but we are edging up. Title: Re: Globb0 BTC charts Post by: VB1001 on April 29, 2020, 05:38:46 AM The bulls finally broke 7,800 today we are likely to test 8,000.
BTCullist Title: Re: Globb0 BTC charts Post by: Globb0 on April 29, 2020, 11:27:08 AM Looking for the daily to close above the resistance for confirmation And it does https://i.imgur.com/UJcjGmk.jpg What now? feeling a little retest and then maybe go for the up Looking at the hourly great news the resistance seems to have turned to support. https://i.imgur.com/NbDhUMo.jpg This was spot on then, we haven't gone back into the support, moving up the channel https://i.imgur.com/dXb4kQS.jpg Title: Re: Globb0 BTC charts Post by: cryptomaniac_xxx on April 29, 2020, 12:01:34 PM If we clear $8k, then this could be a bull run. We have cleared it already, definitely we are heading on the next level guys. T-minus 12 days before the halving.... https://i.imgur.com/AHhnecx.gif Title: Re: Globb0 BTC charts Post by: Tytanowy Janusz on April 29, 2020, 01:18:10 PM Well this volume might be a trap in data understanding. Just take a look:
https://i.imgur.com/BsmkCYx.png Volume looks like its constant with average around red line. But its volume evaluated in bitcoins. If you evaluate this volume in dollars (calculate something like purchasing volume) it looks like we have 350k bitcoins traded in 15.03 at price 5000$ (1 750 mln $) and now have 350k BTC traded at price 8000$ ( 2 800 mln $) so daily volume in $ is constantly increasing (+60% in 1.5 month - full recovery - impressive). To be honest i don't know why exchanges shows trading volume in BTC. Stock shows trading volume in $ not shares. Title: Re: Globb0 BTC charts Post by: exstasie on April 29, 2020, 07:19:08 PM Well this volume might be a trap in data understanding. Just take a look: https://i.imgur.com/BsmkCYx.png Volume looks like its constant with average around red line. What exchange is that? Can't tell from the screenshot. There are only a couple handfuls of exchanges that actually have consistently real volume and determine price discovery. That volume profile looks pretty sketchy to me, different than the majors, which had more consistently declining volume over March and April followed by a spike today. This is Coinbase: https://i.imgur.com/jJlVh6D.png Anyway the point may not matter. Declining volume can indicate bear flag behavior, but it can also just indicate consolidation before breakout. Price action takes precedence. Title: Re: Globb0 BTC charts Post by: Globb0 on April 29, 2020, 07:47:05 PM I remember from years back the BTC price rising on declining volume. Its not the be all and end all. Just another factor.
Nice price Title: Re: Globb0 BTC charts Post by: FullNode on April 30, 2020, 06:44:19 AM Selling in May and leaving, this rule does not apply for this year, the halving is close and I am almost sure of an upward movement in the to $8,500 o $ 9,000. We arrived $9,300 ;D Title: Re: Globb0 BTC charts Post by: Globb0 on April 30, 2020, 09:31:40 AM Happy morning to you all
Daily is solidly closed above the channel and it was an up signal. https://i.imgur.com/nnvXaQu.jpg Dropping in to extreme zoom, There is a retest confirming the long position and then a reversal signal for go short https://i.imgur.com/btN1p0i.jpg Not for me though margin is too risky. Still I want to learn the signals and they are there this time. Title: Re: Globb0 BTC charts Post by: Tytanowy Janusz on May 01, 2020, 08:18:34 AM What exchange is that? Can't tell from the screenshot. Binance futures. By the way if their volume is real they hit historical moment yesterday. 15 mld$ daily volume that is more than 50% higher than previous record. https://i.imgur.com/5ArEdVM.png Looks like we close another candle above resistance. Is it the end of "re-tests" and the beggining of second wave to 10k+? Title: Re: Globb0 BTC charts Post by: exstasie on May 01, 2020, 08:46:18 AM What exchange is that? Can't tell from the screenshot. Binance futures. By the way if their volume is real they hit historical moment yesterday. 15 mld$ daily volume that is more than 50% higher than previous record. Ah, I don't take their volume too seriously. CZ is the master of fake volume. :) It makes sense they would have volume extremes anyway, since we saw epic volume on Coinbase too: https://i.imgur.com/4i7gjqX.png The dangerous thing about that? Look to the left at that October 2019 failure. Another example of a very high volume daily wick. I'm very curious to see what the next few days brings. I'm neither long nor short, just waiting for another good setup. Title: Re: Globb0 BTC charts Post by: Globb0 on May 01, 2020, 09:42:13 AM Allllllrighty then. Daily, still stayed nice above my channel. Is that a flagpole pattern? can be an indicator of going up the same again soon? I maybe missdrew it a bit too high looking at it now. https://i.imgur.com/i9xdIEg.jpg On the hourly, a tiny dip only into the old channel and only for a few seconds https://i.imgur.com/sA68rhn.jpg I drew in the new support resistance Title: Re: Globb0 BTC charts Post by: Globb0 on May 03, 2020, 11:17:57 AM 3rd of may be with you
Still pushing on OK. Its the Weak end again for volume Just do it Bitcoin! https://i.imgur.com/Hv7qzhj.jpg Hourly is pipping along nicely. https://i.imgur.com/Oah6Azi.jpg Title: Re: Globb0 BTC charts Post by: Globb0 on May 04, 2020, 02:07:18 PM Daily BTC chart is this the retest? if reverses here I say up. Still above the support of the old channel https://i.imgur.com/vHvGelz.jpg Looking at the hour you can see it skimming along the top of the channel too https://i.imgur.com/4fJpt2B.jpg Title: Re: Globb0 BTC charts Post by: Globb0 on May 05, 2020, 08:52:02 AM There was the retest. So again a long signal? (with a sensible stop)
https://i.imgur.com/Ao5MPzn.jpg I am still only playing fantasy long and short to see if I am reading it right. Top of the RSI. But declining volume? didn't pick up from weekend on Monday. Might squeeze up? Title: Re: Globb0 BTC charts Post by: Tytanowy Janusz on May 05, 2020, 09:12:30 AM But declining volume? didn't pick up from weekend on Monday. I don't see declining volume in here. We have 2 huge bars from pump candle and stop rally candle (which is obvious, i would not expect them to be smaller than others) and then 4 similar bars and 1 that is not yet finished. IMO 1h candles are better for analysing 5 day volume change: https://i.imgur.com/z3JgPjv.png Title: Re: Globb0 BTC charts Post by: Globb0 on May 05, 2020, 10:27:48 AM That is fair comment. I meant in only the last 5 or 6 bars relative.
Looking along the whole chart volume is normal or slightly above I suppose. Title: Re: Globb0 BTC charts Post by: exstasie on May 05, 2020, 05:19:26 PM Still squarely inside the range. It's a bull flag until proven otherwise, but the upside headfake last night means bears are still in the game. The Bollinger bands are really tight, so if either of these 4-hour pivots ($8,533 and $9,126) get broken now, we should have a significant breakout.
https://i.imgur.com/DvOPOre.png Title: Re: Globb0 BTC charts Post by: Globb0 on May 05, 2020, 07:11:48 PM There was the retest. So again a long signal? (with a sensible stop) https://i.imgur.com/Ao5MPzn.jpg I am still only playing fantasy long and short to see if I am reading it right. Top of the RSI. But declining volume? didn't pick up from weekend on Monday. Might squeeze up? OK well learning exercise, I made a mistake. Not waiting for the daily candle to close before deciding. The signal disappeared a bit later. Another lesson learned (reminded in fact) wait for the candle to be closed. Now it did indeed close higher, so the signal is there. Im getting confused doubting myself. But it wasn't wrong, just a bit eager. Title: Re: Globb0 BTC charts Post by: SeaBits on May 05, 2020, 07:15:47 PM Thanks for posting these with explanations, I enjoy seeing what all the users say about their charts.
6 Days to go till the 1/2ing. Keep up the good work. Title: Re: Globb0 BTC charts Post by: Globb0 on May 06, 2020, 02:52:04 PM A different chart for today. Sometimes its good to zoom out.
These are 1 Week candles. https://i.imgur.com/K0uVOAv.jpg Title: Re: Globb0 BTC charts Post by: Globb0 on May 08, 2020, 06:26:37 PM So we were definitely right with the long signal, would I have had the nerve to keep it open? not sure I did get scared.
But now its closed (daily candles) and smashed through exactly as predicted. https://i.imgur.com/cxFaqzd.jpg When I am comfortable with my decisions I will probably start trading these Title: Re: Globb0 BTC charts Post by: JayJuanGee on May 08, 2020, 06:50:36 PM When I am comfortable with my decisions I will probably start trading these First: Don't do it, Globb0. All we need is another disaster (I feel like I am stifling you). Second... Alternatively: But if you do, do it. (can't stop the determined, right?). Maybe if you start with a very small budget, then that would not really hurt anything right? It's a kind of learning, right? Don't need to make a lot of money, right? Let's say for example, you have a $50k bitcoin budget (value of your bitcoin and dollars combined).. how much of your budget are you going to dedicate to your learning process? Maybe start with 1% to 5% of the value of your budget, at most. That would be $500 to $2,500. One of the difficulties after you started a budget, would be making sure that you manage the budget well and you do not have to go beyond your budget. Of course, you can increase your budget with the passage of time, but you do not want to spend all of the value of your budget on whatever trading positions that you might end up taking because it would be easy to run out of budget if you do not outline some trading budget management goals... Title: Re: Globb0 BTC charts Post by: Globb0 on May 08, 2020, 07:11:42 PM Its all fair comments. ATMO I'm not risking anything.
This is open and transparent. I have been right a few signals though now, must have the correct stops. That's a bit I still need to learn. Title: Re: Globb0 BTC charts Post by: JayJuanGee on May 08, 2020, 07:45:13 PM Its all fair comments. ATMO I'm not risking anything. This is open and transparent. I have been right a few signals though now, must have the correct stops. That's a bit I still need to learn. I am kind of second-guessing my above response to you, and probably, I am more inclined to assert that you should actually play around with actual money.. rather than abstaining.. in other words, the second option is better than the first, and the first was kind of a joke (and maybe a warning, too). I personally believe that any of us learn way more about ourselves and even the strengths of our convictions, our risk tolerance, our cashflow, our view of the asset (short term and long term) and insights regarding how to combine these factors and allocate our various risks when we use actual money rather than mere theory that has little to no stake in the prediction matter. A problem that many many people tend to have is that they immediately want to go BIG or go home, and fuck all of that. No need to do that.. I think that starting with the bare minimum that any particular exchange will allow you will allow you to play with some of the matters. Many of us should be able to figure out ways to afford minimum order amounts.. which are probably around a few dollars...and exchanges vary, which allows flexibility.. and some do not even seem to have minimums... Let me see if I can elaborate on the idea of doing small amounts. I told my story a large number of times, and, so when I started with my system in 2015 that sells on the way up and buys on the way down and attempts to structure such buy/sells in ways that do not give any shits about whether the BTC price moves up/down, there were many times that I was only making pennies each time that my orders were filled. I made sure that all of the trading fees were included in calculating whether my trades were executed in order that I could figure out ways that I was actually making profits from every single order fill, but other than that, I set up a system that I believed was designed in order that I would largely have gains NO matter which way the BTC price went, and I have been employing tweaked variations of my system ever since. Surely the beginning hardly involved any profits at all, yet I was learning about myself and my tolerances along the way and also my record keeping and the way that I would account for my activity choices.. sure I made quite a few mistakes, too. Even if I was not making a lot of profits, I used to consider that my goals were to learn about myself, and just using my buy/sell orders as a means to insure my BTC holdings, somewhat, against what seemed to be inevitable volatility.. and also my built-in assumptions continued to be that the BTC prices would go up in the longer run, even though I did not know what the fuck they would do in the shorter run. Of course, your current system is attempting to predict BTC's price direction, so maybe you have to be a lot more careful based on your differing assumptions; however, in my case my BTC trading was structured around not knowing or even giving much if any shits regarding the short term BTC price movements while making sure that I was also o.k. keeping my assumptions that bitcoin would go up more than it went down in the longer term. Even though some of your system, assumptions and ways that you employ are different from mine, there are still probably ways that you can attempt to design around your differences and figure out ways to tweak, including maybe even figuring out ways that you can have set ups that cause you to win no matter what.. if that is possible or even one of your goals. Title: Re: Globb0 BTC charts Post by: Globb0 on May 08, 2020, 10:06:51 PM You are right. Nobody got rich by procrastinating.
You have to go for it. Or else you are the could have been guy Title: Re: Globb0 BTC charts Post by: Globb0 on May 08, 2020, 10:11:29 PM I wanted to add something more I have been telling the kids these days in lockdown.
They are finding some xbox games hard, (I know I spoiled them with an xbox x) I told them this. If games were easy what would you learn? what would be the challenge? We do it because it is hard applies here. Then as you finally crack it you learned something. You never learn in easy things, just "see I was right Im so great" which in actual fact is massively negative Title: Re: Globb0 BTC charts Post by: Hueristic on May 09, 2020, 02:47:15 AM I wanted to add something more I have been telling the kids these days in lockdown. They are finding some xbox games hard, (I know I spoiled them with an xbox x) I told them this. If games were easy what would you learn? what would be the challenge? We do it because it is hard applies here. Then as you finally crack it you learned something. You never learn in easy things, just "see I was right Im so great" which in actual fact is massively negative https://youtu.be/vMtjnrBcHdI?t=25 Title: Re: Globb0 BTC charts Post by: Globb0 on May 09, 2020, 09:23:54 AM I am more inclined to assert that you should actually play around with actual money.. I slept on it, I think its not even good enough to just have the correct stops (though they are important) I think to maximise things you need to be sat in front of it, reacting and adjusting. That feels far more like gambling, shall I cash out or wait on a bet type thing. Similar, maybe indicating this is just betting of a sort. This high maintenance approach seems in direct contrast to your more passive set it and forget it approach with ladders. Its all interesting to me. I also got a few more free courses on udemy. So I will find some time to continue the learning. Meanwhile in Bitcoinlandia (like it Jay? :) ) https://i.imgur.com/jrN4jSl.jpg Something of a reversal indicator (not always if *retests then up) Most interesting was the sudden turn in the moving trend line. See it suddeny switched to the bottom of my channel and now is hugging that line. Weird coincidence? or does it mean something? Im not sure. RSI is still in its peaky area. Hourly is there a hint of the *retest here, early to say yet on the daily https://i.imgur.com/oP8NFfB.jpg So you would just have to be watching for these signals all the time Title: Re: Globb0 BTC charts Post by: JayJuanGee on May 09, 2020, 05:05:45 PM I am more inclined to assert that you should actually play around with actual money.. I slept on it, I think its not even good enough to just have the correct stops (though they are important) I think to maximise things you need to be sat in front of it, reacting and adjusting. That feels far more like gambling, shall I cash out or wait on a bet type thing. Similar, maybe indicating this is just betting of a sort. This high maintenance approach seems in direct contrast to your more passive set it and forget it approach with ladders. Its all interesting to me. Even though my system strives towards mostly passivity in terms of attempting to cause a certain amount of emotional neutrality in regards to BTC price direction, over the years, I have frequently reverted to thinking about how my btc buy/sell orders are placed and whether emotional neutrality is sufficiently achieved and maintained. There seems to be no real way to completely remove some emotions especially since I am largely attempting to stack towards an upwards BTC price direction preference. Believe me, I have given some (maybe superficial) thoughts to how increasing the stakes (such as using leverage or figuring out ways to short) might change the dynamics of my system and my comfort levels in regards to my BTC order placements, and frequently I get too nervous when I consider the possible employment of some of those other tools. I am not really sure if I might be handicapping myself, but my ongoing strategy has not really been involving shorts. My ongoing system has been employing the placement of longs and closing those longs and if the BTC price drops to employ new longs with the money generated from closing longs at higher prices. There are not too many members who have attempted to publicly describe their strategy as being similar to mine, but supplementing something like my system with the employment of shorts into the mix. The only member that I recall attempting to publicly describe his system in such terms is d_eddie, but even he said that it was very time consuming, and I am thinking that he might have been feeling like he is spinning his wheels a bit much, once he tries to incorporate prediction in the mix. So, yeah such a system will likely work a bit better if the trend is largely down, but sometimes surprise upward movements could end up wiping out most if not all profits, if you had been betting down and then the price ends up moving against you. I also got a few more free courses on udemy. So I will find some time to continue the learning. One advantage of what you seem to be attempting Globb0 is that you seem to be attempting to make your learnings your own system, so of course, learning whatever techniques that you can feel comfortable employing. Each trader does seem to have his/her own angle in terms of which tools and indicators s/he relies upon in order to filter through information and to make order placement decisions. Meanwhile in Bitcoinlandia (like it Jay? :) ) You mean do I like the recent dip? Which might mean that we are just holding off from going above $10k or that we might end up reversing from here? Either way, I am o.k. Of course, I prefer up, but I really can understand that there could be a bit of a short-term deeper correction, especially since we have not really had one for close to two months. I doubt that a deeper or longer correction is necessary in order to continue up...so this might be merely extended consolidation and coiling for a bit of time until there is a bit more bull readiness to continue with UP.. or at least allowing a bit more buy support to continue to build up and to catch up before resuming up. In our current situation, my latest BTC sell orders executed at around $9,300 $9,450, $9,700 and $9,950... My next BTC sell orders are $10,200, $10,450, $10,700 and $10,950, and thereafter my sell orders go up to $500 (instead of $250) increments until $15,000 and then go up to $1,000 (instead of $500) increments. My next buy orders are $9,200, $9,050, $8,800, $8,550, $8,300, $8,050, $7,800, and continuing similarly all the way down and pretty much stay in $250 increments all the way down. By the way, Globb0... this might be a bit of an aside. You can employ some kind of system that you know works, no matter what is the BTC price direction, that does not involve betting. I engage in that behavior, sometimes. I start to feel as if the BTC price has greater chances to move in one direction or another, and I may even get some feelings that I tend to be correct a lot more than I am not correct, but I still do not change my buy/sell orders, merely because I have feelings and I believe that the price is more likely to go in one direction or another. When you have active orders, however, you will likely become more actively engaged in paying attention to some details that you might have otherwise overlooked, which also might affect your thinking in terms of whether you want to employ some extra ammunition in one direction or another, and also if you have active orders, it is way easier to just tweak them in accordance with your expectation rather than placing new orders, when you do not have any orders outstanding. That's my sense. https://i.imgur.com/jrN4jSl.jpg Something of a reversal indicator (not always if *retests then up) Most interesting was the sudden turn in the moving trend line. See it suddeny switched to the bottom of my channel and now is hugging that line. Weird coincidence? or does it mean something? Im not sure. RSI is still in its peaky area. Hourly is there a hint of the *retest here, early to say yet on the daily https://i.imgur.com/oP8NFfB.jpg So you would just have to be watching for these signals all the time I admit that I do look at these kinds of plottings sometimes, just for curiosity sake, but they don't really affect me in the short term. Of course, if you are making bets, based on indicators that you see, then surely the indicators can change fairly rapidly, but I don't know if that means you act on it, or not.. that would depend I supposed in terms of if you believe that you should let the price come to you rather than moving your orders around too much. Title: Re: Globb0 BTC charts Post by: exstasie on May 10, 2020, 04:56:47 AM I slept on it, I think its not even good enough to just have the correct stops (though they are important) I think to maximise things you need to be sat in front of it, reacting and adjusting. I actually find staring at charts all day to be really harmful. It leads to all sorts of anxiety and second guessing, sometimes even terrible emotional behavior like pulling stop losses when unexpected things occur. I like to have firm rules set on my trades (entry, exit, stop loss) so I can walk away knowing that any potential loss will be a small one. Then I check the charts once a day (or twice, tops) and adjust targets and stops as needed. This at least works for trading on the 4-hour, daily, and higher time frames. Intraday trading is just too stressful and demanding. Title: Re: Globb0 BTC charts Post by: casperBGD on May 10, 2020, 09:35:43 AM I slept on it, I think its not even good enough to just have the correct stops (though they are important) I think to maximise things you need to be sat in front of it, reacting and adjusting. I actually find staring at charts all day to be really harmful. It leads to all sorts of anxiety and second guessing, sometimes even terrible emotional behavior like pulling stop losses when unexpected things occur. I like to have firm rules set on my trades (entry, exit, stop loss) so I can walk away knowing that any potential loss will be a small one. Then I check the charts once a day (or twice, tops) and adjust targets and stops as needed. This at least works for trading on the 4-hour, daily, and higher time frames. Intraday trading is just too stressful and demanding. yeah, i stopped trading because of self-discipline lack, it is better to analyse, invest and leave it that way, then trading and non-stop thinking about your trades, it is just not good for health, and this is too risky as well Title: Re: Globb0 BTC charts Post by: Globb0 on May 10, 2020, 11:14:20 AM Doesn't probably help I am a bit compulsive obsessive, or it does I don't know. I don't ever do things lightly.
Todays daily chart, Daily candle hasn't closed yet, still time for it to not be broken into the resistance. Also the resistance grew wider with that pointy tip. The reversal signal at the top was there and no retest came to push up higher https://i.imgur.com/fxDkWvv.jpg On the hourly chart what a contrast, the RSI is in the gutter here. https://i.imgur.com/zN34PQY.jpg Title: Re: Globb0 BTC charts Post by: JayJuanGee on May 10, 2020, 04:57:32 PM Doesn't probably help I am a bit compulsive obsessive, or it does I don't know. I don't ever do things lightly. #metoo Title: Re: Globb0 BTC charts Post by: Globb0 on May 11, 2020, 09:43:13 AM OKey dOKey
Closed and didn't break the support zone. And in fact now we have a bigger support zone. It has dipped back into the channel, though I'm not sure if that is still relevant anymore. https://i.imgur.com/07EeXkm.jpg A BIG triangle is coming to a head on the weekly view. Title: Re: Globb0 BTC charts Post by: 600watt on May 11, 2020, 11:06:22 AM the 1hour chart (stamp) looks a bit triple-bottomish like the 4 hour chart on may 18th. we will rise towards $10k and beyond within this month.
Title: Re: Globb0 BTC charts Post by: STT on May 11, 2020, 11:07:46 PM The lows are the 200 day average, thats big so it will bounce for sure though we cant be sure how far it will skip across the surface before it sinks or deflects upwards.
Here is the 2 day average which is a harsh measure of momentum and price only stays above when very bullish, 8 day is more consistent also above at present: https://talkimg.com/images/2023/06/12/A7Ufl.png So if we could get above 8800 or 8900 I'm more confident or slightly more accurately speaking that 50 ma on 1hr bars. I think it has to work out further the volume of the big red bar sell, 9200 was a really good sell price today as its going to take more of a push to get past this. Going on Globbo's chart and bigger time frames matter more, we should expect the market to throw off people and trade down to 7800 before any bounce. So we dip below 200 day average, its only an indicator so quite possible and then trade back, fake out then bullish attempt. Title: Re: Globb0 BTC charts Post by: Globb0 on May 12, 2020, 08:44:25 AM Hello hello gentlepersons
Welcome to the new paradigm Here's the chart for today, already another sign. Need to wait for the new green candle to close, if its bigger than the red chunk off we go up. https://i.imgur.com/inhNyD3.jpg Cautiously optimistic here Positive vibes positive vibes. Come on everyone! *edited to add Weekly chart* Going on Globbo's chart and bigger time frames matter more Here we see the 1 week candles chart. Intersting I think I spotted the bitcoin "angle" hehe :D https://i.imgur.com/Fvw0Gwm.jpg Title: Re: Globb0 BTC charts Post by: cryptomaniac_xxx on May 12, 2020, 02:14:37 PM ^^ How is every body doing? Time to start fresh again.
We shouldn't wait for the next 1,385 days to act, start today. ;D I'm looking at $9250-$9300! Title: Re: Globb0 BTC charts Post by: Tytanowy Janusz on May 13, 2020, 06:53:12 AM Its all fair comments. ATMO I'm not risking anything. This is open and transparent. I have been right a few signals though now, must have the correct stops. That's a bit I still need to learn. My suggestion is that: 1- just start. Don't wait. Minimum bet on binance is ~10$. You can start with 50$. How much are you risking? 1$ daily? This is nothing compared to lesson you will receive from each trade. You will see that buy/sell decision is much harder and completely different from writing post with possible buy signal. 2- add some spices. 50$ won't make you fill chills (butterflies in your stomach.). Something like ~x% profit = real word reward that you will set for yourself. Each fucked up trade is equal to ... whatever you imagine. But fucked up trade should be trade that you cheated with (f.e. push Stop loss lower - simple every action that is risky and in most cases leads to huge loses) not trade that you lost on. Because there would be many of them. Don't let your brain think that lost trade is something bad. Cheated trade is something bad even if it was profitable. Lost trade is like fuel that you have to pay for while going to regular job. Doing that you will not only learn TA but also money management which might be even more important than good entry/exit point from statistic point of view (that's what TA is). Without good money management and self-discipline you can earn from 10 trades and then loss everything from 1 trade. How to train money management and self-discipline: https://bitcointalk.org/index.php?topic=5122226.msg50225995#msg50225995 and this is a golden rule how not to freak out. I'm still working on that:) : I actually find staring at charts all day to be really harmful. It leads to all sorts of anxiety and second guessing, sometimes even terrible emotional behavior like pulling stop losses when unexpected things occur. I like to have firm rules set on my trades (entry, exit, stop loss) so I can walk away knowing that any potential loss will be a small one. Then I check the charts once a day (or twice, tops) and adjust targets and stops as needed. This at least works for trading on the 4-hour, daily, and higher time frames. Intraday trading is just too stressful and demanding. Title: Re: Globb0 BTC charts Post by: Globb0 on May 13, 2020, 08:16:32 AM Thanks for your thoughts and the link.
I will take a look at it. Cheers Title: Re: Globb0 BTC charts Post by: Globb0 on May 13, 2020, 10:14:23 AM Todays daily candles chart seems to confirm the reversal. Closed green and bigger than the red.
https://i.imgur.com/kmtVMwL.jpg The hourly chart is uninteresting today, a slight amble up Title: Re: Globb0 BTC charts Post by: Globb0 on May 14, 2020, 09:31:17 AM So seems another correct call there. Shame I didn't listen to the JFDI advice yet.
https://i.imgur.com/Q0ehJz3.jpg On the hourly, the dip is recovered a nice bowl shape, I am wondering if a handle will form now https://i.imgur.com/6Qw4GD2.jpg Title: Re: Globb0 BTC charts Post by: JayJuanGee on May 14, 2020, 09:36:37 AM So seems another correct call there. Shame I didn't listen to the JFDI advice yet. The best time to start is yesterday. The second best time to start is today. https://images.ctfassets.net/u4vv676b8z52/60zM6XTHxGoqD9Am2KllNr/9c671ede560f911271385a0e19a1299e/why-people-wink-hero-678x4446-compressor.jpg?fm=jpg&q=80 Title: Re: Globb0 BTC charts Post by: buwaytress on May 14, 2020, 01:42:28 PM I slept on it, I think its not even good enough to just have the correct stops (though they are important) I think to maximise things you need to be sat in front of it, reacting and adjusting. That feels far more like gambling, shall I cash out or wait on a bet type thing. Similar, maybe indicating this is just betting of a sort. I always see stops as a pre-requisite to opening the order. Obviously, the shorter the time frame, the tighter the stops, and for intraday trading I wouldn't touch my stops but if I'm doing long term trades (I don't trade but I consider my buying a sort of very long-term trade), then I obviously adjust my stops, almost like a trailing stop with percentage adjustments. Title: Re: Globb0 BTC charts Post by: Globb0 on May 14, 2020, 08:21:03 PM I need someone to teach me moving stops. Because for example I called this up but I don't know how high.
I know I should set a stop that moves with the up then holds position when the dump comes. Yet I have no real idea how to achieve such a thing. Title: Re: Globb0 BTC charts Post by: exstasie on May 15, 2020, 01:31:25 AM I need someone to teach me moving stops. Because for example I called this up but I don't know how high. I know I should set a stop that moves with the up then holds position when the dump comes. Yet I have no real idea how to achieve such a thing. It's called a trailing stop: https://support.bitfinex.com/hc/en-us/articles/115003506545-Trailing-Stop-Order Trailing stop orders are available on more advanced trading interfaces like Bitmex and Bitfinex. You can also manually apply trailing stop methods in a number of ways: https://www.tradingheroes.com/trailing-stop-loss-strategies/ #3, the X-bar trailing exit is very common. Let's say you're long on the 4-hour chart with a 3-bar exit strategy and the trade is moving favorably. Count 3 bars back from the present bar: the low of that bar is your stop loss. Title: Re: Globb0 BTC charts Post by: buwaytress on May 15, 2020, 07:26:39 AM Actually, didn't know Binance doesn't support it (just checked now) -- I'd have thought these platforms were far more advanced these days than the forex ones of 15 years ago!
Anyway, what do you use Globb0 if at all for automated trading? Or is everything manual? It would see bots like HaaS or cryptohopper have these features but even free ones like Signal (https://signalgroups.com/) let you use Trailing stop. P.S. I never tried Trailing Take Profit but it's a thing too... Title: Re: Globb0 BTC charts Post by: Tytanowy Janusz on May 15, 2020, 08:09:15 AM Actually, didn't know Binance doesn't support it (just checked now) They have great API for advanced users. Basic Python skills are enough to make any type of order. And I strongly advice to spend some time on that just for fun to see how useful it can be. I needed 2 days from first time python user to my first trading bot that is earning few $ daily on spread on low volume exchange. Bot is checking orders every few seconds, change my buy/sell orders control balance and has basic GUI to change its parameters if necessary. Even if it will be only a one time adventure this time you spend on improving programming skills is not wasted time. Trust me. You never know when you will need them again. F.e. You very often say - "let's wait for daily candle to close" ... why not set order that will trigger at 00:00:01 if price is higher than support? You code that and then you think hmm... what if there are bunch of such bots and price pump at 00:00:01 because of that? Then you check charts and if it is like that you can buy at 23:59:59 and sell at 00:00:02 and you have your first HFT bot :) Not saying that it is pumping like that but making your own bot opens your mind on how market works - gives you different trading approach. BTW: 1- 1.5 bilion newly printed tethers (+30% supply) We were fighting with 7k resistance back than.Now we are fighting with 10k and another 35% of tethers was printed yesterday and USDT is now nr4 in coinmarketcap fighting with ripple for top3 (1% short). Title: Re: Globb0 BTC charts Post by: Globb0 on May 15, 2020, 09:55:33 AM Let the attack commence!
https://1.bp.blogspot.com/-4HDDkmO5LzQ/W2f5sNm7ZXI/AAAAAAAAPhg/P4w9Y05zJmkDR3ctq1ElMiKQP4YIizQEQCPcBGAYYCw/s1600/tumblr_p8q376I7LN1x6m6njo1_500.gif https://i.imgur.com/vcPh5KH.jpg Hourly chart cup handle pattern? or not? https://i.imgur.com/IZQ8YfJ.jpg Title: Re: Globb0 BTC charts Post by: exstasie on May 15, 2020, 10:11:33 PM Hourly chart cup handle pattern? or not? Yeah, I could see that. Expected retrace on the handle would be the 0.382-0.5 area. If it starts pushing below $9K then we're probably not looking at a cup-and-handle pattern. https://i.imgur.com/UDcQsqh.png Title: Re: Globb0 BTC charts Post by: Globb0 on May 16, 2020, 09:25:16 AM Hourly chart cup handle pattern? or not? Yeah, I could see that. Expected retrace on the handle would be the 0.382-0.5 area. If it starts pushing below $9K then we're probably not looking at a cup-and-handle pattern. https://i.imgur.com/UDcQsqh.png Thanks and your drawing was also far more elegant than mine. Appreciate you taking the time to skill us up here in this thread. *tips hat* Title: Re: Globb0 BTC charts Post by: buwaytress on May 17, 2020, 09:41:38 AM I did NOT expect to see 9500 today.
@Tytanowy: Couldn't agree more with programming, even if I never really updated my own skillz since the early 1990s with BASIC. But I think kids should really learn it, not just for things like this but for any kind of simple automation outside of trading. The only problem with these bots (to me) is that if your coding isn't solid, then you have unexpected consequences you can't foresee if you don't have a good coding brain. I still slip on Excel formula even though been using it for years (and only find out when someone finds my error after they start using it) but I think there are some bots that really allow for quite robust testing and debug of your code these days. Never actually tried them but I think Haas looks like a contender for that. Ever had experience? @Gl0bbo: You ever watch the re-imagined Battlestar? Not ashamed to say it's my favourite sci-fi series. Title: Re: Globb0 BTC charts Post by: Globb0 on May 17, 2020, 02:34:57 PM Best bit when the cylon soldiers boarded the battlestar and started running forward towards the deck. That was intense. If you can guess I also loved it.
All so good and I also loved the original series as a kid. Oh yeah and some pretty hot women eh? :) I have chores to do for the family but Ill get to the charts later. I see we had an up, not sure yet if it was reflex to the handle forming. I thin the 9k invalidator (mentioned above) held. Title: Re: Globb0 BTC charts Post by: Globb0 on May 18, 2020, 10:24:15 AM Daily chart, seems to have retested, 10K feels inevitable. https://i.imgur.com/YHdhgPE.jpg Hourly is boring, some dump but it doesn't look more threatening than more sideways for a bit. Title: Re: Globb0 BTC charts Post by: exstasie on May 19, 2020, 07:24:45 PM Hourly is boring, some dump but it doesn't look more threatening than more sideways for a bit. A dump below the May 15th pivot ($9,120 Coinbase) or a pump above the weekly pivot ($10,079 Coinbase) will get my attention. Those are early warnings that a breakout may be occurring. Anything inside that range is liable to troll. The real breakout levels (defining the weekly and monthly trends) are still $10.5K and $8K. Title: Re: Globb0 BTC charts Post by: Globb0 on May 21, 2020, 04:42:55 PM Interesting price action. Still holding within the range well above the support.
Just touched on my green line, this is fine. https://i.imgur.com/dt7NGg9.jpg I heard it dipped a tiny bit under 9000 https://i.imgur.com/YF23UNB.jpg Hourly is where the action is showing.... Breached the first support level at this zoom https://i.imgur.com/1vjkq3u.jpg Title: Re: Globb0 BTC charts Post by: exstasie on May 21, 2020, 10:29:46 PM After this dip to the 0.618, the hourly cup-and-handle pattern is officially dead:
https://i.imgur.com/yUdkM4v.png Bears are showing their teeth. Triggered a 4-hour BB breakdown. This Adam & Eve double top is a real possibility. (https://bitcointalk.org/index.php?topic=5196072.msg54463058#msg54463058) A break below $8,100 will confirm. Title: Re: Globb0 BTC charts Post by: buwaytress on May 22, 2020, 11:42:13 AM Best bit when the cylon soldiers boarded the battlestar and started running forward towards the deck. That was intense. If you can guess I also loved it. All so good and I also loved the original series as a kid. Oh yeah and some pretty hot women eh? :) Have to admit I never saw the original toasters until after the first season of the reimagined one. It was definitely a bit campy but for its time not at all bad. If you remember in the 1990s there was 'Space: Above and Beyond" which sadly never made it past season 1 (sad like firefly)... But man, so many scenes I remember so well. And hot women? That opening scene set the tone for hotness. Not since Claudia Black did I see a scifi woman I had the hots for (Katee Sackhoff). If btc markets were BG now, we're in the middle of Cylon occupation and watching the web series while waiting for salvation. @ecstasie: think the bulls will bite on Friday or allow teethy bears to chomp down for the weekend? Title: Re: Globb0 BTC charts Post by: Globb0 on May 23, 2020, 02:48:34 PM Daily did another little retest. I still see up potential.
We are still in the range https://i.imgur.com/1MSJTeX.jpg Title: Re: Globb0 BTC charts Post by: exstasie on May 23, 2020, 10:40:33 PM @ecstasie: think the bulls will bite on Friday or allow teethy bears to chomp down for the weekend? Boring sideways it is. This is maximum trolling, barely holding the bullish trend line from the $6,000s and smack in the middle of the 4-hour BBs: https://i.imgur.com/nc3AcZd.png A break of that trend line and new 4 hour lows and I will flip bearish. For now, the higher time frame trends remain bullish, so bulls have the upper hand in terms of price action. At the same time, bears are not shorting (not many shorts to squeeze) and 4-hour OBV divergences suggest strong selling pressure in this range. Truly a nail biter...... Title: Re: Globb0 BTC charts Post by: buwaytress on May 24, 2020, 08:49:01 AM @exstasie: max trolling indeed. Was half tempted late Friday to unload some required sells early but we're in a $200 range in the past 24 hours, so it looks like I didn't have to worry after all.
The next 3 4-hrs actually will dump away bits of those lows too, definitely an Eid nail biter. Title: Re: Globb0 BTC charts Post by: Globb0 on May 27, 2020, 11:41:19 AM Well we have broken through my magic line.
But still well within the range, above support below resistance. RSI turning upward, puuuuuushhshhhhhhh! https://i.imgur.com/XWFQ7lb.jpg Title: Re: Globb0 BTC charts Post by: Globb0 on May 29, 2020, 04:24:02 PM Here's the chart. Good thing the yesterday daily closed back over my magic line.
https://i.imgur.com/Ph7ZEeJ.jpg Lets see how it does today. Next of course its the WEAK end Thank you Title: Re: Globb0 BTC charts Post by: Globb0 on May 31, 2020, 09:35:07 AM Yet again a daily candle closed back above the magic line. It really seems to want to gt back up there.
The 10k dream still feels alive for this line. Though there is obvious resistance coming. A coiling snake may strike https://i.imgur.com/XQ4LCPK.jpg Hourly looks boring but there is an interesting gradual steps upward pattern. Stairway to heaven? or stand by for the manipulator dump again? 10k must be a "take the money" level for some people who are deciding things ages ago to not be emotional about it. Their coins will eventually get hoovered up. Baby climbing stairs https://i.imgur.com/C5iZlTQ.jpg Title: Re: Globb0 BTC charts Post by: Globb0 on June 02, 2020, 08:34:20 AM Yay I was right, and we closed above the resistance.
Snake strikes at flagpole https://i.imgur.com/xfWeFmg.jpg If that flagpole pattern happens it could be going to nearly 11k Will people have their phycological cash outs ready though? or have they been cleared out Here the hourly, and the flag pattern. But heed the suspicious volume spike Looks like resistance became support for now https://i.imgur.com/wFsfUUF.jpg Title: Re: Globb0 BTC charts Post by: casperBGD on June 02, 2020, 02:13:34 PM Here the hourly, and the flag pattern. But heed the suspicious volume spike indeed, volume spike could be trigger to price rise, because of low selling pressure, but similar action triggered bullish market last year, seems that people do not want to sell on these levels, and that should influence price to go up, we will see in near future Title: Re: Globb0 BTC charts Post by: Globb0 on June 08, 2020, 04:01:24 PM Well I drew everything nice and fresh. And nothing much to see here for the last few dailly's. https://i.imgur.com/vmLmxY6.jpg Title: Re: Globb0 BTC charts Post by: Globb0 on June 12, 2020, 02:25:30 PM We can say goodbye to my nice fun up to 10k trendline. Awesome thanks for the taste of over 10k on the daily close.
https://i.imgur.com/b19YTHH.jpg Now we are stuck in our boring channel. Lets hope not too much cold feet happens. Title: Re: Globb0 BTC charts Post by: JayJuanGee on June 12, 2020, 04:26:33 PM We can say goodbye to my nice fun up to 10k trendline. Awesome thanks for the taste of over 10k on the daily close. https://i.imgur.com/b19YTHH.jpg Now we are stuck in our boring channel. Lets hope not too much cold feet happens. I did not realize that you were such a party poop, Globb0? I thought that you were more funzies than that. :'( :'( Letting squiggly lines and bars on graphs ruinin dee moo? >:( >:( >:( Personally, I think that we are too close to $10k to be even close to be giving up on it. We know how these break throughs go... sometimes they may take several efforts before they break... so I am not giving up, yet. Hey we are not even out of the "Don't get too excited range" that i had mentioned a month or more ago... which I think likely continues to apply... and that is the $7,800 to $10,200 range... In essence, we have largely been hovering within the top of that range without any kind of meaningful break through... except maybe a temporary break up to $10,400-ish.. but other than that largely staying in the $9ks, and personally, I am not getting the feeling of any kind of meaningful need to move my "don't get too excited range of $7,800 to $10,200.. unless maybe I move that bottom number up a little to $8,300 or so? but maybe i could move the top number up to $10,500, too, in order to synchronize with a common number that I have heard other peeps throwing around, and I don't mind a little bit of coordinating or synchronizing, if it makes some senses in the whole scheme of things. Other than that why get excited? Merely because our cork popping festivities might have gotten a little wee bit delayed, but we should be used to experiencing some delayed cork-poppenings, especially in bitcoinlandia. :P :P Title: Re: Globb0 BTC charts Post by: exstasie on June 12, 2020, 07:53:04 PM I did not realize that you were such a party poop, Globb0? I thought that you were more funzies than that. :'( :'( Letting squiggly lines and bars on graphs ruinin dee moo? >:( >:( >:( Personally, I think that we are too close to $10k to be even close to be giving up on it. I'm not giving up on $10K until the range is officially broken. Structural low at $8,630. Break that down and we should get a sustained daily BB breakout, drop below the weekly BB basis, etc. for confirmation of a downtrend. However given the bearish engulfing candle on the daily, the correlated drop with stocks, and this surge in stock index volatility, my 60/40 bullish bias is back down to 50/50 at best: https://bitcointalk.org/index.php?topic=5196072.msg54608759#msg54608759 https://bitcointalk.org/index.php?topic=671764.msg54608815#msg54608815 Title: Re: Globb0 BTC charts Post by: Globb0 on June 12, 2020, 09:01:45 PM Exactly I pooped nothing. But I did notice we are stuck in a range we have all discussed is irrelevant.
Waiting to see where we go. Title: Re: Globb0 BTC charts Post by: cryptomaniac_xxx on June 15, 2020, 01:05:35 PM Exactly I pooped nothing. But I did notice we are stuck in a range we have all discussed is irrelevant. Waiting to see where we go. It looks like the questions have been answered today, the market have shifted to a short term bearish trend. We have lost the momentum and obviously rejected another run to $10k. I'm looking at $8600-$800, why? this price seems to align to our weekly support line and the 200 day MA. Title: Re: Globb0 BTC charts Post by: LFC_Bitcoin on June 15, 2020, 01:25:10 PM Exactly I pooped nothing. But I did notice we are stuck in a range we have all discussed is irrelevant. Waiting to see where we go. Frustrating atm my friend, feels like weve been trading in this range for ages. I really expected us to be clear of $10,000 by now if Im honest. Im really hoping/expecting us to be over $13,000 by New Year but who knows whats going to happen due to the economic fall out from this virus. I dont know where were headed in the short term but I still think its very likely to leave 2020 at $13,000 or more. The full effects of the halving arent showing yet, we should know more by the end of August perhaps. Title: Re: Globb0 BTC charts Post by: Globb0 on June 15, 2020, 01:27:03 PM Well see what I mean, we went nowhere really, we are stuck in the dead range
https://i.imgur.com/U8830Ab.jpg Grind out a floor and lets build from there Title: Re: Globb0 BTC charts Post by: buwaytress on June 16, 2020, 08:37:57 AM Was ready to say, ah finally, we're going somewhere, when the 9k floor broke but seems like yet again, neither side of the market wanted to put a strong foot forward, so the dip-buying brings us right back to this deadzone you're talking about.
What do the salty sailors do when stuck in the doldrums? Ration out the food and spyglass on the horizons for them seagulls. Title: Re: Globb0 BTC charts Post by: Globb0 on June 16, 2020, 08:45:27 AM Quote Down dropt the breeze, the sails dropt down, 'Twas sad as sad could be; And we did speak only to break The silence of the sea! All in a hot and copper sky, The bloody Sun, at noon, Right up above the mast did stand, No bigger than the Moon. Day after day, day after day, We stuck, nor breath nor motion; As idle as a painted ship Upon a painted ocean. Water, water, every where, And all the boards did shrink; Water, water, every where, Nor any drop to drink. Title: Re: Globb0 BTC charts Post by: exstasie on June 16, 2020, 09:31:26 AM Was ready to say, ah finally, we're going somewhere, when the 9k floor broke but seems like yet again, neither side of the market wanted to put a strong foot forward, so the dip-buying brings us right back to this deadzone you're talking about. Yep, endless ranging. $8,600 is still the line in the sand in my eyes. Breaking below that will be a structural lower low on the weekly and monthly time frames. Lots of stops are waiting to be run below there. We're coiling for a huge breakout, whichever direction it is. The daily bands are as tight as October 2019 or January 2020. It's time to pay attention, as John Bollinger (of Bollinger Bands fame) likes to say. Title: Re: Globb0 BTC charts Post by: Globb0 on June 17, 2020, 08:29:14 AM Title: Re: Globb0 BTC charts Post by: Wind_FURY on June 17, 2020, 09:17:54 AM On February, an ebbing stream. Right now, a coiling snake. It's "safer" to buy the small dips, than miss and regret an opportunity. Safer for your mental health. 8)
Title: Re: Globb0 BTC charts Post by: LFC_Bitcoin on June 17, 2020, 10:50:42 AM Yep, endless ranging. $8,600 is still the line in the sand in my eyes. Breaking below that will be a structural lower low on the weekly and monthly time frames. Lots of stops are waiting to be run below there. We're coiling for a huge breakout, whichever direction it is. The daily bands are as tight as October 2019 or January 2020. It's time to pay attention, as John Bollinger (of Bollinger Bands fame) likes to say. Hopefully upwards, youd expect the halving to positively affect the price at some point. I still think well be at $12,000 by the end of August. My bags are full & Im ready to finally see some damn action. Title: Re: Globb0 BTC charts Post by: exstasie on June 17, 2020, 10:52:12 PM We're coiling for a huge breakout, whichever direction it is. The daily bands are as tight as October 2019 or January 2020. It's time to pay attention, as John Bollinger (of Bollinger Bands fame) likes to say. Hopefully upwards, youd expect the halving to positively affect the price at some point. I still think well be at $12,000 by the end of August. My bags are full & Im ready to finally see some damn action. I'm still rather neutral. After so much trolling in both directions, I will let the breakout tell the story. I haven't given up on this triangle idea yet: I'm more focused on resolution of the larger 2018-2020 triangle: https://i.imgur.com/Bi2SYvO.png If bears win the short term battle and break the weekly uptrend (below $8,600 or ideally $8,100) that's a likely confirmation that Wave D is complete. Title: Re: Globb0 BTC charts Post by: Globb0 on June 19, 2020, 02:29:03 PM Title: Re: Globb0 BTC charts Post by: Globb0 on June 22, 2020, 11:39:12 AM Title: Re: Globb0 BTC charts Post by: Globb0 on June 23, 2020, 12:26:37 PM Bands squeezing in and we moved to the top half with a lovely strong candle yesterday.
Things look good for a leg up? https://i.imgur.com/sMCCsNU.jpg Title: Re: Globb0 BTC charts Post by: dragonvslinux on June 23, 2020, 04:28:50 PM Bands squeezing in and we moved to the top half with a lovely strong candle yesterday. Things look good for a leg up? Yup, I'd expect ascending triangle resistance to be tested around $10K, maybe even the bull channel resistance of $10.5K if we're lucky. Not convinced we're ready to break through to new yearly highs quite yet though, but could be wrong. Above yesterdays high of $9.8K signals a long-trade on the Daily chart based on TD Sequential, if entries weren't taken on smaller time-frames from $9.6K, but for me the risk/reward isn't quite there yet, mainly because it'd be buying too close to the $10K resistance, it'd be around a 1:1 ratio (way too risky) with a tight stop loss. The time to buy was clearly around $9K from ascending triangle support (https://bitcointalk.org/index.php?topic=5255102.0) - in hindsight. Patience is a virtue. Title: Re: Globb0 BTC charts Post by: Globb0 on June 26, 2020, 09:40:31 AM Moar sideways later...
.
Now we are not looking so good, yes still in the boring duldrums of sideways, but looking weaker bands are pinching but yet RSI is in the gutter, where is the up going to come from? We are stuck in the bottom half of the band. Not much signs of green. https://i.imgur.com/Nn9CaP0.jpg Title: Re: Globb0 BTC charts Post by: Tytanowy Janusz on June 26, 2020, 11:53:43 AM Yay I was right, and we closed above the resistance. We can say goodbye to my nice fun up to 10k trendline. Awesome thanks for the taste of over 10k on the daily close. Well see what I mean, we went nowhere really, we are stuck in the dead range Things look good for a leg up? Now we are not looking so good Trader with 30 year experience once told me - If you want to trade technical check if asset is moving in a technical way currently. Sometimes emotions on market are that big (or few big players are fighting) than all we can do is just sit and watch. Asset is moving randomly/emotional instead of technical. That's how i see current BTC short term movements. Just take a look at this. https://i.imgur.com/MofAWX7.png 10 000 is the strongest resistance we've seen in last few years. Possible dump (profit for shorters) -40%. Possible instant pump +50%. Emotions are on the edge of explosion. I don't think that it is possible to see anything on 1h, 4h, 1D candles. Take position and set stoploss or wait for end of this price battle and than take position. Thats all we can do now IMO. After that create trend lines, support, resistances etc. and trade based on it. Title: Re: Globb0 BTC charts Post by: Globb0 on July 05, 2020, 09:24:37 AM The year so far in bitcoin
https://i.imgur.com/UW6mHv6.jpg Still stuck in the range, at zoom in levels it even looks more negative. Title: Re: Globb0 BTC charts Post by: Globb0 on July 10, 2020, 12:19:42 PM Not much movement, but the halvening is slipping away in time terms and it was always a few months before the resulting move
I continue to be concerned with the volume, is it me or is it declining? https://i.imgur.com/osKLWJe.jpg Title: Re: Globb0 BTC charts Post by: Tytanowy Janusz on July 10, 2020, 04:12:27 PM I continue to be concerned with the volume, is it me or is it declining? https://i.imgur.com/lVA5fq1.png Yep, it looks like its declining. But I think that we are spoiled with volumes from 9000 - 3500 - 9000. Volumes that was caused by extreme volatility and emotions. I can't imagine an asset that is stuck for 2 months in narrow range and does not loose volume. It seems impossible to me. The longer we see the same price the more people that are satisfied with it are done with their transactions no matter what the final direction is especially now when we can bet in both directions (short, long). Title: Re: Globb0 BTC charts Post by: Febo on July 10, 2020, 05:10:05 PM I continue to be concerned with the volume, is it me or is it declining? Traders are going on vacations. Late summers are always slow. If something dramatic happens they will fast return, if not we might have 2 more slow months. Title: Re: Globb0 BTC charts Post by: exstasie on July 10, 2020, 08:07:29 PM I continue to be concerned with the volume, is it me or is it declining? Definitely declining. I don't find it particularly concerning. Actually it's rather expected in a tight range like this. This is the calm before the storm. I expect volume to surge when a breakout finally occurs. That will help to confirm the new trend direction too. Title: Re: Globb0 BTC charts Post by: Globb0 on July 10, 2020, 08:13:06 PM Thanks for all the replies.
Yes for sure I have mixed feelings. Yes up can happen any minute, FOMO being the best weapon there. But it really feels weak, there is not such an bitcoin buzz right now. At the same time we are over 9k who can complain. Once it was nice to be over 1k. Title: Re: Globb0 BTC charts Post by: JayJuanGee on July 10, 2020, 10:08:43 PM Thanks for all the replies. Yes for sure I have mixed feelings. Yes up can happen any minute, FOMO being the best weapon there. But it really feels weak, there is not such an bitcoin buzz right now. At the same time we are over 9k who can complain. Once it was nice to be over 1k. Sure. Feels like a kind of Lindy Effect (https://en.wikipedia.org/wiki/Lindy_effect) that seems to be developing in this area, and $9k could feel kind of boring and blahze as you suggest, Globb0, and probably part of the reason that we are not feeling very excited about $9k remains that we have been here a lot of times in the past 3 years, and almost as if $9k could transition into a floor or even a sub-floor, even though there are far from any guarantees of even that. Probably the folks who have been investing into bitcoin for 4 years or more (let's say dollar cost averaging) are feeling a decent amount of comfortableness, even with $9k, and even the dollar cost averagers of 2 to 3 years are likely to be in decent profits as long as they largely kept a DCA accumulating system that did not devolve into too many playing around habits. We could look at DCA charts and play with the timeline (such as 4 years) (https://dcabtc.com?sd=2016-07-10&sda=4_years&f=weekly&d=4_years&ac=10000&c=true)to see how various time periods of DCAing would have worked out, and it appears that the longer DCA'ing the higher the percentage of profits and the more that BTC differentiates itself from DCAing into other assets, such as gold and equities or even just holding dollars. Of course, front load investing (or even buying on the dip) could have been potentially helpful too, even though it may have cost extra if buying too much BTC in higher price ranges, such as supra $10k.. and running out of fiat to buy on the larger dips, such as dips into the $3ks and $4ks. So you would have NOT gone wrong with practices that largely played out as a kind of dollar cost averaging, but there may be some decent number of folks who have been playing around with their BTC investment trying to magnify or leverage their BTC investments and maybe not always playing the price swings correctly and maybe are not as much into profits as the strict DCA-ers, so they could be a bit more anxious for orange coin number go up. Title: Re: Globb0 BTC charts Post by: Wind_FURY on July 15, 2020, 05:18:12 AM Longer expected time of waiting, or not, I personally wouldn't want my next bull market experience to end like this,
https://pbs.twimg.com/media/EcwEFNjXgAI_5gh?format=png&name=medium I believe it's an opportunity to buy NOW. Title: Re: Globb0 BTC charts Post by: dragonvslinux on July 15, 2020, 06:59:31 AM Longer expected time of waiting, or not, I personally wouldn't want my next bull market experience to end like this, https://pbs.twimg.com/media/EcwEFNjXgAI_5gh?format=png&name=medium I believe it's an opportunity to buy NOW. I think buying now in the 9K-10K range is merely for those who didn't position themselves appropriately over the past year. I know I sold trading positions around $8.8K roughly on the run up prior to $10K, based on the likelihood of a pull-back below $8K at the time (that now looks less likely, but still more than possible), but making a decent trade isn't something I regret. Knowing that if price does break down than the level I sold certain positions at is pretty much where I'd want to selling anyway, so merely takes this thought process out the equation. If you're dollar cost averaging than the 9-10K range is probably gold dust for you (whereas I prefer to DCA dips than rallies personally), but this mentally of chasing price later on is unhealthy, it merely means you failed to buy enough at $6-7K range where there was plenty of time and opportunity to do so. Unless you're averaging in at higher levels that is, I therefore won't assume your positioning. It's merely this thinking is what will lead people to push prices upto $14K and even beyond if Bitcoin moves above $10K, overlooking the reality that we probably still have 6-12 months of consolidation below 20K to go (based on 2016 extrapolation), that'd likely re-test $10-12K levels anyway in a healthy sustainable manner. The reality is that so far, most of the past 2 years has been the time to buy, with the exception of $10K+ levels. Not surprising either, most people like 50% discounts in life. As a trader, you're waiting for $8.6K support levels to be broken to short, or $10K ish levels to go long. Everything in-between is just chop, noise and speculation. TL:DR: Liked the meme, but don't think it's unhealthy to think in this way. You're also welcome to think how you please :) Title: Re: Globb0 BTC charts Post by: Wind_FURY on July 15, 2020, 08:06:10 AM Longer expected time of waiting, or not, I personally wouldn't want my next bull market experience to end like this, https://pbs.twimg.com/media/EcwEFNjXgAI_5gh?format=png&name=medium I believe it's an opportunity to buy NOW. I think buying now in the 9K-10K range is merely for those who didn't position themselves appropriately over the past year. I know I sold trading positions around $8.8K roughly on the run up prior to $10K, based on the likelihood of a pull-back below $8K at the time (that now looks less likely, but still more than possible), but making a decent trade isn't something I regret. Knowing that if price does break down than the level I sold certain positions at is pretty much where I'd want to selling anyway, so merely takes this thought process out the equation. But are you happy hodling that fiat now? Don't be the girl in the third panel. Quote If you're dollar cost averaging than the 9-10K range is probably gold dust for you (whereas I prefer to DCA dips than rallies personally), but this mentally of chasing price later on is unhealthy, it merely means you failed to buy enough at $6-7K range where there was plenty of time and opportunity to do so. Unless you're averaging in at higher levels that is, I therefore won't assume your positioning. It's merely this thinking is what will lead people to push prices upto $14K and even beyond if Bitcoin moves above $10K, overlooking the reality that we probably still have 6-12 months of consolidation below 20K to go (based on 2016 extrapolation), that'd likely re-test $10-12K levels anyway in a healthy sustainable manner. The reality is that so far, most of the past 2 years has been the time to buy, with the exception of $10K+ levels. Not surprising either, most people like 50% discounts in life. As a trader, you're waiting for $8.6K support levels to be broken to short, or $10K ish levels to go long. Everything in-between is just chop, noise and speculation. TL:DR: Liked the meme, but don't think it's unhealthy to think in this way. You're also welcome to think how you please :) I believe each one of us will NOT be thinking about what buying strategy was the best, once we're HODLING 6-digit Bitcoins years from now. 8) Title: Re: Globb0 BTC charts Post by: dragonvslinux on July 15, 2020, 09:43:06 AM Longer expected time of waiting, or not, I personally wouldn't want my next bull market experience to end like this, https://pbs.twimg.com/media/EcwEFNjXgAI_5gh?format=png&name=medium I believe it's an opportunity to buy NOW. I think buying now in the 9K-10K range is merely for those who didn't position themselves appropriately over the past year. I know I sold trading positions around $8.8K roughly on the run up prior to $10K, based on the likelihood of a pull-back below $8K at the time (that now looks less likely, but still more than possible), but making a decent trade isn't something I regret. Knowing that if price does break down than the level I sold certain positions at is pretty much where I'd want to selling anyway, so merely takes this thought process out the equation. But are you happy hodling that fiat now? Don't be the girl in the third panel. Yeh 10-20% I'm always happy to hodl, I'm not willing to risk much more than that right now though. Hence if that percentage increased to 15-25% then I'd be reducing my risk. I believe each one of us will NOT be thinking about what buying strategy was the best, once we're HODLING 6-digit Bitcoins years from now. 8) I think that's the first thing I'll be considering to be honest, whether buying dips or dollar cost averaging was better. Will give me a better idea of whether I should be dollar cost selling at a 6-figure Bitcoin or selling the rally :P Title: Re: Globb0 BTC charts Post by: exstasie on July 15, 2020, 09:57:58 AM Longer expected time of waiting, or not, I personally wouldn't want my next bull market experience to end like this, https://pbs.twimg.com/media/EcwEFNjXgAI_5gh?format=png&name=medium That's how it feels in the run-up to a bubble. I don't feel that kind of urgency at the moment. Here's how I look at this situation. A breakdown below $8.6K could easily reach the $6K area. That's a 35% gain from here; 35% more BTC for someone waiting to buy the dip. On the other hand, an upwards breakout will occur above $10.5K. That's 14% above the current price. I don't blame anyone for sitting on the fence. Title: Re: Globb0 BTC charts Post by: JayJuanGee on July 16, 2020, 12:38:06 AM Longer expected time of waiting, or not, I personally wouldn't want my next bull market experience to end like this, https://pbs.twimg.com/media/EcwEFNjXgAI_5gh?format=png&name=medium I believe it's an opportunity to buy NOW. I think buying now in the 9K-10K range is merely for those who didn't position themselves appropriately over the past year. I know I sold trading positions around $8.8K roughly on the run up prior to $10K, based on the likelihood of a pull-back below $8K at the time (that now looks less likely, but still more than possible), but making a decent trade isn't something I regret. Knowing that if price does break down than the level I sold certain positions at is pretty much where I'd want to selling anyway, so merely takes this thought process out the equation. But are you happy hodling that fiat now? Don't be the girl in the third panel. Yeh 10-20% I'm always happy to hodl, I'm not willing to risk much more than that right now though. Hence if that percentage increased to 15-25% then I'd be reducing my risk. I believe each one of us will NOT be thinking about what buying strategy was the best, once we're HODLING 6-digit Bitcoins years from now. 8) I think that's the first thing I'll be considering to be honest, whether buying dips or dollar cost averaging was better. Will give me a better idea of whether I should be dollar cost selling at a 6-figure Bitcoin or selling the rally :P One of the main points of DCA is that the person engaged in such practice does not think about the price and likely should not go through some kind of nonsense second guessing whether it would have been better to wait for dips, blah blah blah. Sure, if you want to wait for dips, that is your preference, but just seems to be bullshit to try to compete with either someone else or your other self over a practice that overall has different considerations... including that DCA is way advantaged in terms of figuring out a budget that accounts for an accumulators ongiong cashflow, so if an accumulator has $12,k extra that is coming in over the next year, but may only be able to authorize half of that for buying bitcoin. Therefore, s/he may only be able to authorize $500 per month or $125 per week. It would not be so smart for such a person, who might already be trying to stay within a reasonable balance with finances, to Front load the whole $6k at various points of time that may or may not work out, including s/he might not even have such $6k in his/her pocket because it is based on cash coming in, not cash that has already come in and is just sitting there waiting and gathering dust. Title: Re: Globb0 BTC charts Post by: Wind_FURY on July 16, 2020, 07:36:12 AM Longer expected time of waiting, or not, I personally wouldn't want my next bull market experience to end like this, https://pbs.twimg.com/media/EcwEFNjXgAI_5gh?format=png&name=medium That's how it feels in the run-up to a bubble. I don't feel that kind of urgency at the moment. The one waiting with no feel of that kind of urgency might also be the girl in the left-most panel. Quote Here's how I look at this situation. A breakdown below $8.6K could easily reach the $6K area. That's a 35% gain from here; 35% more BTC for someone waiting to buy the dip. On the other hand, an upwards breakout will occur above $10.5K. That's 14% above the current price. I don't blame anyone for sitting on the fence. That might also be what the girl in the right-most panel thought, then joined the FOMO crowd. Title: Re: Globb0 BTC charts Post by: exstasie on July 16, 2020, 09:14:28 PM Longer expected time of waiting, or not, I personally wouldn't want my next bull market experience to end like this, https://pbs.twimg.com/media/EcwEFNjXgAI_5gh?format=png&name=medium That's how it feels in the run-up to a bubble. I don't feel that kind of urgency at the moment. The one waiting with no feel of that kind of urgency might also be the girl in the left-most panel. I've been through 2 bubbles so I know what it looks like. Price has remained stuck in a ~$2,000 range for the last 2 months, so.......no. Anyone who perceives urgency to buy right now is a perma-bull who doesn't have a realistic sense of (or care for) whether price could fall. They are not interested in taking a calculated risk at accumulating more BTC. Remember, price already nearly tripled from the lows a few months ago. Yet the long term (2017-present or 2019-present) bear trends are still intact. The way I see it, being a long term bull and waiting to accumulate lower than here seems reasonable. Are those lower prices guaranteed? No, this is a calculated risk. Title: Re: Globb0 BTC charts Post by: Wind_FURY on July 17, 2020, 06:19:23 AM Longer expected time of waiting, or not, I personally wouldn't want my next bull market experience to end like this, https://pbs.twimg.com/media/EcwEFNjXgAI_5gh?format=png&name=medium That's how it feels in the run-up to a bubble. I don't feel that kind of urgency at the moment. The one waiting with no feel of that kind of urgency might also be the girl in the left-most panel. I've been through 2 bubbles so I know what it looks like. Price has remained stuck in a ~$2,000 range for the last 2 months, so.......no. Anyone who perceives urgency to buy right now is a perma-bull who doesn't have a realistic sense of (or care for) whether price could fall. But anyone who waits today might miss a golden opportunity of buying Bitcoin priced less than $10,000 because it might never fall anymore. Quote They are not interested in taking a calculated risk at accumulating more BTC. It's calculated. Buy the dips, and HODL. Dollar-cost-averaging. Title: Re: Globb0 BTC charts Post by: Tytanowy Janusz on July 17, 2020, 06:56:55 AM But anyone who waits today might miss a golden opportunity of buying Bitcoin priced less than $10,000 because it might never fall anymore. Experienced investor knows that it is not about catching every train no matter how fast is it going and what are the risks. Experienced investor knows that the most important thing is not to lose. Experienced investor knows that there will always be another train, another opportunity Experienced investor knows that it is not important when you bought. Below 10 000 or above. It is important to minimalize risks. Buying close to 2.5 year resistant (trend line) is risky. https://i.imgur.com/S8QFlUu.png Title: Re: Globb0 BTC charts Post by: Wind_FURY on July 17, 2020, 08:07:38 AM But anyone who waits today might miss a golden opportunity of buying Bitcoin priced less than $10,000 because it might never fall anymore. Experienced investor knows that it is not about catching every train no matter how fast is it going and what are the risks. Experienced investor knows that the most important thing is not to lose. Experienced investor knows that there will always be another train, another opportunity Experienced investor knows that it is not important when you bought. Below 10 000 or above. It is important to minimalize risks. Buying close to 2.5 year resistant (trend line) is risky. https://i.imgur.com/S8QFlUu.png In my opinion, breaking that line would take Bitcoin on its path to a new ATH. Plus for context, let me post this again, https://pbs.twimg.com/media/EcwEFNjXgAI_5gh?format=png&name=medium Experienced investor also knows that he/she does NOT want to be the girl in that picture. 8) Title: Re: Globb0 BTC charts Post by: Globb0 on July 17, 2020, 08:14:14 AM She could be the trailing stop. Keeping up just behind ready for the pullback from the kid. Closed! Profit!
I didn't do a chart for a while, don't want to spam boring sideways. Here is a refresh, with the support and resistances from the last few weeks. Its looking kind of crowded https://i.imgur.com/TRqiMys.jpg I wouldn't mind if things were a bit more positive. Title: Re: Globb0 BTC charts Post by: Tytanowy Janusz on July 17, 2020, 08:17:13 AM In my opinion, breaking that line would take Bitcoin on its path to a new ATH. Agree, but based on statistics it will pump, then dump to ~11k, than pump again. So even after breakthrough pump there will be buying opportunity close to current price. It is not about to earn every single $ from every price change. It is better to earn 10% during 30% pump with low risk rather than earn 20% from 30% pump with huge risk. Experienced investor also knows that he/she does NOT want to be the girl in that picture. 8) Experienced investor is never there. If you miss buy opportunity you are close to short opportunity. There will always be next train. Optimize risk and never let your emotions affect your trading. Title: Re: Globb0 BTC charts Post by: exstasie on July 17, 2020, 09:31:28 AM I've been through 2 bubbles so I know what it looks like. Price has remained stuck in a ~$2,000 range for the last 2 months, so.......no. Anyone who perceives urgency to buy right now is a perma-bull who doesn't have a realistic sense of (or care for) whether price could fall. But anyone who waits today might miss a golden opportunity of buying Bitcoin priced less than $10,000 because it might never fall anymore. The flip side of that: anyone buying today might miss a golden opportunity to buy BTC in the $6,000s because it might fall again. The unpredictability of markets cuts both ways. This still applies: A breakdown below $8.6K could easily reach the $6K area. That's a 35% gain from here; 35% more BTC for someone waiting to buy the dip. On the other hand, an upwards breakout will occur above $10.5K. That's 14% above the current price. Are you willing to risk losing 15% of your coins for a chance to gain 35%? If the answer is no, then holding makes sense. Those who are more concerned about preserving fiat capital would probably feel the opposite. Title: Re: Globb0 BTC charts Post by: Wind_FURY on July 18, 2020, 08:18:47 AM In my opinion, breaking that line would take Bitcoin on its path to a new ATH. Agree, but based on statistics it will pump, then dump to ~11k, than pump again. So even after breakthrough pump there will be buying opportunity close to current price. It is not about to earn every single $ from every price change. It is better to earn 10% during 30% pump with low risk rather than earn 20% from 30% pump with huge risk. Experienced investor also knows that he/she does NOT want to be the girl in that picture. 8) Experienced investor is never there. If you miss buy opportunity you are close to short opportunity. There will always be next train. Optimize risk and never let your emotions affect your trading. OK, he/she will never be like the girl in the picture. Then what do you believe, is the "experienced trader, who is never there", on a short opportunity, or a long opportunity? 8) Title: Re: Globb0 BTC charts Post by: Tytanowy Janusz on July 18, 2020, 08:38:59 AM OK, he/she will never be like the girl in the picture. Then what do you believe, is the "experienced trader, who is never there", on a short opportunity, or a long opportunity? 8) I'm saing that experienced trader is never chasing a speeding train. He is on the train already or is waiting for next one. It doesn't matter which direction is it going. Title: Re: Globb0 BTC charts Post by: Wind_FURY on July 18, 2020, 10:33:07 AM OK, he/she will never be like the girl in the picture. Then what do you believe, is the "experienced trader, who is never there", on a short opportunity, or a long opportunity? 8) I'm saing that experienced trader is never chasing a speeding train. I never said that you were wrong, and I believe you. Quote He is on the train already or is waiting for next one. It doesn't matter which direction is it going. OK, then on what train are the experienced traders currently riding? The short train, or the long train? Title: Re: Globb0 BTC charts Post by: exstasie on July 19, 2020, 10:31:28 PM OK, then on what train are the experienced traders currently riding? The short train, or the long train? There are many different ways to trade. Some traders are accumulating shorts in this range with plans to flip long above certain levels like $9,500 or $10.5K. Others are accumulating longs with plans to flip short below $8,600 or $8,100. Both are acceptable from a risk vs. reward perspective. Most experienced traders I know are either on the sidelines waiting for a substantive breakout, or keeping their positions small while trading the range. I'm on the fence myself, not trading much at all. I'm holding both fiat and coins and I have no margin positions. Title: Re: Globb0 BTC charts Post by: Wind_FURY on July 20, 2020, 07:51:49 AM OK, then on what train are the experienced traders currently riding? The short train, or the long train? There are many different ways to trade. Some traders are accumulating shorts in this range with plans to flip long above certain levels like $9,500 or $10.5K. Others are accumulating longs with plans to flip short below $8,600 or $8,100. Both are acceptable from a risk vs. reward perspective. I believe that's trading like the girl in the third panel, which makes my standpoint. Quote Most experienced traders I know are either on the sidelines waiting for a substantive breakout, or keeping their positions small while trading the range. I'm on the fence myself, not trading much at all. I'm holding both fiat and coins and I have no margin positions. That's also like the girl in the third panel. Do we buy now and buy the dip if Bitcoin crashes, or wait? Title: Re: Globb0 BTC charts Post by: Globb0 on July 20, 2020, 08:30:05 AM Meanwhile the chart isn't exactly on fire. Maybe the girl is sitting down for a rest.
https://i.imgur.com/TAUQsAm.jpg Title: Re: Globb0 BTC charts Post by: btc78 on July 20, 2020, 08:30:47 AM She could be the trailing stop. Keeping up just behind ready for the pullback from the kid. Closed! Profit! Resistance seems to be staying strong for the past almost 1 month now,so i believe that we will be having this boring market for another weeks or month.I didn't do a chart for a while, don't want to spam boring sideways. Here is a refresh, with the support and resistances from the last few weeks. Its looking kind of crowded https://i.imgur.com/TRqiMys.jpg I wouldn't mind if things were a bit more positive. we will be in waiting game again now,to find if our holding is worth enough or need to be transferred to another sets of currencies. OK, he/she will never be like the girl in the picture. Then what do you believe, is the "experienced trader, who is never there", on a short opportunity, or a long opportunity? 8) I'm saing that experienced trader is never chasing a speeding train. He is on the train already or is waiting for next one. It doesn't matter which direction is it going. Title: Re: Globb0 BTC charts Post by: exstasie on July 20, 2020, 09:20:51 AM There are many different ways to trade. Some traders are accumulating shorts in this range with plans to flip long above certain levels like $9,500 or $10.5K. Others are accumulating longs with plans to flip short below $8,600 or $8,100. Both are acceptable from a risk vs. reward perspective. I believe that's trading like the girl in the third panel, which makes my standpoint. Not really, since the market isn't going up. That's the bottom line here actually: the meme doesn't apply at all since the market is ranging. The price isn't running away from anyone. If the market does break upwards, traders who flip long aren't waiting for a dip, so price isn't running away from them. The same goes for traders who accumulated longs in this range. This is why the smart way to approach this trading range is with stop buys above the range and stop sells below it. That means immediately reacting to a breakout, rather than waiting and hoping price comes to you, which is what's happening in the second and third panel of that cartoon. Title: Re: Globb0 BTC charts Post by: Wind_FURY on July 20, 2020, 11:50:34 AM There are many different ways to trade. Some traders are accumulating shorts in this range with plans to flip long above certain levels like $9,500 or $10.5K. Others are accumulating longs with plans to flip short below $8,600 or $8,100. Both are acceptable from a risk vs. reward perspective. I believe that's trading like the girl in the third panel, which makes my standpoint. Not really, since the market isn't going up. That's the bottom line here actually: the meme doesn't apply at all since the market is ranging. The price isn't running away from anyone. If the market does break upwards, traders who flip long aren't waiting for a dip, so price isn't running away from them. The same goes for traders who accumulated longs in this range. This is why the smart way to approach this trading range is with stop buys above the range and stop sells below it. That means immediately reacting to a breakout, rather than waiting and hoping price comes to you, which is what's happening in the second and third panel of that cartoon. I believe "not yet", if he/she is treating the market like she's the girl in the first panel, which will eventually become the second the girl in the panel, then the third. Title: Re: Globb0 BTC charts Post by: JayJuanGee on July 20, 2020, 02:29:43 PM Most experienced traders I know are either on the sidelines waiting for a substantive breakout, or keeping their positions small while trading the range. I'm on the fence myself, not trading much at all. I'm holding both fiat and coins and I have no margin positions. That's also like the girl in the third panel. Do we buy now and buy the dip if Bitcoin crashes, or wait? I don't see why any kind of investment in bitcoin needs to be BIG or go home. If anyone has already been in bitcoin for a while, then they have already largely established their position, but if they are new to bitcoin then they are in the process of establishing their position, which surely newbies do not tend to get excited about getting into bitcoin during consolidation periods, and might even get a bit bored with consolidation. If anyone has already established their position, but they still have a cashflow in fiat, then likely in times like this, some of that incoming cashflow can be used to buy BTC right away, some can be plugged into a buying on the dip set up, and another portion of that cashflow can be put in a pot to be used for larger BTC price dips, if such larger dips were to occur. So, the way of dividing up the sum of money that is available would not be too much different whether you have already acquired a decent BTC position as compared to someone who is accumulating into a BTC position, except maybe someone who is accumulated might become a bit more concerned about front-loading the investment strategy, somewhat, so they would less likely end up being like that girl in the picture. Front-loading does run the opportunity cost risks of missing out on a possible major BTC price drop, but I have always considered that kind of risk to be less problematic than feeling like the girl, if the BTC price goes in the UPpity direction, rather than dipping. It's anyone's guess which way BTC prices are going to go from here.. at least in terms of our ongoing seemingly uneventful BTC price range that has failed/refused to break out of $8,300 to $10,200---- give or take what the actual important boundaries should be. Title: Re: Globb0 BTC charts Post by: STT on July 20, 2020, 02:59:07 PM 10k for the next couple years would be perfectly positive, way better then what I'd expect but I've always underestimated BTC possible moves. It does truly suck for trading though, we've had this previously and everyone was bored and then got knocked off their chair sideways by the giant move that halved the price. I'm fine if the price stays high if thats what helps the market stay healthy and if it has to go lower too then so be it, prices moves where it has to be to involve the greatest number of participants so we dont get to choose if higher is better or not. There isnt any real sign yet, no trend means trades are more dangerous and they double back on themselves.
Quote golden opportunity of buying Bitcoin priced less than $10,000 That sounds more like a long term hold then a trade. Its way less risky to buy into a trend thats clearly moving in a direction then guess the bottom price. So that picture of the girl trying to catch up misses that we can re-enter a position any time we like, the trader will buy at 11k and be happy about it as the risk reward ratio is better then when the price was 10k. Its the same at tops or peak price, dont be unhappy if you sold and it rose another 1k as it can get very unstable after a large amount of gains and need to reset. Hold small amounts increase as we are in a trend, reduce and realise profits and hold a little near the top; thats technique I see traders use to reduce risk on main markets and I dont see it would be different here. If its about buy and hold no matter what then the size is often much smaller, unleveraged, etc.Title: Re: Globb0 BTC charts Post by: JayJuanGee on July 20, 2020, 03:31:53 PM 10k for the next couple years would be perfectly positive, way better then what I'd expect but I've always underestimated BTC possible moves. It does truly suck for trading though, we've had this previously and everyone was bored and then got knocked off their chair sideways by the giant move that halved the price. There is about a snowballs chance in hell that bitcoin is all of a sudden going to transition into some kind of stably priced asset, which is frequently touted out as if it were some kind of real and meaningful possibility, and even you, STT, recognize that volatility has been part of bitcoin's way of being, and likely to continue in such direction... Volatility is one of the main things that we can count on in bitcoin, even moreso than what direction the BTC price is going to go. I'm fine if the price stays high if thats what helps the market stay healthy and if it has to go lower too then so be it, prices moves where it has to be to involve the greatest number of participants so we dont get to choose if higher is better or not. There isnt any real sign yet, no trend means trades are more dangerous and they double back on themselves. Whether BTC prices are currently high or low is surely a relative assessment. The trend seems to continue to be UP, even though some people like to proclaim that bitcoin is in a bear market, which hardly would be factually true for anyone who has continued to buy bitcoin. The longer you have been buying bitcoin, the further up that you would be in profits, and surely anyone might feel hesitations regarding whether the UP trend is going to continue - which then would be a retroactive assessment that we were too high.. but I am surely am not going to proclaim the future before it actually happens.. even though I see no reason to really speculate that the ongoing UP trend is not going to continue, which just continues to mean that bitcoin is likely to continue as a great ongoing asymmetric bet, in which investors, into it, are likely not even going to need to use any leverage in order to have great chances of experiencing decently good price performance. Quote golden opportunity of buying Bitcoin priced less than $10,000 That sounds more like a long term hold then a trade. Its way less risky to buy into a trend thats clearly moving in a direction then guess the bottom price. So that picture of the girl trying to catch up misses that we can re-enter a position any time we like, the trader will buy at 11k and be happy about it as the risk reward ratio is better then when the price was 10k. Its the same at tops or peak price, dont be unhappy if you sold and it rose another 1k as it can get very unstable after a large amount of gains and need to reset. Hold small amounts increase as we are in a trend, reduce and realise profits and hold a little near the top; thats technique I see traders use to reduce risk on main markets and I dont see it would be different here. If its about buy and hold no matter what then the size is often much smaller, unleveraged, etc.I do believe that we have seen plenty of times in BTC's history when there were a lot of speculation that another opportunity to buy at the same price or lower was going to come, and it never did happen. Probably no need to go over each of those times, and surely it continues to be speculation whether we are in one of those times, currently. Sometimes we may need to work with more specifics, if we are trying to consider what to do, currently, exactly. Even a lot of traders, in bitcoin, will proclaim that they are only trading with a small portion of their BTC stash, so they do maintain a decent amount of BTC just stacked away for UP, even if they might be fucking around (aka trading) with a smaller portion of their stash... cannot necessarily fault them, and if they engage in too much risky behavior, they may end up depleting or losing their "trading" stash rather than building it. Title: Re: Globb0 BTC charts Post by: dragonvslinux on July 20, 2020, 04:23:12 PM I'm fine if the price stays high if thats what helps the market stay healthy and if it has to go lower too then so be it, prices moves where it has to be to involve the greatest number of participants so we dont get to choose if higher is better or not. There isnt any real sign yet, no trend means trades are more dangerous and they double back on themselves. Whether BTC prices are currently high or low is surely a relative assessment.This is basically the bottom line. To me, it's merely relative to two different varying time-frames; long-term and short-term. Like many, I'll remain bullish long-term on the price, while the shorter-term time-frame is sometimes in in confluence with the former and other-times not. At the moment I feel it's not, so I'll remain neutral & as well as slightly bearish shorter-term, bearing in mind the strong long-term support in the near future. Either way, I feel I'll be shorting a very small % soon but still pending confirmation, Title: Re: Globb0 BTC charts Post by: exstasie on July 22, 2020, 10:00:34 AM This is basically the bottom line. To me, it's merely relative to two different varying time-frames; long-term and short-term. Like many, I'll remain bullish long-term on the price, while the shorter-term time-frame is sometimes in in confluence with the former and other-times not. At the moment I feel it's not, so I'll remain neutral & as well as slightly bearish shorter-term, bearing in mind the strong long-term support in the near future. Confluence is everything. When all time frames finally line up bullish, get ready for some fireworks. That's where the real magic happens. Until then, chop chop. :P Yesterday closed pretty bullish. I'm tempted to start building a long position, especially given the bullish action in other markets, but I'd really like to see the downtrend since June 1st broken first. Give me a higher high! So much trolling this past couple months..... Title: Re: Globb0 BTC charts Post by: Wind_FURY on July 22, 2020, 11:35:58 AM I'm fine if the price stays high if thats what helps the market stay healthy and if it has to go lower too then so be it, prices moves where it has to be to involve the greatest number of participants so we dont get to choose if higher is better or not. There isnt any real sign yet, no trend means trades are more dangerous and they double back on themselves. Whether BTC prices are currently high or low is surely a relative assessment.This is basically the bottom line. To me, it's merely relative to two different varying time-frames; long-term and short-term. Like many, I'll remain bullish long-term on the price, , and HODL. 8) Quote while the shorter-term time-frame is sometimes in in confluence with the former and other-times not. At the moment I feel it's not, so I'll remain neutral & as well as slightly bearish shorter-term, bearing in mind the strong long-term support in the near future. Buy the dip, Quote Either way, I feel I'll be shorting a very small % soon but still pending confirmation, Why risk to lose some capital by shorting? I believe it would take less risk to buy the dip if you are long-term bullish. Title: Re: Globb0 BTC charts Post by: exstasie on July 23, 2020, 09:09:48 AM Why risk to lose some capital by shorting? I believe it would take less risk to buy the dip if you are long-term bullish. Why risk capital by going long? No matter what direction you're trading, the answer should be the same: the reward justifies the risk. Here's an example:
Both of these positions is sensible TA-wise and yields a reward:risk of better than 3:1. In fact, you could even do something like a lower risk (and lower reward) straddle trade where you hold both positions. Title: Re: Globb0 BTC charts Post by: dragonvslinux on July 23, 2020, 09:42:06 AM I'm fine if the price stays high if thats what helps the market stay healthy and if it has to go lower too then so be it, prices moves where it has to be to involve the greatest number of participants so we dont get to choose if higher is better or not. There isnt any real sign yet, no trend means trades are more dangerous and they double back on themselves. Whether BTC prices are currently high or low is surely a relative assessment.This is basically the bottom line. To me, it's merely relative to two different varying time-frames; long-term and short-term. Like many, I'll remain bullish long-term on the price, , and HODL. 8) That's what it says in my user text ;) Quote while the shorter-term time-frame is sometimes in in confluence with the former and other-times not. At the moment I feel it's not, so I'll remain neutral & as well as slightly bearish shorter-term, bearing in mind the strong long-term support in the near future. Buy the dip, Indeed, this should go without saying. But for me it wouldn't be a dip to the 200 Day MA, or $8K, more like $6-7K, which we are far away from right now. Nothing has changed here. Quote Either way, I feel I'll be shorting a very small % soon but still pending confirmation, Why risk to lose some capital by shorting? I believe it would take less risk to buy the dip if you are long-term bullish. As exstasie pointed out: No matter what direction you're trading, the answer should be the same: the reward justifies the risk. To elaborate, the amount of risk isn't relevant - only the ratio to the reward is. High risk because it'd be high reward imo, more so than a short-term long position that's more medium risk with medium reward. The reason for entering a short position is same reason I'd happily take the risk in buying into a deep dip long-term, the risk justifies the reward. Most relevantly, I'd happily hedge a position by shorting short-term, as referenced: To me, it's merely relative to two different varying time-frames; long-term and short-term. For me it's also all about stacking sats 8) Trading short-term (long/short), investing long-term (btfd). I stopped taking profit in fiat over a year ago ;) The main benefit of shorting as a hedge is that if you're completely wrong, your overall investments will go up in value, only your trading account loses value. As for current price action, I stlll find it relatively irrelevant range-bound chop and noise unless the 50 Day MA is turned into support (that acted as previous resistance), or alternatively price makes a significant higher high above $9,800 where the 0.618 fib retracement lies (that would be the expected retracement before continuing lower). We haven't even retraced 50% of the move down yet ($9,620)! Let's not forget that within bearish trends, dead cats bounce with low volume, even if long-term the picture is still very bullish. Title: Re: Globb0 BTC charts Post by: JayJuanGee on July 23, 2020, 04:02:18 PM Why risk to lose some capital by shorting? I believe it would take less risk to buy the dip if you are long-term bullish. Why risk capital by going long? No matter what direction you're trading, the answer should be the same: the reward justifies the risk. Here's an example:
Both of these positions is sensible TA-wise and yields a reward:risk of better than 3:1. In fact, you could even do something like a lower risk (and lower reward) straddle trade where you hold both positions. Shorting and longing are not the same, nor are they equal in terms of their simplicity. One of the most simple things is to dollar cost average and just continue to accumulate BTC on a regular basis, which will likely turn those following such method into much richer than they otherwise would be. Of course, there are no guarantees in any strategy, but there is a certain amount of value in figuring out a reasonable accumulation level and then just getting to that level and furthermore continue to dollar cost average, without fucking around with a bunch of nonsense or trying to time which direction the BTC price is going or might be going in the short term, when likely the longer term is going to end up being UP.... and those who are not fucking around with thinking about both up and down (or valuing their wealth in short term dollar measurements), will likely be much more wealthy in the longer term (measuring in dollars or whatever). These days having a 5 year or longer investment time horizon and keeping on investment seems to be a reasonable and prudent approach. Also, 1-10% allocation in BTC seems to be a good starting amount, even though going above that range could also be reasonable and prudent for many people. Title: Re: Globb0 BTC charts Post by: exstasie on July 24, 2020, 08:42:15 AM Why risk capital by going long? No matter what direction you're trading, the answer should be the same: the reward justifies the risk. Here's an example:
Both of these positions is sensible TA-wise and yields a reward:risk of better than 3:1. In fact, you could even do something like a lower risk (and lower reward) straddle trade where you hold both positions. Shorting and longing are not the same, nor are they equal in terms of their simplicity. Sure they are. They are both margin trading, just in opposite directions. Same risks and liquidity considerations. The logic in the above post would apply just as well to spot trading (simple buying and selling) too. One of the most simple things is to dollar cost average and just continue to accumulate BTC on a regular basis, which will likely turn those following such method into much richer than they otherwise would be. I'm not knocking DCA. It's a fine strategy. I think trend trading after the market breaks out of a long term range is a fine strategy too. Title: Re: Globb0 BTC charts Post by: buwaytress on July 24, 2020, 10:16:15 AM Shorting and longing are not the same, nor are they equal in terms of their simplicity. One of the most simple things is to dollar cost average and just continue to accumulate BTC on a regular basis, which will likely turn those following such method into much richer than they otherwise would be. Of course, there are no guarantees in any strategy, but there is a certain amount of value in figuring out a reasonable accumulation level and then just getting to that level and furthermore continue to dollar cost average, without fucking around with a bunch of nonsense or trying to time which direction the BTC price is going or might be going in the short term, when likely the longer term is going to end up being UP.... and those who are not fucking around with thinking about both up and down (or valuing their wealth in short term dollar measurements), will likely be much more wealthy in the longer term (measuring in dollars or whatever). These days having a 5 year or longer investment time horizon and keeping on investment seems to be a reasonable and prudent approach. Also, 1-10% allocation in BTC seems to be a good starting amount, even though going above that range could also be reasonable and prudent for many people. Firm believer in this, but only time will tell if that approach will turn out to be prudent, things could still turn out really bad if the global economy really does go tits up and many are certain, myself included, that we haven't yet seen the full wrath of a collapsing global economy in the coming months. It might still end up being a long blip on eventual Bitcoin performance 5 years down the line, for which cost averaging will really pull in value, but the problem for guys like me is wondering if we should protect value near the top, and judging when that top is. Because while I am in the long game, I still need to eat, and hopefully I can pause averaging near the top, so I can still sit back in ease as we come down and enter the next down cycle. Title: Re: Globb0 BTC charts Post by: Wind_FURY on July 25, 2020, 10:07:28 AM Why risk to lose some capital by shorting? I believe it would take less risk to buy the dip if you are long-term bullish. Why risk capital by going long? No matter what direction you're trading, the answer should be the same: the reward justifies the risk. Here's an example:
Both of these positions is sensible TA-wise and yields a reward:risk of better than 3:1. In fact, you could even do something like a lower risk (and lower reward) straddle trade where you hold both positions. I know how it works, but how is active trading treating most of the plebs like us? 90% of "traders" are unprofitable, and 10% are profitable, but I believe only the top 2% or 3% are making massive profits. Plus for context, the post you quoted is a reply to someone who said that, "he is long term bullish, and short term bearish". Title: Re: Globb0 BTC charts Post by: Globb0 on July 25, 2020, 10:15:29 AM Title: Re: Globb0 BTC charts Post by: Tytanowy Janusz on July 25, 2020, 11:18:20 AM More sideways, but also a more positive vibe? Agree, but i'm concerned about how weak this bounce is and how low volume there is considered that we just broke resistance on 1h: https://i.imgur.com/Zgn0hPN.png And fighting right below very strong 2.5 year trend line. https://i.imgur.com/o2MBPef.png Title: Re: Globb0 BTC charts Post by: exstasie on July 25, 2020, 01:25:28 PM Why risk capital by going long? No matter what direction you're trading, the answer should be the same: the reward justifies the risk. Here's an example:
Both of these positions is sensible TA-wise and yields a reward:risk of better than 3:1. In fact, you could even do something like a lower risk (and lower reward) straddle trade where you hold both positions. I know how it works, but how is active trading treating most of the plebs like us? 90% of "traders" are unprofitable, and 10% are profitable, but I believe only the top 2% or 3% are making massive profits. Most traders lose money because they trade emotionally without a plan. The above is a means of implementing a systematically profitable strategy: letting your winners run, and cutting your losers early. Your potential gains should always significantly outweigh your potential losses, every single time. Most traders do the exact opposite. Plus for context, the post you quoted is a reply to someone who said that, "he is long term bullish, and short term bearish". How does that change the analysis? Shorting to the $6Ks then looking for an opportunity to flip long seems sensible in that case, no? Title: Re: Globb0 BTC charts Post by: STT on July 25, 2020, 10:47:44 PM Quote SL at $10,550 SL at $8,550 What I've learnt previously is just take these stop loss and put your entry far closer to it and then start dealing with the market pushing past there only to return ie. give yourself alot more leeway. I think both those areas are the boundaries, putting a stop loss there probably means the trade ends just as its tested and could reverse back in favour. High over this weekend is near to 9779 which is just an old fib line, first point of some resistance going up past 10k. Yearly average at 8558 (https://talkimg.com/images/2023/06/12/A4U0o.png) is less probable now but if we were to break down, that kind of price is where I think some buy or closing of shorts happens and we reattempt higher. Its definitely harder to go short but I just use that to hedge so Im net long. Title: Re: Globb0 BTC charts Post by: exstasie on July 26, 2020, 07:33:46 AM Quote SL at $10,550 SL at $8,550 What I've learnt previously is just take these stop loss and put your entry far closer to it and then start dealing with the market pushing past there only to return ie. give yourself alot more leeway. I think both those areas are the boundaries, putting a stop loss there probably means the trade ends just as its tested and could reverse back in favour. That's another important lesson in trading. You need to be willing to re-enter a trade after getting stopped out. Two things can happen when the market tests an important support level: a breakout, or an undercut/wick that quickly fails back into the range. The latter is what Wyckoff called a "spring," and it's basically the most important signal you can observe as a trader. https://tradingpsychologyedge.com/trading-wyckoff-springs/ So this is what often happens before a major bullish trend change. The market dips, runs all the bulls' stops (and also causes bears to trigger sell stops), everybody panics. But as it turns out, the move is faded and the price quickly recovers. All those bulls have now lost their longs, all those bears are now trapped in ugly shorts. What those bulls should do at this point is re-enter their longs. What most of them will do is lick their wounds and get too scared to go long again. It's these trapped bears and hesitant bulls that will be fueling the rally down the road. Personally I think if we dip below $8,600 after this amount of time, that bears will follow through and we'll enter a mid-term downtrend. I wouldn't expect a spring, although it's very important to be mindful of the possibility and to react when you see it. Another way to deal with these wicks is to wait for a higher time frame (like daily) candle close before flipping positions. That greatly decreases the possibility of getting trolled. Title: Re: Globb0 BTC charts Post by: Tytanowy Janusz on July 26, 2020, 10:09:17 AM Beautiful high volume pump. Didn't expect it to happend today but it looks very strong. 20 000BTC exchanged in 5 min on binance futures only. 9800-10300 pump in just 10 min.
https://i.imgur.com/HznlAjD.png Title: Re: Globb0 BTC charts Post by: JayJuanGee on July 26, 2020, 07:05:41 PM Why risk capital by going long? No matter what direction you're trading, the answer should be the same: the reward justifies the risk. Here's an example:
Both of these positions is sensible TA-wise and yields a reward:risk of better than 3:1. In fact, you could even do something like a lower risk (and lower reward) straddle trade where you hold both positions. Shorting and longing are not the same, nor are they equal in terms of their simplicity. Sure they are. They are both margin trading, just in opposite directions. Same risks and liquidity considerations. The logic in the above post would apply just as well to spot trading (simple buying and selling) too. It seems that each of us have made our points, more or less, so probably we are just repeating. I think that whenever a person adds margin, the whole matter becomes way more complicated, and regular peeps have enough of a difficult time to figure out 1) what allocation that they should invest into BTC, 2) what is the amount of cashflow that they can afford to invest into BTC without over extending themselves, 3) how to combine DCAing, lump sum investing and buying on dips in a way that is not going to cause them to over-extend themselves, and 4) for the more sophisticated investor (optional aspect), how to little by little shave off profits when the BTC price goes up while not undermining their BTC investment thesis and using that money to buy more BTC in the event that the BTC price goes down. So, part of my point is that BTC investors better get all of these more basic BTC accumulation strategies in place before they even try to fuck around with margin and figure out the dynamics of using margin including whether they are measuring their profits (and increase in wealth) in BTC accumulation or dollars.. of course in the long term, most of us are likely measuring our wealth in terms of how much more richie we expect to be in terms of how much the dollar value of that is going to be, even though at the same time we likely also realize that the dollar is seeming to get fucked so much too that dollar valuation is also seeming possibly to NOT be so meaningful in terms of a future unit of account... but anyhow, today as I type, and likely into the meaningful foreseeable future, the dollar continues to be a main unit of measure (until it isn't, if such thing happens). One of the most simple things is to dollar cost average and just continue to accumulate BTC on a regular basis, which will likely turn those following such method into much richer than they otherwise would be. I'm not knocking DCA. It's a fine strategy. I think trend trading after the market breaks out of a long term range is a fine strategy too. We likely do not disagree very much on these aspects, while at the same time, I am continuously suggesting that foundational systems for BTC investors likely to be strong... and of course, the bigger trend trading is likely going to cause BTC portfolios to perform much better, while at the same time we find so many folks who end up selling way too much too early, which causes way too much emotionalism and then causes them to fuck up by buying back before the BTC price drops back down and a lot of emotionally based and lack of patience strategies that causes the vast majority of folks to do the opposite of what they should be doing and failing to actually get in front of the trend, wait for the BTC price to come to them, and just figure out their BIG SWINGS plan ahead of time by just leaving their sales on the table, in the event that they do end up selling too much too soon. Sure, devil is in the details, so we will likely NOT quite agree on specific ways to accomplish and ensure profitable strategies (and the degree of profits may well vary too based on largely small differences in strategies and perhaps some luck, too). Title: Re: Globb0 BTC charts Post by: JayJuanGee on July 26, 2020, 07:36:02 PM Shorting and longing are not the same, nor are they equal in terms of their simplicity. One of the most simple things is to dollar cost average and just continue to accumulate BTC on a regular basis, which will likely turn those following such method into much richer than they otherwise would be. Of course, there are no guarantees in any strategy, but there is a certain amount of value in figuring out a reasonable accumulation level and then just getting to that level and furthermore continue to dollar cost average, without fucking around with a bunch of nonsense or trying to time which direction the BTC price is going or might be going in the short term, when likely the longer term is going to end up being UP.... and those who are not fucking around with thinking about both up and down (or valuing their wealth in short term dollar measurements), will likely be much more wealthy in the longer term (measuring in dollars or whatever). These days having a 5 year or longer investment time horizon and keeping on investment seems to be a reasonable and prudent approach. Also, 1-10% allocation in BTC seems to be a good starting amount, even though going above that range could also be reasonable and prudent for many people. Firm believer in this, but only time will tell if that approach will turn out to be prudent, things could still turn out really bad if the global economy really does go tits up and many are certain, myself included, that we haven't yet seen the full wrath of a collapsing global economy in the coming months. It might still end up being a long blip on eventual Bitcoin performance 5 years down the line, for which cost averaging will really pull in value, but the problem for guys like me is wondering if we should protect value near the top, and judging when that top is. Because while I am in the long game, I still need to eat, and hopefully I can pause averaging near the top, so I can still sit back in ease as we come down and enter the next down cycle. These can be quite tough calls regarding how much to take out as the BTC price goes up, which it is likely to do, and whether more should be taken out based upon larger BTC price moves up. Even though currently, I consider rpietila to be a bit of a delusional scammer, he did make a good thread, back in the day, that had allowed me some thinking through my BTC profit-taking plans. (SSS) - A Sane and Simple bitcoin Savings plan (https://bitcointalk.org/index.php?topic=345065.msg3697405#msg3697405) I personally do a variation of that, which is to cash out about 1% value for every 10% the BTC price goes up and then to use a portion of those proceeds to buy BTC back, and rpietila had recommended raking out 10% for every 100% that the BTC price goes up without looking back. Of course, each BTC accumulator has to find a balance that s/he feels comfortable to attempt to accomplish, and to set up that plan before the BTC price starts going crazy. Surely, each of us has the power and discretion to adjust our plan along the way, but if we at least have a bare minimum plan, then we have a lot more solid of a base in which we can work from in the event that we go to making adjustments to our plan(s) along the way... whether that is cashing out more or cashing out less and waiting somewhat strategically for certain adjusted BTC price points. I have frequently proclaimed that no matter what BTC investors (those attempting to swing trade) do is that they should never run out of cash to buy more BTC (and keep a plan in that direction), and also never run out of BTC to sell in the event that the BTC price keeps going up beyond expectations, and both of those scenarios are easier said than done... and maybe there is a certain amount of BTC that BTC investors might say that they are going to HODL no matter what.. whether that is 20%, 50%, 70% or some other personally decided amount of their BTC allocated investment funds in BTC... of course, timeline will contribute to how to treat the BTC investment, especially if an investor is either getting really old or an investor has reason to believe that s/he might be needing fiat in a shorter time line (whether health reasons or some other personally specific reasons). By the way, regarding your proclamation that you "need to eat," buwaytress. That is true. You should be sure to ensure that you have largely already accounted for your cashflow, and my own system tends to use an Excel spread sheet to project out my expenses for 6 months to 2 years, and of course, the more complicated your expenses, or your anticipated expenses (maybe including business relations, family expenses and/or other bills or uncertainties in cashflow), the more that you need to project further out and even to keep a larger dollar cushion in one or more locations that ensure that you are able to cover those various basic expenses and emergency expenses that should be considered way before the likely more discretionary hookers, lambos and blow part. ;) Title: Re: Globb0 BTC charts Post by: Wind_FURY on July 27, 2020, 05:35:19 AM Why risk capital by going long? No matter what direction you're trading, the answer should be the same: the reward justifies the risk. Here's an example:
Both of these positions is sensible TA-wise and yields a reward:risk of better than 3:1. In fact, you could even do something like a lower risk (and lower reward) straddle trade where you hold both positions. I know how it works, but how is active trading treating most of the plebs like us? 90% of "traders" are unprofitable, and 10% are profitable, but I believe only the top 2% or 3% are making massive profits. Most traders lose money because they trade emotionally without a plan. The above is a means of implementing a systematically profitable strategy: letting your winners run, and cutting your losers early. Your potential gains should always significantly outweigh your potential losses, every single time. Most traders do the exact opposite. That's partly the reason, but that doesn't change the fact that 90% of "traders" are losing plebs like us. To resist? I believe buy the dip, and HODL. Quote Plus for context, the post you quoted is a reply to someone who said that, "he is long term bullish, and short term bearish". How does that change the analysis? Shorting to the $6Ks then looking for an opportunity to flip long seems sensible in that case, no? It's risky, the current market took some coins from you, might make you HODL less on the path to 6 digits. Title: Re: Globb0 BTC charts Post by: exstasie on July 27, 2020, 08:54:09 AM It's risky, the current market took some coins from you, might make you HODL less on the path to 6 digits. The risk goes both ways. If you don't have fiat to buy the dip because you bought high and didn't sell, you're losing coins too. It's just a matter of perspective. My goal is to manage my risk so I can lose a shitload of trades (for example, a 60/40 win rate) and still be gaining coins overall. Consider the straddle trade we discussed above. If you shorted and longed at equivalent leverage, then close out the short when the range breaks above $10,550, you should gain 25% on your coins assuming the market reaches $13K or so. Title: Re: Globb0 BTC charts Post by: Globb0 on July 27, 2020, 09:03:50 AM Title: Re: Globb0 BTC charts Post by: JayJuanGee on July 27, 2020, 02:20:43 PM Is it topping out, Globb0? Sometimes momentum comes, and then the momentum ends up being irrational with traders continuing to suspect that the top is in.. enter another short and continue to get rekkt as the top does not materialize until later down the road and after several shorts have been rekkt. Surely, I have no crystal ball, but I suspect that there could be plenty of shorters that had been expecting down before up when we were stuck at $9,100-ish, just 7 days ago. The small incremental stairways have been up and up and up in the past 7 days, and sure it could end at any time, but still seems a great time to rekk some more shorts along a further path upwards.. punish the fucks waiting for down, naysaying bitcoin, fence sitting, but surely it is not punishing too many of the shitcoin pumpeners, yet. I would think that we are within a more solid BTC pumpening if we were able to witness more shitcoins getting punished along the way, yet I have no fucking clue.. regarding what is short-term sustainable, either... so currently, for example, if you look at bitcoin versus shitcoin performance over the past 6 months, you will find the two bcashes performing relatively badly, but ethereum outperforming bitcoin. Sure, some of the money entering the shitcoin space can continue to be fuel for bitcoin, even though it remains so difficult to specify exactly how it might be playing out.. except for maybe some seemingly obvious examples from time to time - but otherwise currently valid BTC price prediction models such as stock to flow, 4 year fractal and s-curve exponential adoption based on metcalfe and networking principles do not really seem to give any shits about whether shitcoins might be pumpening or not in the short term. Title: Re: Globb0 BTC charts Post by: Wind_FURY on July 28, 2020, 08:31:45 AM It's risky, the current market took some coins from you, might make you HODL less on the path to 6 digits. The risk goes both ways. If you don't have fiat to buy the dip because you bought high and didn't sell, you're losing coins too. It's just a matter of perspective. My goal is to manage my risk so I can lose a shitload of trades (for example, a 60/40 win rate) and still be gaining coins overall. Consider the straddle trade we discussed above. If you shorted and longed at equivalent leverage, then close out the short when the range breaks above $10,550, you should gain 25% on your coins assuming the market reaches $13K or so. Maybe you're included in the winning 10%. I was only pointing out that 90% of active traders WILL lose some of the their capital, especially a pleb like me, who has no winning-chance against the market-makers, the whalecumulators, and the insiders. Title: Re: Globb0 BTC charts Post by: Globb0 on July 28, 2020, 09:36:30 AM I guess that more positive vibe was right. Kaboom!
https://i.imgur.com/G4diZPc.jpg Daily closed over the channel. After all this time. Good. Title: Re: Globb0 BTC charts Post by: dragonvslinux on July 28, 2020, 10:11:26 AM Is it topping out, Globb0? Sometimes momentum comes, and then the momentum ends up being irrational with traders continuing to suspect that the top is in.. enter another short and continue to get rekkt as the top does not materialize until later down the road and after several shorts have been rekkt. Not that you were asking me, but I think it's possible were at the short-term top based on a bull flag channel (that's been adjusted to include yesterdays close) and TD Sequential sell signal: https://www.tradingview.com/x/GW1wwCH3/ This doesn't imply it'd be a good time to short, far from it, it'd be a terrible time risk/reward wise. However, price coming back down to re-test the mid-level of the bull channel is likely imo, this would be around $10.2K, that'd also be testing the higher high Weekly close. This would also fit nicely with re-testing ascending triangle resistance ($10K) to turn it into support, if this pattern feels more relevant to you, and would therefore be a great opportunity to buy the dip imo: https://www.tradingview.com/x/Vo8rDLuN/ Personally I find the bull-flag much more relevant, as now looking at the ascending triangle viewpoint it's clearly within a perfect ascending parallel channel after the third touch-point confirmed on the resistance trend-line. It's possible to come back down to the ascending support trend-line, as well as re-test the long-term resistance trend-line to turn it into support, which is around the VPVR point of control, but I'm finding this less likely unless the correction goes deeper than anticipated. Title: Re: Globb0 BTC charts Post by: exstasie on July 28, 2020, 10:36:16 AM Surely, I have no crystal ball, but I suspect that there could be plenty of shorters that had been expecting down before up when we were stuck at $9,100-ish, just 7 days ago. Swap funding rates and Bitfinex shorts don't really reflect it, but that's actually my sense too from traders I know. I think a lot of people were caught on the wrong side of this move. I suppose that should be expected from a 2-3 month long range. I would think that we are within a more solid BTC pumpening if we were able to witness more shitcoins getting punished along the way, yet I have no fucking clue.. regarding what is short-term sustainable, either... so currently, for example, if you look at bitcoin versus shitcoin performance over the past 6 months, you will find the two bcashes performing relatively badly, but ethereum outperforming bitcoin. I want to see altcoins dumping while BTC is pumping hard, then I want to see altcoins pumping while BTC is pulling back or going sideways. That is typical bull market behavior. Title: Re: Globb0 BTC charts Post by: cryptomaniac_xxx on July 28, 2020, 10:59:35 AM ^^ Or simply alts bringing down bitcoin's dominance to a level similar to 2017's bull run, around 40%-45%. ;D, and let some major altcoins to pump and dump, while BTC continues to go on an upward trend.
Title: Re: Globb0 BTC charts Post by: STT on July 28, 2020, 03:29:02 PM Thats brave calling a top after such action, most of us would presume its set to go on a run now after beating this prior boundary thats held for so long. Today 10500 was the pullback low and that makes sense to most of us, for some reason my brain said watch 10900 for an area to mark but hopefully if I'd been awake I'd have remembered 10500 was the prior point of interest so that makes sense. That low is also in the region of 2 day MA, it should calm at some point to consolidate and all that.
The really bigger picture I was thinking of some relevance and I wouldnt post it many places but Dollar index has been coming down alot recently. Its notable when the reserve currency loses 1.7% in a week. Inversely thats a tail wind for BTC so I watch it for any argument in terms of pullbacks, etc. In 2017 UUP fell the whole year, it was of some benefit imo though its macro and not directly connected, its probably also no coincidence gold (https://www.zerohedge.com/markets/goldman-warns-real-concerns-are-emerging-about-dollar-reserve-currency-goes-all-gold) is silly strong at present. https://talkimg.com/images/2023/06/12/AopJf.png Title: Re: Globb0 BTC charts Post by: JayJuanGee on July 28, 2020, 04:09:23 PM It's risky, the current market took some coins from you, might make you HODL less on the path to 6 digits. The risk goes both ways. If you don't have fiat to buy the dip because you bought high and didn't sell, you're losing coins too. It's just a matter of perspective. My goal is to manage my risk so I can lose a shitload of trades (for example, a 60/40 win rate) and still be gaining coins overall. Consider the straddle trade we discussed above. If you shorted and longed at equivalent leverage, then close out the short when the range breaks above $10,550, you should gain 25% on your coins assuming the market reaches $13K or so. Maybe you're included in the winning 10%. I was only pointing out that 90% of active traders WILL lose some of the their capital, especially a pleb like me, who has no winning-chance against the market-makers, the whalecumulators, and the insiders. I think that is part of the reason why I proclaim that anyone aiming at trading is starting out with very small portions of their BTC holdings, and that building up those BTC holdings through normal methods of DCA and buying on dips is more important to accomplish first, and of course, if a decently smaller portion of the holdings is used to trade, then likely there could be ways to practice various kinds of systems that could tend towards being overall profitable... but as soon as margin is added into the mix, then the complexity of the system goes up in such a way that makes it more difficult to ensure profitability (even though the profit potential increases, too), as compared with more simple systems that do not employ margin techniques. Is it topping out, Globb0? Sometimes momentum comes, and then the momentum ends up being irrational with traders continuing to suspect that the top is in.. enter another short and continue to get rekkt as the top does not materialize until later down the road and after several shorts have been rekkt. Not that you were asking me, but I think it's possible were at the short-term top based on a bull flag channel (that's been adjusted to include yesterdays close) and TD Sequential sell signal: https://www.tradingview.com/x/GW1wwCH3/ Well when I typed my question for Globb0 (and of course anyone else willing to try to answer it), we had been largely topping in the sub $10,400 arena, and the BTC price had not yet breached that $10,400 area at the time of my post. By the time, you responded dragon, we had advanced an additional $1k to top out at a bit over $11,400 and had corrected down from there, including at the time of your post a correction down to the 10,500 arena.. so in that sense, surely there could be some time for some assessment of additional correction, and than now that we are back to hovering in the supra $11,111 arena, seems difficult to say that the UP momentum has yet been broken, no? Even if there might be some signals for more down.. we are surely continuing to get support for $11k-ish that may well even be supra $11k-ish.. and a willingness to test $12k-ish and higher, in spite of some possible signals for correction.. not that I know what the fuck a "TD Sequential sell signal" is. hahahahaha... sorry for my seemingly lack of cooperation in googling it. This doesn't imply it'd be a good time to short, far from it, it'd be a terrible time risk/reward wise. However, price coming back down to re-test the mid-level of the bull channel is likely imo, this would be around $10.2K, that'd also be testing the higher high Weekly close. This would also fit nicely with re-testing ascending triangle resistance ($10K) to turn it into support, if this pattern feels more relevant to you, and would therefore be a great opportunity to buy the dip imo: https://www.tradingview.com/x/Vo8rDLuN/ Of course, I am all for buying any dip, even if buying supra $10k and even if BTC prices might end crashing back down to test $8k, but I am also all with you that with so much passage of time below $10k, there might be enough willpower and continued buying support with such Lindy effect and continued expectation that BTC has had enough 4 digits that there is sufficient amount of desire throughout the BTC buyer base to go up from here, causing 4 digits to be a thing of the past, except maybe for some short-lived blip that might take place... wishful and not technical on my behalf in terms of analysis of likely ongoing moving up of BTC buying support, perhaps? Personally I find the bull-flag much more relevant, as now looking at the ascending triangle viewpoint it's clearly within a perfect ascending parallel channel after the third touch-point confirmed on the resistance trend-line. It's possible to come back down to the ascending support trend-line, as well as re-test the long-term resistance trend-line to turn it into support, which is around the VPVR point of control, but I'm finding this less likely unless the correction goes deeper than anticipated. We are likely coming to similar conclusions, dragon, in terms of considering that there seems to remain decent ongoing upwards BTC price pressures, and surely both of us know that sometimes there might be some purposeful punishment (or do we call it manipulation?) attempts going on that won't allow BTC prices to correct back down to what might seem to be reasonable and prudent levels... So in that regard, my philosophy has continued to largely be that of a HODLer who will error on the side of HODLing through.. even if the charts might be suggesting that a correction is necessary or reasonable... which we also realize that with such an ongoingly small market cap, BTC continues to have crazy-ass moments of unreasonableness... which feel better when they are towards the upside rather than to the downside, and we know that direction can also rapidly change, too (which does not really seem to be happening, currently, as I type). Title: Re: Globb0 BTC charts Post by: exstasie on July 28, 2020, 08:40:28 PM The really bigger picture I was thinking of some relevance and I wouldnt post it many places but Dollar index has been coming down alot recently. Its notable when the reserve currency loses 1.7% in a week. Yep, DXY is in a big mid-term downtrend. Meanwhile, gold just made new ATHs and is continuing to push upwards. Silver is on an insane bull run. Very crazy times. Good times to make money. BTC should stay aligned to risk assets like stocks and gold, all of which still look very bullish, big picture. They may take turns pumping (stocks sideways, BTC up; BTC sideways, stocks up) just like BTC and altcoins often do. Regarding the BTC chart, that intraday pullback to $10.5K might be as low as we get for a while. Anything in the $10K-$10.5K range is worth knife catching at this point, with targets in the $12K-$14K range and stops below yesterday's daily low. Title: Re: Globb0 BTC charts Post by: dragonvslinux on July 28, 2020, 09:14:30 PM Is it topping out, Globb0? Sometimes momentum comes, and then the momentum ends up being irrational with traders continuing to suspect that the top is in.. enter another short and continue to get rekkt as the top does not materialize until later down the road and after several shorts have been rekkt. Not that you were asking me, but I think it's possible were at the short-term top based on a bull flag channel (that's been adjusted to include yesterdays close) and TD Sequential sell signal: https://www.tradingview.com/x/GW1wwCH3/ Well when I typed my question for Globb0 (and of course anyone else willing to try to answer it), we had been largely topping in the sub $10,400 arena, and the BTC price had not yet breached that $10,400 area at the time of my post. Fair point, that I hadn't noticed. Makes a bit more sense now :D By the time, you responded dragon, we had advanced an additional $1k to top out at a bit over $11,400 and had corrected down from there, including at the time of your post a correction down to the 10,500 arena.. so in that sense, surely there could be some time for some assessment of additional correction, and than now that we are back to hovering in the supra $11,111 arena, seems difficult to say that the UP momentum has yet been broken, no? Even if there might be some signals for more down.. we are surely continuing to get support for $11k-ish that may well even be supra $11k-ish.. and a willingness to test $12k-ish and higher, in spite of some possible signals for correction.. not that I know what the fuck a "TD Sequential sell signal" is. hahahahaha... sorry for my seemingly lack of cooperation in googling it. Correct, I don't see any up momentum broken. The TD Sequential sell signal is fairly unreliable, it usually signals taking profits at the close of the candle. The opportunity to short would be a Red 2 candle moving below a Red 1, it's all very philosophical to be honest, but I try and pay attention to not get caught out :P That said, todays candle closing as a Green 1 would imply going long on a move above today's close, as well as effectively negating the sell signal in itself (as well as any shorting opportunities from it). So without follow through from the sell signal, it's not much of a sell signal, but instead implies a parabolic move could next occur (as has happened numerous times before). This doesn't imply it'd be a good time to short, far from it, it'd be a terrible time risk/reward wise. However, price coming back down to re-test the mid-level of the bull channel is likely imo, this would be around $10.2K, that'd also be testing the higher high Weekly close. This would also fit nicely with re-testing ascending triangle resistance ($10K) to turn it into support, if this pattern feels more relevant to you, and would therefore be a great opportunity to buy the dip imo: https://www.tradingview.com/x/Vo8rDLuN/ Of course, I am all for buying any dip, even if buying supra $10k and even if BTC prices might end crashing back down to test $8k, but I am also all with you that with so much passage of time below $10k, there might be enough willpower and continued buying support with such Lindy effect and continued expectation that BTC has had enough 4 digits that there is sufficient amount of desire throughout the BTC buyer base to go up from here, causing 4 digits to be a thing of the past, except maybe for some short-lived blip that might take place... wishful and not technical on my behalf in terms of analysis of likely ongoing moving up of BTC buying support, perhaps? Not that wishful no. From an alternative perspective, the strong long-term horizontal resistance was at five figures, therefore there is a good chance price could never fall back into 4 digits again. The fact I hear many looking at past times Bitcoin broke $10K and was rejected, suggesting that this time could be the same, is a false analagy. Each time this resistance is tested it becomes weaker, therefore, each time Bitcoin breaks above it there is LESS chance of falling below, not equal. Just my opinion, but statistically valid at least. Personally I find the bull-flag much more relevant, as now looking at the ascending triangle viewpoint it's clearly within a perfect ascending parallel channel after the third touch-point confirmed on the resistance trend-line. It's possible to come back down to the ascending support trend-line, as well as re-test the long-term resistance trend-line to turn it into support, which is around the VPVR point of control, but I'm finding this less likely unless the correction goes deeper than anticipated. We are likely coming to similar conclusions, dragon, in terms of considering that there seems to remain decent ongoing upwards BTC price pressures, and surely both of us know that sometimes there might be some purposeful punishment (or do we call it manipulation?) attempts going on that won't allow BTC prices to correct back down to what might seem to be reasonable and prudent levels... So in that regard, my philosophy has continued to largely be that of a HODLer who will error on the side of HODLing through.. even if the charts might be suggesting that a correction is necessary or reasonable... which we also realize that with such an ongoingly small market cap, BTC continues to have crazy-ass moments of unreasonableness... which feel better when they are towards the upside rather than to the downside, and we know that direction can also rapidly change, too (which does not really seem to be happening, currently, as I type). I also agree that this punishment to those not hodling, or otherwise failing to buy dips or breakouts (or buying at all!!!), is pretty common. I still remember the $4k break to $5k (+25%) in 2019 (don't we all?), and like most people I was waiting for a healthy 50% retracement to $4.5k, thinking I would be front-running those looking to buy $4.2-$4.4k. Instead, price didn't even break $4.9k and instead drifted higher, leaving ony those who were willing to buy the next break out an opportunity to get good positions. Then we all know what happened from here, all dip buyers were left behind and price rocketed to $14k. This is why I've positioned myself accordingly, knowing that a break out $10k coud mean there won't be a dip until after $14k, $17.5 or even $20k is reached. Obviously I feel there will be a significant dip before ATH, but given what happened in 2019, nothing is certain. The only irony being anyone who patiently waited for $4.5k to be re-tested woud of eventually got there bids filled over a year later! This is also something to bare in mind I believe. My gut feeling tells me if we have another 2019 parabolic run back up to ATH, we'll be more likely to re-retest $10k than we are now. Strange thinking I know, if $12-14k is reached and a healthy correction pursues, I don't think $10k is likely, but if we find ourselves close to new ATH in a few months, I'll be concerned tbh. Title: Re: Globb0 BTC charts Post by: exstasie on July 28, 2020, 09:46:20 PM My gut feeling tells me if we have another 2019 parabolic run back up to ATH, we'll be more likely to re-retest $10k than we are now. Strange thinking I know, if $12-14k is reached and a healthy correction pursues, I don't think $10k is likely, but if we find ourselves close to new ATH in a few months, I'll be concerned tbh. I'm leaning towards the upper two trajectories David pointed out here: If this is actually the beginning of a bubble cycle, then we're looking at some very painful 35-40%+ corrections along the way in a healthy build-up to the blow off top. Think about summer 2016, January 2017, March 2017, summer 2017. True, sustainable long term bull markets are characterized by deep skepticism and pessimism in the earlier stages, which is why you get those painful corrections. I believe that's where we are now. With that in mind, a shakeout to $10K (or ideally below to fill the $9,600s CME gap from last week) seems pretty likely. If the market runs as high as $17K, I would probably revise my sights higher, somewhere in the $10K-$11K range. Something in that ~35-42% pullback range though. It's during fast short squeeze type bull runs (like 2019) that you don't get those deep pullbacks. I'm not really expecting that scenario to play out again. Title: Re: Globb0 BTC charts Post by: Stedsm on July 28, 2020, 10:08:42 PM --snip-- If this is actually the beginning of a bubble cycle, then we're looking at some very painful 35-40%+ corrections along the way in a healthy build-up to the blow off top. Think about summer 2016, January 2017, March 2017, summer 2017. True, sustainable long term bull markets are characterized by deep skepticism and pessimism in the earlier stages, which is why you get those painful corrections. I believe that's where we are now. Bubble cycle? I guess this ~$2k pump was all a trap and not some healthy upward correction for BTC and even if BTC takes a dig at this level to the point you suggested, i.e.; 35-40% downside crash, will take it to around sub-$7k which is still not bad considering how gradually did we go down from $20k and settled near $3k. If this is bubble itself and if it is to burst, I guess it should burst now before going towards another big rally. I told people about this pump before but nobody listened, at least they should prepare themselves on getting out of this fakeout. I don't see BTC above $10k for very long time (I'm neither pessimistic not bearish, but this is what I'm seeing) unless US Dollar weakens too much that it could not handle the strength of BTC alone. Title: Re: Globb0 BTC charts Post by: exstasie on July 28, 2020, 10:24:38 PM If this is actually the beginning of a bubble cycle, then we're looking at some very painful 35-40%+ corrections along the way in a healthy build-up to the blow off top. Think about summer 2016, January 2017, March 2017, summer 2017. True, sustainable long term bull markets are characterized by deep skepticism and pessimism in the earlier stages, which is why you get those painful corrections. I believe that's where we are now. Bubble cycle? I guess this ~$2k pump was all a trap and not some healthy upward correction for BTC and even if BTC takes a dig at this level to the point you suggested, i.e.; 35-40% downside crash, will take it to around sub-$7k which is still not bad considering how gradually did we go down from $20k and settled near $3k. I don't mean to imply this rally is over yet, so not a 35-40% correction from here. The market could easily run to $14K or even wick up as high as $16K or $17K before experiencing one of those painful corrections. It's very unpredictable this far out. Once we have an obvious swing high in place like early May or early June, we can zero in on retracement targets. Sub-$8K is probably completely off the table, and even sub-$9K is unlikely in my view. I do think we will eventually see $9K-$10.5K one more time on a pullback to support, a month or three from now. That will probably be the buy opportunity of a lifetime. Title: Re: Globb0 BTC charts Post by: Stedsm on July 28, 2020, 10:54:01 PM I do think we will eventually see $9K-$10.5K one more time on a pullback to support, a month or three from now. That will probably be the buy opportunity of a lifetime. I'm currently biased on my decision and waiting for BTC to break the two important levels either side. Another thing, it's better not to wick out and go up steadily, else I see BTC getting stable back between the levels you think will be seen eventually. 2020 year has made many things possible, so when DeFi tokens have started turning sheer green, there's no reason for me not to believe in BTC but the fact is, we all know we've started changing our minds towards crypto and not all of us are into BTC alone (even when we believe this is its upcoming golden period). Title: Re: Globb0 BTC charts Post by: slaman29 on July 29, 2020, 06:32:48 AM I do think we will eventually see $9K-$10.5K one more time on a pullback to support, a month or three from now. That will probably be the buy opportunity of a lifetime. I'm currently biased on my decision and waiting for BTC to break the two important levels either side. Another thing, it's better not to wick out and go up steadily, else I see BTC getting stable back between the levels you think will be seen eventually. 2020 year has made many things possible, so when DeFi tokens have started turning sheer green, there's no reason for me not to believe in BTC but the fact is, we all know we've started changing our minds towards crypto and not all of us are into BTC alone (even when we believe this is its upcoming golden period). I hope exstasie is right but people were also calling the last pullback below $10k as the last time we would ever see that price again. It eventually even went down past $4k (but we can discount black swan event maybe) but still, possibilities may be small for it happening again but I think buy opportunities of a lifetime will come around again a few more times before ATH. Title: Re: Globb0 BTC charts Post by: Globb0 on July 29, 2020, 07:23:32 AM Title: Re: Globb0 BTC charts Post by: exstasie on July 29, 2020, 10:53:02 PM I do think we will eventually see $9K-$10.5K one more time on a pullback to support, a month or three from now. That will probably be the buy opportunity of a lifetime. I'm currently biased on my decision and waiting for BTC to break the two important levels either side. Another thing, it's better not to wick out and go up steadily, else I see BTC getting stable back between the levels you think will be seen eventually. 2020 year has made many things possible, so when DeFi tokens have started turning sheer green, there's no reason for me not to believe in BTC but the fact is, we all know we've started changing our minds towards crypto and not all of us are into BTC alone (even when we believe this is its upcoming golden period). I hope exstasie is right but people were also calling the last pullback below $10k as the last time we would ever see that price again. It eventually even went down past $4k (but we can discount black swan event maybe) but still, possibilities may be small for it happening again but I think buy opportunities of a lifetime will come around again a few more times before ATH. Last time around, we were still stuck in a long term bearish structure. All lower highs since June 2019. People were just speculating the structure would break into a new uptrend, which never happened. This time, that year-long bearish structure was actually broken with a higher high. That tells me lots of bears are trapped at lower levels and will reliably be fueling this new uptrend for some time. If the market breaks above the June 2019 high in the $13,000s it will indicate the entire post-2017 bear market is over. One step at a time..... Title: Re: Globb0 BTC charts Post by: Wind_FURY on July 30, 2020, 08:19:54 AM It's risky, the current market took some coins from you, might make you HODL less on the path to 6 digits. The risk goes both ways. If you don't have fiat to buy the dip because you bought high and didn't sell, you're losing coins too. It's just a matter of perspective. My goal is to manage my risk so I can lose a shitload of trades (for example, a 60/40 win rate) and still be gaining coins overall. Consider the straddle trade we discussed above. If you shorted and longed at equivalent leverage, then close out the short when the range breaks above $10,550, you should gain 25% on your coins assuming the market reaches $13K or so. Maybe you're included in the winning 10%. I was only pointing out that 90% of active traders WILL lose some of the their capital, especially a pleb like me, who has no winning-chance against the market-makers, the whalecumulators, and the insiders. I think that is part of the reason why I proclaim that anyone aiming at trading is starting out with very small portions of their BTC holdings, and that building up those BTC holdings through normal methods of DCA and buying on dips is more important to accomplish first, and of course, if a decently smaller portion of the holdings is used to trade, then likely there could be ways to practice various kinds of systems that could tend towards being overall profitable... but as soon as margin is added into the mix, then the complexity of the system goes up in such a way that makes it more difficult to ensure profitability (even though the profit potential increases, too), as compared with more simple systems that do not employ margin techniques. I tried, and I failed, but I recouped my losses back by simply saving a portion of my salary, and buy the dips. It's not a perfect strategy, but it's working for me. I do think we will eventually see $9K-$10.5K one more time on a pullback to support, a month or three from now. That will probably be the buy opportunity of a lifetime. I'm currently biased on my decision and waiting for BTC to break the two important levels either side. Another thing, it's better not to wick out and go up steadily, else I see BTC getting stable back between the levels you think will be seen eventually. 2020 year has made many things possible, so when DeFi tokens have started turning sheer green, there's no reason for me not to believe in BTC but the fact is, we all know we've started changing our minds towards crypto and not all of us are into BTC alone (even when we believe this is its upcoming golden period). I hope exstasie is right but people were also calling the last pullback below $10k as the last time we would ever see that price again. It eventually even went down past $4k (but we can discount black swan event maybe) but still, possibilities may be small for it happening again but I think buy opportunities of a lifetime will come around again a few more times before ATH. Last time around, we were still stuck in a long term bearish structure. All lower highs since June 2019. People were just speculating the structure would break into a new uptrend, which never happened. This time, that year-long bearish structure was actually broken with a higher high. That tells me lots of bears are trapped at lower levels and will reliably be fueling this new uptrend for some time. If the market breaks above the June 2019 high in the $13,000s it will indicate the entire post-2017 bear market is over. One step at a time..... That's a worse situation than the girl in the third panel. Haha. Title: Re: Globb0 BTC charts Post by: JayJuanGee on July 30, 2020, 04:47:03 PM It's risky, the current market took some coins from you, might make you HODL less on the path to 6 digits. The risk goes both ways. If you don't have fiat to buy the dip because you bought high and didn't sell, you're losing coins too. It's just a matter of perspective. My goal is to manage my risk so I can lose a shitload of trades (for example, a 60/40 win rate) and still be gaining coins overall. Consider the straddle trade we discussed above. If you shorted and longed at equivalent leverage, then close out the short when the range breaks above $10,550, you should gain 25% on your coins assuming the market reaches $13K or so. Maybe you're included in the winning 10%. I was only pointing out that 90% of active traders WILL lose some of the their capital, especially a pleb like me, who has no winning-chance against the market-makers, the whalecumulators, and the insiders. I think that is part of the reason why I proclaim that anyone aiming at trading is starting out with very small portions of their BTC holdings, and that building up those BTC holdings through normal methods of DCA and buying on dips is more important to accomplish first, and of course, if a decently smaller portion of the holdings is used to trade, then likely there could be ways to practice various kinds of systems that could tend towards being overall profitable... but as soon as margin is added into the mix, then the complexity of the system goes up in such a way that makes it more difficult to ensure profitability (even though the profit potential increases, too), as compared with more simple systems that do not employ margin techniques. I tried, and I failed, but I recouped my losses back by simply saving a portion of my salary, and buy the dips. It's not a perfect strategy, but it's working for me. Maybe you have not completely failed, especially if you learned from your earlier attempts regarding what does not work for you? Also, could have been that you were playing with too much. My personal system is just a series of longs and I do not short, but I consider it to be largely successful. I spend nearly my first year and a half in bitcoin (late 2013 to mid 2015) merely just accumulating BTC in order to get up to my accumulation target, which was supposed to be about 10% of my quasi-investible assets in bitcoin. So, largely I met my BTC accumulation goal by the end of 2014, and then since there was such a down year in bitcoin throughout 2015, I continued to accumulate BTC through mostly DCA (no real buying on dips become there were's so many dips in 2015), so I went passed my accumulation goal; therefore, once I strategized and started to employ my selling BTC on the way up strategy, starting in about the end of 2015.. sure I even screwed some of that up in the beginning... but anyhow the overall plan that developed was to sell about 1% of the value of my holdings for every 10% that the BTC price went up and then in the even that the BTC price went down, then I would use the sales proceeds to buy back. Largely I consider my system to be successful and profitable for stacking sats and increasing overall value. One of the benefits of my system is that mostly I am emotionally neutral about the short term price direction, and as long as the BTC price goes up with the passage of time, my system is profitable. I know some guys will suggest that I might try to sell BIGGER on BIGGER price swings or buy BIGGER on BIGGER BTC price dips, and maybe I can do that here and there along the way, so long as I largely am staying with my overall system, even while I do tend to make some smaller personalized tweaks along the way. By the way, my having had overinvested in BTC in 2014 and 2015 and then being a bit of a scrouge mcduck regarding how much BTC to sell along the way up (as we know that we are up from 2014/2015), there is considerable comfort in just having a cushion of profit to be able to sell a decent chunk of BTC at any time, whether on the rise or on a BTC price dip, and either way, those sold BTC are profitable.... maybe not as profitable as they could be, but sufficiently profitably to cause me to feel that I have a lot of options, which is a lot of freedom in itself. I can also take a 10% 20% or even 50% portion of my BTC stash and fuck around with attempting to trade it to make more profits out of it, if I want to do that, and I would still have a decent remaining BTC stash that is just stored in a long status. Especially during a long BTC price dipping period, it could be very tempting to sell off a BIGGER portion of my BTC stash and play the BIG price waves to make potential profits, and surely some guys are more comfortable with those strategies than other guys and surely some BTC price performance situations could inspire me to go down some variation of that path in the future (I have not really done that, so far, in any kind of LARGE way). And if I am going to employ such strategies, my preference is to plan ahead, and therefore I would most likely be selling some portion (or even larger portion) on the way up... not at any point when the BTC price is correcting back down.. that has been my overall approach to anything that I attempt to sell bigger or buy bigger is that I sell on the way up and buy on the way down, even if I do not get anywhere close to the exact tops or the exact bottoms.. I still tend to be happy with my approach because I plan it ahead of time and let the BTC price come to my predetermined price point in which I am already planning to act in one direction or another (to either gain more cash or to accumulate more BTC). Part of my point here is that I believe that there are likely a variety of somewhat prudent and incrementalism practicing strategies that can be employed that cause guys to become somewhat more profitable by allowing the BTC price to come to them and to NOT be gambling too much from almost inevitable BTC price volatility, and guys can make prudent BTC management plans around that even if they are just buying or selling a small portion of the value of their BTC portfolio with various BTC price moves, and hopefully overall the goal would be to stack sats with the passage of time.. even if some of the shaving off of stats while the BTC price goes up (like I mentioned above... something like 1% for every 10% rise or some other variation) would most likely cause a guy to have less BTC at $40k than he had at $8.5k.. but overall way more value and way more options.. .presuming that he had already largely met his BTC accumulation goal in the $8.5k-ish territory... which seems like a somewhat reasonable presumption for any guy that has been in BTC for 4 years, even assuming if he screwed up quite a bit in the first year (talking about you, Wind_FURY... hahahahaha .. but hopefully, not in any kind of personal way or even OP_Sec breaching way or even any goading to cause you defensiveness way... hahahahaha). Title: Re: Globb0 BTC charts Post by: Globb0 on August 01, 2020, 08:46:05 AM Title: Re: Globb0 BTC charts Post by: Tytanowy Janusz on August 01, 2020, 09:51:21 AM We have lift off! I think bitcoin is unstopable at this point. https://i.imgur.com/2X1Ipkn.png This picture looks more bullish than this one: https://i.imgur.com/mwYAVg1.png Just think about all this shorts that was open last 3 months and has to be closed now. Easy 13k before first stop, where first longs bought at 9-10k range will be closing. Title: Re: Globb0 BTC charts Post by: Globb0 on August 04, 2020, 08:23:41 AM Title: Re: Globb0 BTC charts Post by: Globb0 on August 06, 2020, 08:10:40 AM Title: Re: Globb0 BTC charts Post by: Wind_FURY on August 06, 2020, 11:12:37 AM I believe convert our charts from daily to weekly, and zooming it out would give everyone a clearer picture that Bitcoin has always been on a price discovery going up.
Title: Re: Globb0 BTC charts Post by: Globb0 on August 08, 2020, 10:34:53 AM Bit of a ceiling developing over last few days.
Push on or pull back? https://i.imgur.com/PKaeEWz.jpg I believe convert our charts from daily to weekly, and zooming it out would give everyone a clearer picture that Bitcoin has always been on a price discovery going up. As you wish senior..... Weekly candles and zoom out. Engage https://i.imgur.com/Oke2YhU.jpg Title: Re: Globb0 BTC charts Post by: Tytanowy Janusz on August 08, 2020, 05:53:44 PM Push on or pull back? Too soon to push. I think we will stay under 12 000 couple more days.https://i.imgur.com/DaPV4Hi.png Looks interresting. I think that it will fake down, test 11 200 and then moon 13 000+. Title: Re: Globb0 BTC charts Post by: Wind_FURY on August 10, 2020, 08:27:20 AM What's the probability of that prediction? Bitcoin was also thought to have a low probability of surging over $10,000 only 2 weeks ago, with many short-sellers, but here we are. Quote I think we will stay under 12 000 couple more days. There's a small time-difference with "too soon to push"? Title: Re: Globb0 BTC charts Post by: Globb0 on August 10, 2020, 11:14:32 AM Lets take a look at the weather for today. It is hot hot hot. Summer madness out there. The daily chart, the ceiling we have discussed, there is also the fact things look slightly (slightly) less crazy. Eg RSI https://i.imgur.com/8v8Q6At.jpg Title: Re: Globb0 BTC charts Post by: JayJuanGee on August 10, 2020, 03:19:10 PM Lets take a look at the weather for today. It is hot hot hot. Summer madness out there. The daily chart, the ceiling we have discussed, there is also the fact things look slightly (slightly) less crazy. Eg RSI https://i.imgur.com/8v8Q6At.jpg Are you preparing to make any bets in connection with your analysis yet, Globb0, or are you still a wee bit too chicken? https://i.chzbgr.com/original/2079362304/hAC43B5BA/i-no-scared-jus-alil-chicken :D :D :D :D :D Title: Re: Globb0 BTC charts Post by: Globb0 on August 10, 2020, 04:16:19 PM A while back I got a bitcoin as a security token.
You are right I am the pig still feeling exposed to lose my bacon. Let me explain this story, I use for my agile training sessions. There is a chicken and a pig. They are going to open up a café together. The discussion is around the name of the establishment. The chicken wants to call it "Bacon and Eggs" the pig says "I'm not sure I feel so comfortable with this?" I have seen I have made good calls here, that was the point a record not cognitive bias. Still I remain a scared rabbit in the headlights Black hole sun wont you come, wont you come! Title: Re: Globb0 BTC charts Post by: JayJuanGee on August 10, 2020, 05:00:22 PM A while back I got a bitcoin as a security token. You are right I am the pig still feeling exposed to lose my bacon. Let me explain this story, I use for my agile training sessions. There is a chicken and a pig. They are going to open up a café together. The discussion is around the name of the establishment. The chicken wants to call it "Bacon and Eggs" the pig says "I'm not sure I feel so comfortable with this?" I have seen I have made good calls here, that was the point a record not cognitive bias. Still I remain a scared rabbit in the headlights Black hole sun wont you come, wont you come! No problem. Just want to harass you on a regular basis. Of course, you do not have to start to trade, especially if you are not comfortable, but I will still likely regularly make my assertion that there is something a bit more solid about actively participating.. and sure, it is possible that your mere HODLing of bitcoin is sufficient enough "active participation.".. By the way, I personally believe that my ongoing BTC buy and sell orders do sometimes inform me on a more concrete basis about where the BTC price has been and where it might be going. So if I look back and I see that no buy orders or sell orders have been executed in the past month, then I realize we have been stuck in a range for a damned long time, but if I see that BTC orders have been filling mostly in one direction rather than the other, then that might tell me something too. Sometimes, we will see a small amount of BTC price movement, or it might even seem large because the BTC price had not moved a long time, but then I look at my outstanding BTC orders, and if none of them have filled, I will proclaim: "so fucking what!!!!!!" about the BTC price move because it was not enough to fill any of my outstanding orders, so why should I be getting excited about about some seemingly BIG price move that really was not big enough to fill any of my outstanding orders? Title: Re: Globb0 BTC charts Post by: Globb0 on August 13, 2020, 10:50:10 AM Its not following the right lines! Harumph!
The negative vibe felt above came true. RSI dips further, short term gloomy? https://i.imgur.com/SeSpmcQ.jpg Title: Re: Globb0 BTC charts Post by: Globb0 on August 15, 2020, 09:07:49 AM Title: Re: Globb0 BTC charts Post by: Globb0 on August 19, 2020, 10:00:05 AM We have now pushed the resistance up a little bit. That's good.
Is there a channel here? Always until it breaks I suppose https://i.imgur.com/g8WDgrO.jpg Title: Re: Globb0 BTC charts Post by: Tytanowy Janusz on August 20, 2020, 08:44:44 AM We have now pushed the resistance up a little bit. I am concerned that we didn't see further growth after breaking 12,000 resistance. It was so bullish. I think Bart formation (quick dump) even to 10 000 zones is possible now. I hope that my spider sense is wrong now because it detected giant bearish whale. Hope he will be eaten by Megalodon. Title: Re: Globb0 BTC charts Post by: exstasie on August 20, 2020, 07:05:53 PM I am concerned that we didn't see further growth after breaking 12,000 resistance. It was so bullish. I think Bart formation (quick dump) even to 10 000 zones is possible now. It was a frustrating breakout indeed since the daily candle closed above resistance and the upper BB, but we saw a pronounced failure the next day. Ideal conditions for trapping bulls. It's pretty much the exact same thing that happened on June 2nd, which triggered a 1.5 month pullback. https://i.imgur.com/PL84a58.png Stopped out my long and totally screwed up my preferred EW count! :( I reopened a long ~ $11.7K to trade the bounce but I don't intend to hold it for long. There's a good chance this bounce off the daily BB basis (20-SMA) is just a local bull trap, similar to the June 2nd-10th consolidation. Title: Re: Globb0 BTC charts Post by: Globb0 on August 20, 2020, 11:18:19 PM I see what you guys are saying.
More resistance. People selling because they said they will if it gets back over 12? https://i.imgur.com/OdJpOjl.jpg Title: Re: Globb0 BTC charts Post by: Tytanowy Janusz on August 23, 2020, 10:58:38 AM People selling because they said they will if it gets back over 12? I see it more like a whale trapping bull - like exstasie said. Chart shows now strength now. https://i.imgur.com/kY8GLKs.png 1- Bull trap after breaking 12k - dump instead of continuation 2- We just break trend line, test it from the bottom and slowly sinking. In short term it does not look good. I don't expect another 12,4k test anytime soon (1 month of going sideways is optimistic scenario. Pessimistic is testing 9 500-10 000) Title: Re: Globb0 BTC charts Post by: Globb0 on August 23, 2020, 12:59:14 PM I do feel a bit of the gloom and we broke my trend channel line downward.
But also zooming out a bit. We look in better shape. I wont bury my head in the sand but. Also notice the pairs I ringed looks similar? https://i.imgur.com/b6dpQNP.jpg Title: Re: Globb0 BTC charts Post by: Globb0 on August 25, 2020, 05:42:36 PM I still think these 2 patterns look familiar. Look now is a similar follow on candle.
https://i.imgur.com/lKd4nor.jpg Title: Re: Globb0 BTC charts Post by: -CryptoViking- on August 26, 2020, 12:35:05 AM I still think these 2 patterns look familiar. Look now is a similar follow on candle. I think we will go sideways for a week, maybe a bit less and then continue to slowly grow back towards 12k-13k. most likely many people would like this scenario, lots of money to be made on alts, Defi and Uniswap hype. Title: Re: Globb0 BTC charts Post by: Tytanowy Janusz on August 26, 2020, 11:13:20 AM I still think these 2 patterns look familiar. Look now is a similar follow on candle. Agree but bulls are noticeably weaker. Thus whole correction will be deeper. Based on my experience formation will look more like that: https://i.imgur.com/bIu8YXc.png With bottom at 10k and breakout in about 2 weeks from now. Title: Re: Globb0 BTC charts Post by: Globb0 on August 30, 2020, 09:20:54 AM Title: Re: Globb0 BTC charts Post by: Globb0 on September 01, 2020, 02:29:49 PM Looking to be confirmed now.
See we are rising, as usual stuck in our range https://i.imgur.com/P0hZTCR.jpg Title: Re: Globb0 BTC charts Post by: Globb0 on September 03, 2020, 12:42:56 PM We are still above this former resistance. Looking a bit more grim.
RSI right in the gutter direction. Its Defi not a happy day https://i.imgur.com/MNPbujI.jpg Title: Re: Globb0 BTC charts Post by: Tytanowy Janusz on September 04, 2020, 05:40:22 AM I am concerned that we didn't see further growth after breaking 12,000 resistance. It was so bullish. I think Bart formation (quick dump) even to 10 000 zones is possible now. I hope that my spider sense is wrong now because it detected giant bearish whale. Hope he will be eaten by Megalodon. Damn my crystal ball was right again (also called whale detector). https://i.imgur.com/OiDIi6s.png We have bounced from 9900 and I think it is the end of rapid drop. We will stay few days on these levels (unless US market will crash worsening the sentiment on the market - dump on SP500 just started). https://i.imgur.com/isSkTkS.png Title: Re: Globb0 BTC charts Post by: Globb0 on September 05, 2020, 09:13:04 AM Well, still looking a bit negative. RSI staying very low. And briefly cracked the support. :( https://i.imgur.com/Fjpoeaj.jpg Title: Re: Globb0 BTC charts Post by: Globb0 on September 11, 2020, 08:22:21 AM We haven't moved very far at all overall in this week.
There is lots of big support on the chart, doesn't seem to be dipping from here yet. RSI still low, volume Im watching for it to go up a bar or two in order to be more positive https://i.imgur.com/RDqriat.jpg Title: Re: Globb0 BTC charts Post by: cryptomaniac_xxx on September 11, 2020, 08:38:01 AM Probably we are in another consolidation phase, like what we have witnessed in June-July, before taking off to $12k and up. So this is just another week, probably three to four weeks of consolidation and see how it goes. And what's interesting and very similar to June-July is that we never closes a daily candle below the $10k support. So it's possible that we are seeing a repeat pattern and we all know what happens after that, a imminent break out. So if this holds true, then we might see a good bounce around last week September or early October.
Title: Re: Globb0 BTC charts Post by: Tytanowy Janusz on September 14, 2020, 01:29:34 PM Its time for reverse BART FORMATION now? Bitcoin rose beautifully from its knees after the dump from 10,500 to 10,300. Its time for comeback to bull market again? https://i.imgur.com/8KKtlqD.png Title: Re: Globb0 BTC charts Post by: JayJuanGee on September 14, 2020, 03:39:24 PM Its time for reverse BART FORMATION now? Bitcoin rose beautifully from its knees after the dump from 10,500 to 10,300. Its time for comeback to bull market again? https://i.imgur.com/8KKtlqD.png Even though you seem to be employing a bit of a strange (unique) kind of technical analysis (bart-focused), you could be in the ballpark of correct this time around. Perhaps? Title: Re: Globb0 BTC charts Post by: Harambe on September 21, 2020, 01:07:09 PM Hi. I have to give TradingView the five stars and not just because it hands down is the best in its class for charts and analysis, there is an active trader community and a lot of people on there who actually trade and know what they are talking about. You can find there a big detailed list of technical indicators and chart that are just the best in industry. It's just simply the best for chart analysis. I think even the Best Crypto Signals (https://www.quora.com/Which-is-the-best-crypto-signal-group-in-Telegram) providers are using the same charts as well.
Title: Re: Globb0 BTC charts Post by: exstasie on September 21, 2020, 05:08:08 PM Its time for reverse BART FORMATION now? Bitcoin rose beautifully from its knees after the dump from 10,500 to 10,300. Its time for comeback to bull market again? https://i.imgur.com/8KKtlqD.png Seems doubtful now. Today's daily candle (-5%) looks like a confirmation of a lower high. I think BTC is headed back to the lows. The weekly CME gap ~$9,600 and the 0.382 Fib of the March-August rally are still calling. The stock market is also confirming a pronounced technical failure today. For the first time since April, the S&P 500 is holding below the 50-day MA and now the lower daily BB. Unless there is a recovery above 3,300 in the next few hours, this will also be the first structural lower low on the daily chart since the March bottom. https://i.imgur.com/bzoU827.png BTC and stocks both look quite ugly right now. At best, sideways. At worst, significant downside. That's my opinion. Title: Re: Globb0 BTC charts Post by: Tytanowy Janusz on September 21, 2020, 05:23:06 PM Seems doubtful now. Today's daily candle (-5%) looks like a confirmation of a lower high. Yes. I started doubt in my prediction after strong bounce from 11000$. Now its just impossible. BTC and stocks both look quite ugly right now. At best, sideways. At worst, significant downside. That's my opinion. So much blood everywhere. We have covid-19 second wave fear, US election fear. It will all make next 3 month very exciting/frightening. Title: Re: Globb0 BTC charts Post by: Globb0 on September 23, 2020, 07:31:37 AM Title: Re: Globb0 BTC charts Post by: El duderino_ on September 23, 2020, 07:37:32 AM Eeeuhm eeeuhm, planB hopium needed 8)
Title: Re: Globb0 BTC charts Post by: Cryptotourist on September 23, 2020, 09:23:57 AM Title: Re: Globb0 BTC charts Post by: DeathAngel on September 23, 2020, 05:12:02 PM Would be really nice to see some upwards momentum soon. Everything feels like its all gone a bit flat, we should be seeing a bullish breakout in Q4 of 2020 if bitcoin is to follow the trajectory of the last bull run, post halving.
Weve been in the $9,000 - $12,500 range for a significant period now. I would really like to see a breakout soon. Title: Re: Globb0 BTC charts Post by: JayJuanGee on September 23, 2020, 05:40:28 PM Keep your spirits up Globb0. It's not sooooo baaaaaaddddd. ;) The glass remains half full in the case of our lil fiend. For once... cryptotourist might be onto something. Some folks need some slappenings (#nohomo dude) in order to cause their lil mousie to zoom out. :P Go suck a yellow dick.... :D :D :D :D :D :D Would be really nice to see some upwards momentum soon. Everything feels like its all gone a bit flat, we should be seeing a bullish breakout in Q4 of 2020 if bitcoin is to follow the trajectory of the last bull run, post halving. Weve been in the $9,000 - $12,500 range for a significant period now. I would really like to see a breakout soon. I don't know if our current situation is unusual, exactly, and I am not sure whether any kind of upwards breakout is necessary in order to remain bullish about the whole situation, including the fact that in the coming weeks or months we could get some kind of purging of shitcoin/defi/yield farming froth.... I am not suggesting that such purging is necessary, or that down is necessary in any kind of way before up, but surely such purging would not be unreasonable. Furthermore, I doubt that there is any need to stay on any kind of exact 4-year fractal pattern or even to stay exactly on PlanB's BTC price trajectory for those models to be completely valid - and not broken. Seems to me that, we could be 50% or more outside of any of the projected price ranges for a decent amount of time and still be largely within parameters of the BTC price prediction model... what bearwhales going to do? Cause you to believe that the BTC price prediction models might not be true. AmiNOTrite? Additionally, hear a lot of the bullshit talk about BTC price correlation with equities and with gold. What a bunch of nonsense.. but hey, fucktwat bearwhales can cause a lot of people to buy into those kinds of nonsense theories and cause them to believe that there is such correlation.. while many of us longer term HODLers and observers of king daddy already appreciate that there continue to be a lot of ways that weakhands can be and will be convinced to part with their coins. And, let's not forget the s-curve exponential adoption based on metcalfe and networking principles aspects of BTC's price trajectory. In other words, fucktwat bearwhales can manipulate the fuck out of our current BTC situation to keep BTC prices flat or even push them down way beyond any kind of reasonable explanation or expectation, but those same fucktwat bearwhales are likely going to get screwed at some point in which they are on the wrong side of BTC's price momentum.. and surely, I am NOT suggesting that king daddy is currently poised to engage in such face melting punishing of bearwhales who keep playing the down card. Title: Re: Globb0 BTC charts Post by: Cryptotourist on September 23, 2020, 06:32:02 PM Go suck a yellow dick.... :D :D :D :D :D :D JayJuan, I know how much you enjoyed that statement. Hell, I even know why... ;) To your disappointment, I don't suck dicks, strictly or metaphorically speaking. #neverendinghomo Weve been in the $9,000 - $12,500 range for a significant period now. I would really like to see a breakout soon. My two cents: https://i.imgur.com/fU5cNTX.png #metoo Title: Re: Globb0 BTC charts Post by: JayJuanGee on September 23, 2020, 06:48:18 PM Go suck a yellow dick.... :D :D :D :D :D :D JayJuan, I know how much you enjoyed that statement. Hell, I even know why... ;) To your disappointment, I don't suck dicks, strictly or metaphorically speaking. #neverendinghomo Sorry for the ambiguity.. (perhaps, I am). Largely, I was just shouting out that yellow dick statement in a general (yelling at the clouds, sort of - actually, I thought that the dude might have misunderstood that I was directed it at him, but I doubt that he is as sensitive as you, cryptotourist) way, and not even intending to direct such statement at any particular person, including uie pooie. The statement just sounded like a great random addition to my comments, and of course, very recently, I first was introduced to such statement idea from Marcus - (one of your beloved nemeses) - and my getting that statement idea from Marcus had nothing to do with uie pooie, either - even though you continue to behave like a defensively sensitive little twat. #nohomo :P :P :D :D :D :D :D Title: Re: Globb0 BTC charts Post by: Cryptotourist on September 23, 2020, 07:33:20 PM Sorry for the ambiguity.. (perhaps, I am). Largely, I was just shouting out that yellow dick statement in a general (yelling at the clouds, sort of - actually, I thought that the dude might have misunderstood that I was directed it at him, but I doubt that he is as sensitive as you, cryptotourist) way, and not even intending to direct such statement at any particular person, including uie pooie. The statement just sounded like a great random addition to my comments, and of course, very recently, I first was introduced to such statement idea from Marcus - (one of your beloved nemeses) - and my getting that statement idea from Marcus had nothing to do with uie pooie, either - even though you continue to behave like a defensively sensitive little twat. #nohomo :P :P :D :D :D :D :D Thank you Jay. I did ponder for a sec to which direction it was heading, but either way I couldn't let it go - because as we both agree - I'm sensitive. ::) Title: Re: Globb0 BTC charts Post by: JayJuanGee on September 23, 2020, 07:46:04 PM Sorry for the ambiguity.. (perhaps, I am). Largely, I was just shouting out that yellow dick statement in a general (yelling at the clouds, sort of - actually, I thought that the dude might have misunderstood that I was directed it at him, but I doubt that he is as sensitive as you, cryptotourist) way, and not even intending to direct such statement at any particular person, including uie pooie. The statement just sounded like a great random addition to my comments, and of course, very recently, I first was introduced to such statement idea from Marcus - (one of your beloved nemeses) - and my getting that statement idea from Marcus had nothing to do with uie pooie, either - even though you continue to behave like a defensively sensitive little twat. #nohomo :P :P :D :D :D :D :D Thank you Jay. I did ponder for a sec to which direction it was heading, but either way I couldn't let it go - because as we both agree - I'm sensitive. ::) We agree... great...!!!! Sorry to derail your thread with quasi-personal celebrations, Globb0... So regarding the BTC price, in order to attempt to stay somewhat thematic, we can see that within the past hour or so, the lower $10ks are being tested.. namely observing $10,255 price support area had been hit in the past hour-ish... Shitcoins seem to be taking a bit more of a shellacking... and surely, I do NOT proclaim to know causation of BTC price direction beyond appreciation that sometimes she goes up, sometimes down, and other times, sideways. Maybe also, there should not be any problems with buying the dip, so long as you have a 4 year or longer price horizon,.... and of course, we are anticipating likely payoffs in much shorter periods of time, likely less than 2 years.. maybe even less than 18 months... but who knows? Anyone? Title: Re: Globb0 BTC charts Post by: exstasie on September 23, 2020, 08:06:19 PM Seems doubtful now. Today's daily candle (-5%) looks like a confirmation of a lower high. Yes. I started doubt in my prediction after strong bounce from 11000$. Now its just impossible. BTC and stocks both look quite ugly right now. At best, sideways. At worst, significant downside. That's my opinion. So much blood everywhere. We have covid-19 second wave fear, US election fear. It will all make next 3 month very exciting/frightening. What's your take? Is the market pricing in a Trump loss and a subsequent repeal of his pro-business tax policies? I don't have the best read on election prospects right now. If we are in a mid-term bear trend, do you view it as continuation of the post-2017 bear market? Or a temporary pullback in a new bull market? Title: Re: Globb0 BTC charts Post by: Tytanowy Janusz on September 24, 2020, 10:45:12 AM What's your take? Is the market pricing in a Trump loss and a subsequent repeal of his pro-business tax policies? I don't have the best read on election prospects right now. If we are in a mid-term bear trend, do you view it as continuation of the post-2017 bear market? Or a temporary pullback in a new bull market? According to forecast (https://projects.economist.com/us-2020-forecast/president) trump has little to 0 chace to win. https://i.imgur.com/2Qsnbgl.png I think that market won't like it and we might see further dump till elections. Then we will have buy rumor sell facts stage - recover. Than printers will continue to do brrrrr and market will fully recover. Venezuela https://i.imgur.com/3DkXBcA.png Your country may be on fire, but if you do brrr quickly enough stock markets will grow 10x in a year. Title: Re: Globb0 BTC charts Post by: exstasie on September 24, 2020, 05:03:00 PM What's your take? Is the market pricing in a Trump loss and a subsequent repeal of his pro-business tax policies? I don't have the best read on election prospects right now. If we are in a mid-term bear trend, do you view it as continuation of the post-2017 bear market? Or a temporary pullback in a new bull market? According to forecast (https://projects.economist.com/us-2020-forecast/president) trump has little to 0 chace to win. https://i.imgur.com/2Qsnbgl.png I think that market won't like it and we might see further dump till elections. Then we will have buy rumor sell facts stage - recover. Than printers will continue to do brrrrr and market will fully recover. Interesting. Didn't Clinton have similar landslide numbers before being upset in 2016? JPMorgan analysts are leaning the opposite way. They've been telling investors to prepare for a Trump win: https://www.bloomberg.com/news/articles/2020-09-01/jpmorgan-says-prepare-for-rising-chance-trump-wins-second-term I agree though, in the big picture it doesn't really matter. The money printer will eventually go brrrr either way. But each scenario will create its own market narrative and will affect the short term trajectory. Title: Re: Globb0 BTC charts Post by: STT on September 24, 2020, 09:30:38 PM Excessive easy money policy results in zero growth, the stockmarket reflects the dilution of value more then growth or gains. Thats the average result anyway, its happened dozens of times in many countries so theres plenty of data but economically theres no getting a gain from an inaccurate currency. Speculators like the bias to future pricing over fundamental dynamics that hard money might dictate, a more boring economy but often more profitable steady growth then the gambles taken with easy money.
Quote According to forecast trump has little to 0 chace to win. More I hear that the more I worry because its not a straight vote count that decides it so its likely nobody can say perfectly, add in that people just wont report their literal vote. People will begrudgingly vote for 1 candidate that may keep them in a job or industry that might be wound down under the policies of the opposing candidate. I'm willing to bet either party as winning if they stray too far from 50/50, I think thats where the real odds are biased to. Title: Re: Globb0 BTC charts Post by: Tytanowy Janusz on September 25, 2020, 12:18:25 PM Interesting. Didn't Clinton have similar landslide numbers before being upset in 2016? You are right. I forget the fact that Clinton was a favorite and yet she lost. Even rates were similar: https://www.nytimes.com/interactive/2016/upshot/presidential-polls-forecast.html Back to BTC. Nice recover after breaking 10200. Didn't expect that. Title: Re: Globb0 BTC charts Post by: exstasie on September 25, 2020, 07:50:52 PM Interesting. Didn't Clinton have similar landslide numbers before being upset in 2016? You are right. I forget the fact that Clinton was a favorite and yet she lost. Even rates were similar: https://www.nytimes.com/interactive/2016/upshot/presidential-polls-forecast.html Back to BTC. Nice recover after breaking 10200. Didn't expect that. Same, I expected some follow through from bears when the daily lows were undercut 2 days ago. Instead, price just sat there and then sprang right back into the range. Makes me wonder if this is going to be a sideways time-based correction (like this past June-July) rather than a deep price-based correction. Title: Re: Globb0 BTC charts Post by: Tytanowy Janusz on September 26, 2020, 08:37:38 AM Same, I expected some follow through from bears when the daily lows were undercut 2 days ago. Instead, price just sat there and then sprang right back into the range. Makes me wonder if this is going to be a sideways time-based correction (like this past June-July) rather than a deep price-based correction. I'm also very confused. BTC and SP500 are very correlated last times (https://bitcointalk.org/index.php?topic=5233946.msg54057265#msg54057265).I can't imagine SP500 crash without BTC dump. When i look at sp500 chart it seems to me that we are doomed to do something like this or even steeper. https://i.imgur.com/byfJ6l9.png While on BTC i'm a little less bearish. Going for something like this (weekly candles on both): https://i.imgur.com/1FwGJpE.png Do you think its time for BTC to finally show it strength against SP500? Title: Re: Globb0 BTC charts Post by: Globb0 on September 26, 2020, 10:19:29 AM Oh no offence, the chatter is good. Lets dig into stuff.
Here is my latest chart. Is there any hopium in it for you? https://i.imgur.com/dyx8NWM.jpg Title: Re: Globb0 BTC charts Post by: Globb0 on October 02, 2020, 08:18:08 PM It hasn't really escaped that gravity, still the support remains intact
https://i.imgur.com/bVrtgov.jpg Title: Re: Globb0 BTC charts Post by: JL0 on October 02, 2020, 10:03:31 PM It hasn't really escaped that gravity, still the support remains intact What do you think about the CME gap in the $9K area ?https://i.imgur.com/bVrtgov.jpg Title: Re: Globb0 BTC charts Post by: Tytanowy Janusz on October 03, 2020, 09:53:51 AM What do you think about the CME gap in the $9K area ? I think that tail is not steering the dog.CME volume - 5800 cont = 29 000 BTC = $ 300M https://www.cmegroup.com/trading/equity-index/us-index/bitcoin_quotes_globex.html While volume on binance futures and bitmex futures only is equal to $2.3 bil. Total bitcoin volume according to coingecko - $ 19 bil If anyhow CME gaps would steer bitcoin price than it will be the easiest and cheapest way to manipulate BTC price. I doubt, but I am also surprised how many people are repeating this. Maybe some whales are trying to manipulate BTC that way by creating such gaps and then pay shillers (youtubers etc.) to spread it out as much as it is possible and others are repeating? I know that on traditional market it is the case but BTC is not regulated stock with high volume located on market that is not 24/7 open. Title: Re: Globb0 BTC charts Post by: Tytanowy Janusz on October 08, 2020, 03:03:35 PM What you guys thin about it? I was not that bullish for very long time.
https://i.imgur.com/CnlHxcD.png what is the target of this movement according to you? In my opinion, we will stop at 12k, where bitcoin will be put to the final test - ATH or 7k Title: Re: Globb0 BTC charts Post by: Febo on October 08, 2020, 03:38:25 PM A lot of people was very negative in last few days, that is usually a good sign. I dont expect some sharp growth this year and early next, but a small growth and month of stability and then again and again and again and again. Yes can go back for a week or so, but general sentiment should be moderately positive. But what do I know.
Title: Re: Globb0 BTC charts Post by: Globb0 on October 08, 2020, 07:21:10 PM Title: Re: Globb0 BTC charts Post by: dragonvslinux on October 08, 2020, 09:07:06 PM Probably
Title: Re: Globb0 BTC charts Post by: exstasie on October 09, 2020, 08:29:00 AM Hmmm this is a potential flagpole pattern? equal rise again? Sure, I could see a measured move there. A stop run above the $11,200 pivot into resistance near $11,500 (followed by more ranging) would make a lot of sense to me. Something tells me the market will continue ranging below the August highs for quite some time. Months probably. No moon yet! :P Title: Re: Globb0 BTC charts Post by: Globb0 on October 09, 2020, 02:39:42 PM Hmmm this is a potential flagpole pattern? equal rise again? Confirmed, but it is quite zoomed in, I expect some profit taking is possible here. https://i.imgur.com/gdOoxd6.jpg Title: Re: Globb0 BTC charts Post by: El duderino_ on October 12, 2020, 03:18:38 PM Hmmm this is a potential flagpole pattern? equal rise again? Sure, I could see a measured move there. A stop run above the $11,200 pivot into resistance near $11,500 (followed by more ranging) would make a lot of sense to me. Something tells me the market will continue ranging below the August highs for quite some time. Months probably. No moon yet! :P Months...?? Let us moon instead please THX ;D Title: Re: Globb0 BTC charts Post by: JayJuanGee on October 13, 2020, 02:03:47 AM Hmmm this is a potential flagpole pattern? equal rise again? Sure, I could see a measured move there. A stop run above the $11,200 pivot into resistance near $11,500 (followed by more ranging) would make a lot of sense to me. Something tells me the market will continue ranging below the August highs for quite some time. Months probably. No moon yet! :P Months...?? Let us moon instead please THX ;D That b called koreck, to me. No need to wait months, even though don't rule any lil tinglie out, either. Frequently, we get these bear calls - but for some reason the BTC price keeps going up, and hopefully NOT too many newbies get tricked out of scenarios that involve waiting to buy coins at a lower price that might not happen... But hey, their FOMO tears do help to fuel later irrational UPpity. Doesn't really hurt the HODLers - even though I have seen a lot of no coiners, precoiners, fence sitters and waiting for DOWNitiers, failing to act... and pee pare for UP. Title: Re: Globb0 BTC charts Post by: exstasie on October 13, 2020, 05:17:38 AM Something tells me the market will continue ranging below the August highs for quite some time. Months probably. No moon yet! :P Months...?? Let us moon instead please THX ;D That b called koreck, to me. No need to wait months, even though don't rule any lil tinglie out, either. Frequently, we get these bear calls - but for some reason the BTC price keeps going up, and hopefully NOT too many newbies get tricked out of scenarios that involve waiting to buy coins at a lower price that might not happen... Not a bear call, more of a sideways call. As you know, I've been speculating about a long term triangle for many months now. Still looking good: https://bitcointalk.org/index.php?topic=5196072.msg55282472#msg55282472 This wasn't a bear call either: Short term, it looks like we should expect a thrust above the $11,200 resistance. This symmetrical triangle broke to the upside: https://i.imgur.com/WY3nQVl.png Just calling them like I see them. Will reassess if BTC is holding in the $12,000s again. Title: Re: Globb0 BTC charts Post by: Globb0 on October 16, 2020, 10:10:28 AM There is some disquiet in the wall observers thread.
People are running and screaming from red dildos. Thought it was worth a chart check up. Honestly, doesn't look that bad nicely still up in the "forever" range. https://i.imgur.com/ydV8EAM.jpg Title: Re: Globb0 BTC charts Post by: DeathAngel on October 16, 2020, 12:19:56 PM The market usually does what we dont expect so in all honesty I think were due a significant pump before the year closes. None of this is from TA, just some of my thoughts & feelings.
Title: Re: Globb0 BTC charts Post by: Globb0 on October 16, 2020, 12:51:00 PM Yeah I have just sketched out my feeling of each trend lines behavior on the recent visible action, EOY is really very close now, I don't know we will leave this range yet?
https://i.imgur.com/ho1iznU.jpg Perhaps a little profit taking here, then we will see if you are right. True we were previously range bound for a while at a slight lower level. Title: Re: Globb0 BTC charts Post by: exstasie on October 16, 2020, 08:17:41 PM There is some disquiet in the wall observers thread. People are running and screaming from red dildos. Thought it was worth a chart check up. People get antsy when they were expecting moon and then we range for a week instead. :P I'm not particularly bearish. As I've said, I'm leaning more towards sideways then towards a significant price correction. The $9,000s are easily within reach though. I still think that pesky CME gap around $9,600 is going to end up filled. Title: Re: Globb0 BTC charts Post by: El duderino_ on October 17, 2020, 03:38:27 PM There is some disquiet in the wall observers thread. People are running and screaming from red dildos. Thought it was worth a chart check up. People get antsy when they were expecting moon and then we range for a week instead. :P I'm not particularly bearish. As I've said, I'm leaning more towards sideways then towards a significant price correction. The $9,000s are easily within reach though. I still think that pesky CME gap around $9,600 is going to end up filled. Insert Samuel L Jackson meme.... Say CME gap one more time motha****** :P Title: Re: Globb0 BTC charts Post by: LFC_Bitcoin on October 17, 2020, 05:02:48 PM There is some disquiet in the wall observers thread. I thought myself earlier the WO is like a ghost town. Theres just nothing much happening atm, people are probably just being voyeurs. I still think well end the year strongly but for now, just not much worth posting about I guess. Title: Re: Globb0 BTC charts Post by: exstasie on October 17, 2020, 08:11:55 PM People get antsy when they were expecting moon and then we range for a week instead. :P I'm not particularly bearish. As I've said, I'm leaning more towards sideways then towards a significant price correction. The $9,000s are easily within reach though. I still think that pesky CME gap around $9,600 is going to end up filled. Insert Samuel L Jackson meme.... Say CME gap one more time motha****** :P We could always get a sharp correction down to the golden Fib (61.8%). That's in the low $7,000s. Filling that CME gap and stopping in the $9,000s sounds a whole lot better, doesn't it? :P https://i.imgur.com/WhpmYZy.png Title: Re: Globb0 BTC charts Post by: JayJuanGee on October 21, 2020, 02:49:43 PM Something tells me the market will continue ranging below the August highs for quite some time. Months probably. No moon yet! :P Months...?? Let us moon instead please THX ;D That b called koreck, to me. No need to wait months, even though don't rule any lil tinglie out, either. Frequently, we get these bear calls - but for some reason the BTC price keeps going up, and hopefully NOT too many newbies get tricked out of scenarios that involve waiting to buy coins at a lower price that might not happen... Not a bear call, more of a sideways call. As you know, I've been speculating about a long term triangle for many months now. Still looking good: https://bitcointalk.org/index.php?topic=5196072.msg55282472#msg55282472 This wasn't a bear call either: Short term, it looks like we should expect a thrust above the $11,200 resistance. This symmetrical triangle broke to the upside: https://i.imgur.com/WY3nQVl.png Just calling them like I see them. Will reassess if BTC is holding in the $12,000s again. That sideways hedge (just in case not down) didn't age too well... did it? :D :D :D :D :D Hopefully, some innocent peeps did not fail to buy enough BTC... in order to prepare their lil selfies for UPpity.... or sell too many BTC too soon under a believe that they might be able to get more coyns upon down (or alternatively sideways, which seemed NOT to quite happen as expected)... Title: Re: Globb0 BTC charts Post by: exstasie on October 21, 2020, 08:46:00 PM That sideways hedge (just in case not down) didn't age too well... did it? :D :D :D :D :D Hopefully, some innocent peeps did not fail to buy enough BTC... in order to prepare their lil selfies for UPpity.... or sell too many BTC too soon under a believe that they might be able to get more coyns upon down (or alternatively sideways, which seemed NOT to quite happen as expected)... Classic JayJuanGee......when the price goes down, you never give any credit to the analysts on the short side. When the opposite happens, you gloat. I've said for months that the $9,000s might be all we get. And honestly, anyone who is dumb enough to blindly follow an isolated post on a forum deserves to lose their cash, or their coins. Technical analysis only implies probabilities, never anything definitive. We're all long term bulls here. Sometimes you seem to forget that. :) Title: Re: Globb0 BTC charts Post by: -CryptoViking- on October 24, 2020, 07:23:58 PM That sideways hedge (just in case not down) didn't age too well... did it? :D :D :D :D :D Hopefully, some innocent peeps did not fail to buy enough BTC... in order to prepare their lil selfies for UPpity.... or sell too many BTC too soon under a believe that they might be able to get more coyns upon down (or alternatively sideways, which seemed NOT to quite happen as expected)... Classic JayJuanGee......when the price goes down, you never give any credit to the analysts on the short side. When the opposite happens, you gloat. I've said for months that the $9,000s might be all we get. And honestly, anyone who is dumb enough to blindly follow an isolated post on a forum deserves to lose their cash, or their coins. Technical analysis only implies probabilities, never anything definitive. We're all long term bulls here. Sometimes you seem to forget that. :) That's only a good sportsmanship haha, you have to gloat a bit here and there, even if you are not fair with it sometimes ;D We all do it :D After all I'm happy whenever @JayJuanGee can gloat, means BTC is going up, so good for all of us! ;D ;D Title: Re: Globb0 BTC charts Post by: JayJuanGee on October 27, 2020, 03:44:57 AM That sideways hedge (just in case not down) didn't age too well... did it? :D :D :D :D :D Hopefully, some innocent peeps did not fail to buy enough BTC... in order to prepare their lil selfies for UPpity.... or sell too many BTC too soon under a believe that they might be able to get more coyns upon down (or alternatively sideways, which seemed NOT to quite happen as expected)... Classic JayJuanGee......when the price goes down, you never give any credit to the analysts on the short side. When the opposite happens, you gloat. I don't know about that. Sure, I am a bit more averse to down predictions than UP predictions, and I am a bit hostile towards placing too high of probabilities on any calls, either direction.. so there is that angle too... I think that I am more than fair to attempting to follow your analysis and even to give some benefit of the doubt along the way, too. Furthermore, I believe that largely I tend to give valid reasons for my ongoing posts on the topic, including my giving you push back about some of your bearish tendencies... which is that some no coiners and/or fence sitters are persuaded by such nonsense in that they might fail to adequately prepare for UPpity because they are too busy trying to get a better BTC price, that may well not end up happening. So, this is not about uie pooie, exstasie, but instead about peeps that might give more credit to your predictions than they deserve... when they are likely to be way the hell safer to make sure that they are adequately prepared for UPpity before they start trying to time the market with hopes of a few more percentages down, here and there along the way. I've said for months that the $9,000s might be all we get. And honestly, anyone who is dumb enough to blindly follow an isolated post on a forum deserves to lose their cash, or their coins. Technical analysis only implies probabilities, never anything definitive. We agree on that part. We're all long term bulls here. Sometimes you seem to forget that. :) Some supposed long term bulls can be quite full of shit, sometimes..... .. with the "I'm long-term bullish but short-term bearish," bullshit. [edited out] That's only a good sportsmanship haha, you have to gloat a bit here and there, even if you are not fair with it sometimes ;D We all do it :D After all I'm happy whenever @JayJuanGee can gloat, means BTC is going up, so good for all of us! ;D ;D Sure, there is that angle, as well. Many of us invest into bitcoin in order to get excited when it goes up in price. NOT sure why anyone should not be willing to engage in some celebrations in that UPpity direction, when it happens... I am surely NOT the kind of person who takes UPpity for granted, but I sure experience a certain amount of pleasures (and tinglies) from witnessing some bears, or sideways/down betters getting reckt along our way UPpity. That brings me some satisfaction to witness bears, fence-sitters, bitcoin naysayers, alt coin pumpeners and no coiners running after the train after they have gotten reckt from failing and refusing to adequately pee pare their lil selfies for UPpity... (of course, I don't get those kinds of gloating satisfactions for the more innocent newbie types who get mislead into waiting for down and failing to pee pare for UPpity). Title: Re: Globb0 BTC charts Post by: Globb0 on November 06, 2020, 10:54:59 AM Updated the chart. We are still healthily above the channel we were in, but are there a few warning signs here?
I want to wait and see how the daily closes, right now it would be a potential reverse indicator, shooting star thingy? https://i.imgur.com/r5yhoMu.jpg Alts had a blip of green today, first signs of some money flowing back out from daddy BTC? Title: Re: Globb0 BTC charts Post by: STT on November 06, 2020, 11:57:58 AM Profit taking and the 15k price area is near to a ledge just down from the ATH, probably still a point of hesitation. Also if the election was somehow some incentive for buying or market moves, dollar falling etc then that story is coming to an end with a likely result known. Dollar is within its range which I presume means it can just repeat its game like a game of squash its naturally within a box of movement, BTC has outperformed this ratio anyhow but its relevant.
https://talkimg.com/images/2023/06/12/AcVgC.png Dont know we broke a trend that goes all the way back to ATH but it appeared that way by accident (I was just connecting recent highs not looking that far back initially) and we did just rise a heck of alot. I cut off the lower prices as its not relevant for the moment, most just wonder how far this run goes for. Quote money flowing back out from daddy BTC? Funny this can help the alt coins appreciate.Title: Re: Globb0 BTC charts Post by: Cryptotourist on November 06, 2020, 04:57:02 PM Alts had a blip of green today, first signs of some money flowing back out from daddy BTC? Don't think so, probably just refueling for BTC's next leg up, whilst day traders appreciate the joys of getting rekt. Funny this can help the alt coins appreciate. https://i.imgur.com/VCoOzW8.gif Title: Re: Globb0 BTC charts Post by: exstasie on November 06, 2020, 09:36:02 PM Updated the chart. We are still healthily above the channel we were in, but are there a few warning signs here? I want to wait and see how the daily closes, right now it would be a potential reverse indicator, shooting star thingy? https://i.imgur.com/r5yhoMu.jpg If it prints that way, it's not a shooting star but rather a spinning top doji. That is not necessarily a reversal indicator, it just indicates indecision. If you look over the daily chart the past few months, there are plenty of candles like this that were followed by more upside. Plus, single candle patterns aren't always that reliable. 2 or 3 candle (confirmed) patterns are ideal. After that 10% candle yesterday, I'm anticipating something like late July into August 1st: a short term consolidation and another try at the highs. I suspect yesterday was the biggest fireworks we'll see for a while though. Title: Re: Globb0 BTC charts Post by: Globb0 on November 13, 2020, 09:06:33 PM here is my latest btcchart.
Lots of different resistances and supports. still very comfortably above the old channel https://i.imgur.com/CNgtMvn.jpg Title: Re: Globb0 BTC charts Post by: Globb0 on November 19, 2020, 12:45:39 PM Things are moving fast in just a week.
It is looking like it just stepped up again. These are dailies to silence the noise, retested and confirmed. https://i.imgur.com/mtl0Mgs.jpg Also note the long time with mad high RSI's Title: Re: Globb0 BTC charts Post by: STT on November 19, 2020, 05:29:47 PM I hope you are right, I thought I was about to be hard checked out of the market with like a wild pin on the daily candle down to 16k (https://talkimg.com/images/2023/06/12/Acupz.png) before it resumed upwards without my trade. So far its been good, I dont use RSI I use OBV which tries to adjust better for volume on down days also I think and even though its still very high. Its a relatively stable upwards price for quite a while now, price action is not often this nice to people.
Someone said if it runs like this into Thanksgiving holiday then it will more likely sell properly at this point because the long main market close should be seeing a drop off I guess is their reasoning. If the buying is from funds with a medium term outlook then its different to that. Its different this time would be a red flag for sure lol :P Title: Re: Globb0 BTC charts Post by: Globb0 on November 20, 2020, 08:12:41 PM Thanks Ill have a look into OBV
Here is the hourly chart, its face melting stuff at the moment, I left the retest on there from the bigger daily chart I made. In this scale we are looking nice for another little squirt. But of course now the weekend is here! https://i.imgur.com/HNx0KFI.jpg Title: Re: Globb0 BTC charts Post by: Globb0 on November 27, 2020, 12:54:00 PM Hey folks crappy thanksgiving day in the BTC world :) but had fun and im older now too. :)
I thought a daily chart might be in order lets try to see good case lesser good case lol (bad case might be go though the bottom resistance I suppose https://i.imgur.com/zjAM8Cg.jpg Title: Re: Globb0 BTC charts Post by: Globb0 on December 03, 2020, 04:23:47 PM Here is a chart for today, nobody is dead after the horrible week and thanksgiving drop.
The thing Im most interested in at the moment is what will the volume do. It could take us either way. Still retesting and busting looks good https://i.imgur.com/1IM4UOS.jpg Title: Re: Globb0 BTC charts Post by: Globb0 on December 10, 2020, 10:14:50 PM Just a bit of recoiling this past week.
A refresh of the chart shows us in a channel for now. Not much to report https://i.imgur.com/3ZmJE2n.jpg Title: Re: Globb0 BTC charts Post by: Globb0 on December 25, 2020, 09:30:11 PM No charts for a while. Now with the buzz there are a lot flying around.
So I bring you something different. 1 week long candles! just look at the positivity in this chart. ZOMG almost no reds. There thanks https://i.imgur.com/AoSBoBG.jpg Title: Re: Globb0 BTC charts Post by: Globb0 on January 04, 2021, 04:03:31 PM Here is a new daily candle chart.
The old levels are left way behind and now discounted. RSI was too damn high! its come down a bit now. And looking back a bit we can see it can survive here ok if it wants to. New huge support area! Happy new year and all is well. https://i.imgur.com/13futWK.jpg Title: Re: Globb0 BTC charts Post by: Globb0 on January 08, 2021, 01:23:41 PM Further from my last chart.
The retest was confirmed and now its ripping off. Breaking its own daily resistance for consecutive days. RSI looking red hot though! https://i.imgur.com/SMPePKE.jpg Title: Re: Globb0 BTC charts Post by: Tytanowy Janusz on January 09, 2021, 07:36:37 AM Damn ... i think that we are at a level of bubble that price chart is no longer a correct chart to look at:
https://i.imgur.com/012Rw5C.png Thil bull run looks so extreme. Its first time in my life to surf on such a wave. I don't think that any TA will work here. Pure emotional trading with lambo in front of investors eyes. Thats what drive price now. I think its time to switch charts to google trends :) https://i.imgur.com/wQuP0ma.png And wait for new ATH there. Title: Re: Globb0 BTC charts Post by: exstasie on January 09, 2021, 09:47:16 AM Damn ... i think that we are at a level of bubble that price chart is no longer a correct chart to look at: https://i.imgur.com/012Rw5C.png Turn on log. It looks at least slightly more reasonable. :P Looking at the curve of the weekly candlesticks, it's definitely getting 2017-like, but still more reminiscent of early 2017 to me. Lots of 5-10% daily candles. In the later blow-off top stage, we should be seeing 20-25% candles. I don't think that any TA will work here. Pure emotional trading with lambo in front of investors eyes. Yep, the only useful TA right now is when/where to buy the dip, if it happens. There's no point calling tops or anything like that. There's no lid on this market. Title: Re: Globb0 BTC charts Post by: STT on January 09, 2021, 10:45:38 AM I think its time to switch charts to google trends :) https://talkimg.com/images/2023/06/12/A1nvc.png Not a bad theory, someone mentioned this to me months ago and said this cant be the top as google shows no common interest from the public peaking yet and I thought well that doesnt mean they will but I guess I know what he meant now as its certainly making waves and I see BTC on the front page of international press. It did see this in previous booms, '17 and 2013 they had a long section on the news close to the end of the year. Title: Re: Globb0 BTC charts Post by: JayJuanGee on January 09, 2021, 06:03:12 PM Damn ... i think that we are at a level of bubble that price chart is no longer a correct chart to look at: https://i.imgur.com/012Rw5C.png Turn on log. It looks at least slightly more reasonable. :P Looking at the curve of the weekly candlesticks, it's definitely getting 2017-like, but still more reminiscent of early 2017 to me. Lots of 5-10% daily candles. In the later blow-off top stage, we should be seeing 20-25% candles. I don't think that any TA will work here. Pure emotional trading with lambo in front of investors eyes. Yep, the only useful TA right now is when/where to buy the dip, if it happens. There's no point calling tops or anything like that. There's no lid on this market. Hey, even though I have a tendency to downplay how much certainty to place in certain kinds of charts in regards to at what point in time this particular asset class (bitcoin) might be due for a correction, to me, this seems to be a kind of demonstration for the need to make sure that the idea of immature asset class, world-paradigm changing asset class and exponential s-curve adoption should have been being considered in terms of looking at any charts. Sure, at some point a correction is going to come.. whether it is "significant" or not or whether it brings BTC prices back down to certain previous resistance levels remains another story... but sure this BTC price performance does not really seem to be out of line with the early rather than late 2017 pattern.. even if we did seem to have a few more cooling off periods in early 2017 - and suppose that the longer that this current UPpity continues to go on, maybe the more we will start to need to consider this to have higher odds of playing out like a 2013 kind of double peak pattern rather than a 2017 single peak pattern... which you, exstasie, have acknowledged such a potential way of this period playing out this time around... because many of us likely realize that there are limits, its just a matter of attempting to figure out when there is no longer enough buying support to continue to push the price UP and thereafter to cause a bit of a trend in the other direction that can be taken advantage of for anyone who is ready, willing and able to thereafter push the price down once it starts to go in that direction. Title: Re: Globb0 BTC charts Post by: Globb0 on January 18, 2021, 10:35:28 AM Here is a chart refresh. We bounced in the resistance and support. Seen before a bit lower level. a bit of chopping along.
Superhot RSI is cooled a bit. Leftfield: what would "they" want us to think. Could be a dip to come? https://i.imgur.com/up2eV2H.jpg Title: Re: Globb0 BTC charts Post by: Globb0 on January 22, 2021, 10:10:59 AM As we saw there was a bounce and a bounce.
Now we havent broken this support yet. https://i.imgur.com/J0qEANV.jpg Title: Re: Globb0 BTC charts Post by: Globb0 on February 04, 2021, 11:49:13 AM Looking at something a bit different to the usual support resistance.
Is this a cup pattern forming? there is a nice looking bowl shape forming. Not much volume action for a few days. https://i.imgur.com/O2PJKG8.jpg Title: Re: Globb0 BTC charts Post by: Globb0 on June 21, 2021, 02:38:38 PM Hello my pretties. Bit of a chart refresh for you.
Well down into the support now, This chart is a long term view at 1d candles. As it gets to the bottom of the yellow zone it can spring back where the price becomes attractive to someone. The danger I drew on is closing under the yellow. That's a bad sign. Oh yeah I think a lot of people are hanging on a reversal signal. Then we might se a sudden shift. Heard stuff. https://i.imgur.com/z3BioA6.jpg Title: Re: Globb0 BTC charts Post by: Globb0 on June 21, 2021, 03:08:13 PM Here is a look at a H+S that has been suggested. (red)
I offer the green version, more weight to a reversal signal somewhere here I think. https://i.imgur.com/I2oYxTW.jpg Title: Re: Globb0 BTC charts Post by: JayJuanGee on June 21, 2021, 05:51:12 PM Well..... thanks for gracing us back with your presence and your squiggly lines, Globb0.
Have you personally been doing anything with your own BTC portfolio management in the last 4 months or so? You likely know what I have been doing, no? Sold up to the $60k and then started buying back in the mid $50ks all the way back down to these here lower $30k parts and sold a little and bought a little more in the intermittent ups and downs... so yeah, the BIG question in recent times (and perhaps especially in the past 12-24 hours) does seem to be whether the BTC price might be able to erode enough of the buy support to cause the BTC price to cascade down even further. How many times have we been visiting these lower $30ks? This might be 3 or 4 times now, and personally, I am not going to proclaim any kind of solidness in terms of believing that buy support in the lower $30ks is going to be broken.. because remember $6k in 2018.. Jesus.. we had 6 times or more revisiting $6k before it ended up breaking.. but that was a bit of a different set-up too in terms of both the extent of the blow off top up to $19,666 and also the fact that when we were bouncing around in terms of testing support at $6k we were over 5x above the previous ATH of $1,163. In this case, we are only a little more than 50% above the previous ATH of $19,666 - and surely, none of the surrounding factors matter a whole hell of a lot in terms of saying that our current support in the lower $30ks will break or not, even if it could lend some considerations regarding how likely it is that our current support will end up breaking.. or when, if at all. Title: Re: Globb0 BTC charts Post by: Globb0 on July 15, 2021, 06:59:04 PM Still a way to go before breaking support. Expecting a tail down but it wont breach. hopefully. https://i.imgur.com/EEufzoU.jpg |
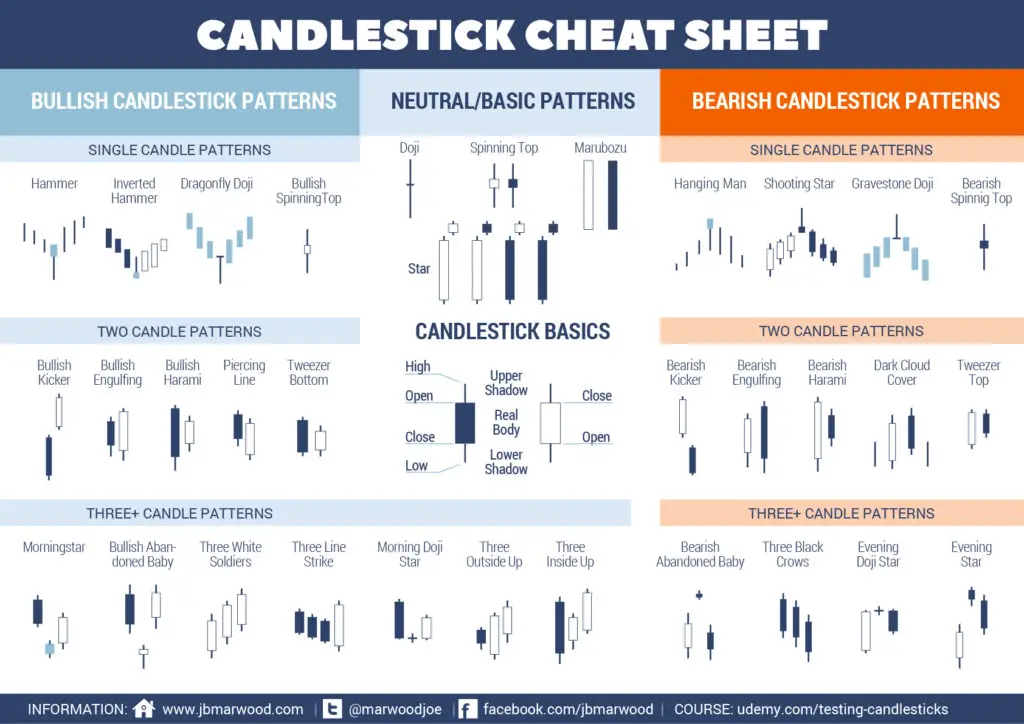