dragonvslinux (OP)
Legendary

 Offline Offline
Activity: 1666
Merit: 2204
Crypto Swap Exchange

|
 |
October 23, 2019, 02:30:51 PM |
|
Part 9 Updated now that the TD Sequential 9 is in play. For anyone who didn't understand the relevance of a TD 9, I hope you do now. Will update parts 1-8 tomorrow once BLX has updated, to see how relevant they are still looking now that there has been some price action. Part 9: TD Sequential 9 Next Week To Decide Direction?Comment: TD Sequential 9 now glowing on Weekly chart as expected. Waiting to see how the Week will close. 
|
|
|
|
|
|
|
|
|
The forum was founded in 2009 by Satoshi and Sirius. It replaced a
SourceForge forum.
|
|
|
Advertised sites are not endorsed by the Bitcoin Forum. They may be unsafe, untrustworthy, or illegal in your jurisdiction.
|
dragonvslinux (OP)
Legendary
Offline
Activity: 1666
Merit: 2204
Crypto Swap Exchange
|
|
October 24, 2019, 05:21:23 PM
Last edit: September 10, 2023, 02:48:19 PM by dragonvslinux |
|
Part 1-8 now updated with recent price action, analysis changed of certain parts from similar to relevant and visa versa. Now included whether the analysis is short, neutral or long, as well as active, completed or inactive, as shown below. Currently all of these parts still appear relevant, with most of them still similar. 2:1 ratio of short to neutral calls, no longs. Conclusion: Bitcoin is still repeating price history, nothing has dramatically changed. Don't forget to click the quote for larger images. Analysis & Status Similar (6) | Relevant (3) | Irrelevant (0) Short (6) | Neutral (3) | Long (0) Active (7) | Completed (2) | Inactive (0) Updated: October 24th 2019
Part 1: Descending Triangle Looking Similar To 2018 (Short - Active)Comment: Broke down too soon for confirmation of similarity. Could still follow same pattern but less likely 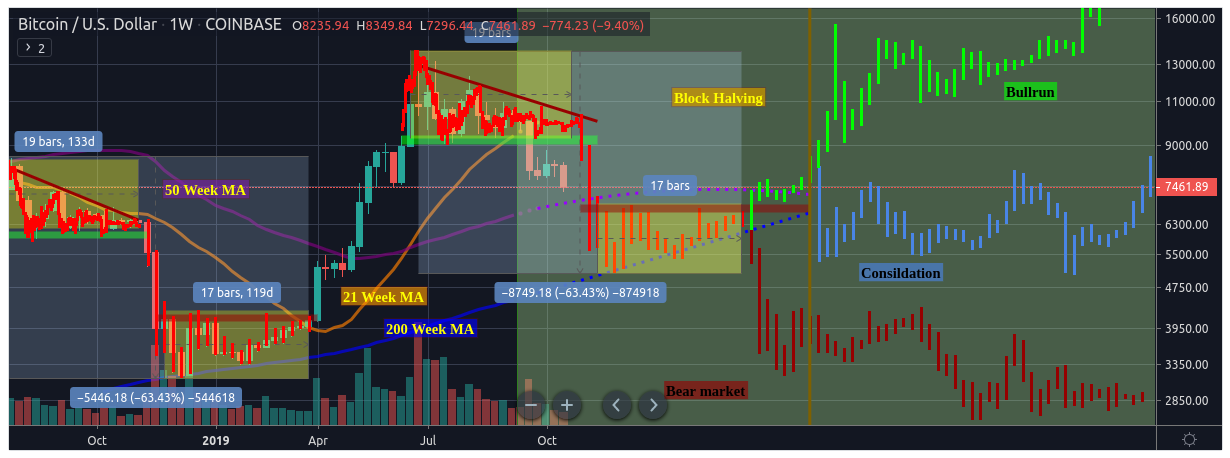 Part 2: Measuring The Move of the Descending Triangle Breakdown (Short - Active)Comment: Broke down as expected and following similar enough pattern, still awaiting for target. 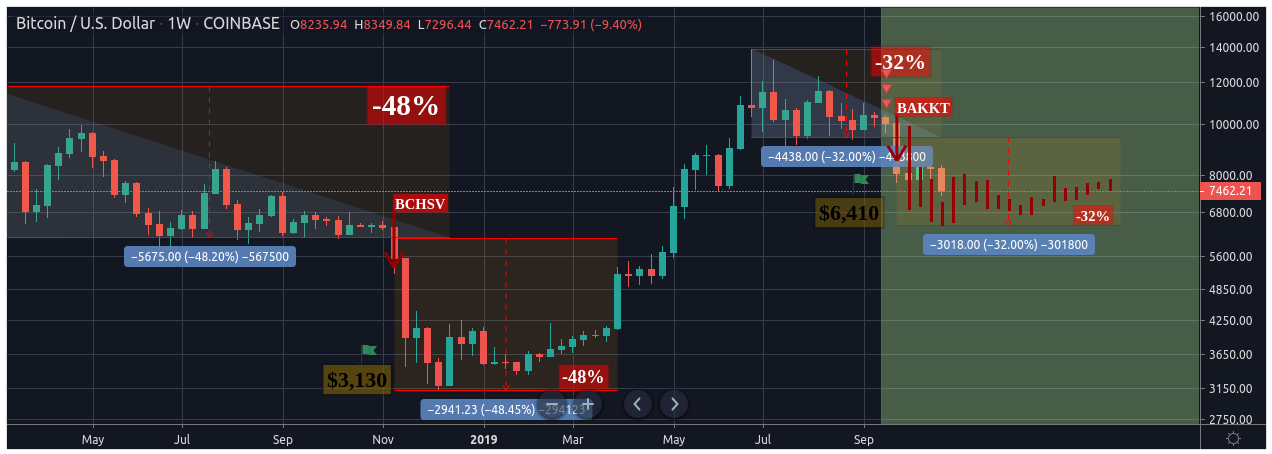 Part 3: A repeat of 2014? Worst Case Scenario A $2,500 Low (Short - Active)Comment: Broke down too fast and too far for similarity of a "slow grind" reversal, though notably fallen to a similar breakdown level. 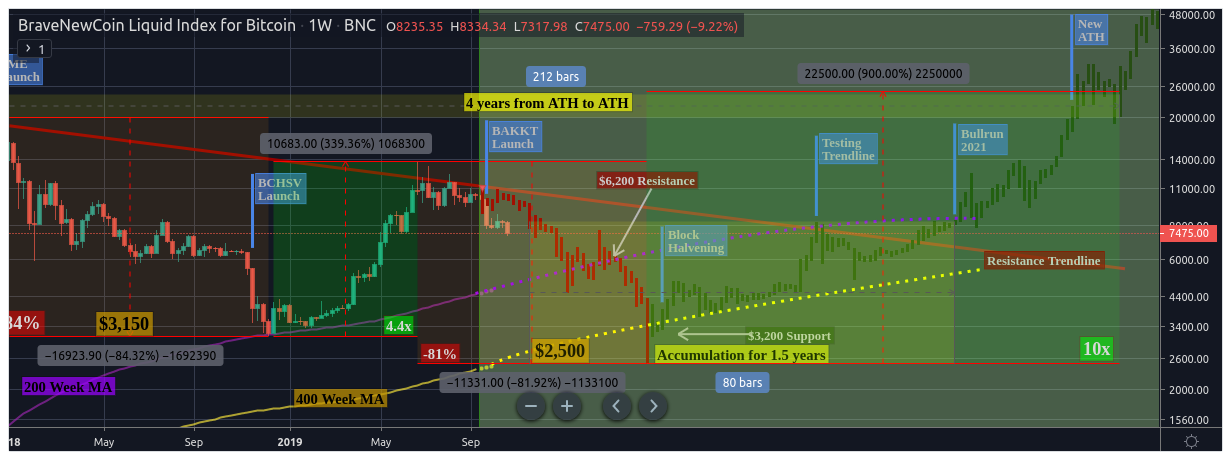 Part 4: If Bitcoin Repeats History? Extrapolating 2012 Breakdown (Short - Active)Comment: Broke down as expected, following similar enough pattern, waiting to see if range is formed. 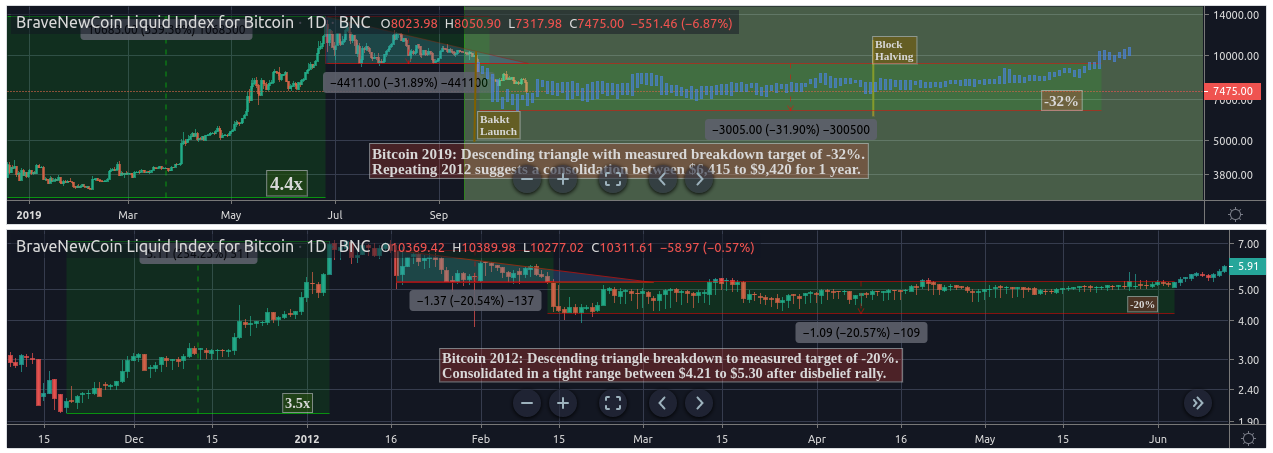 Part 5: If 2017 Descending Triangle Repeats? Best Case Scenario (Short - Active)Comment: Broke too soon to confirm Daily descending triangle target but now following similar pattern with a bear flag prior to continued breakdown. 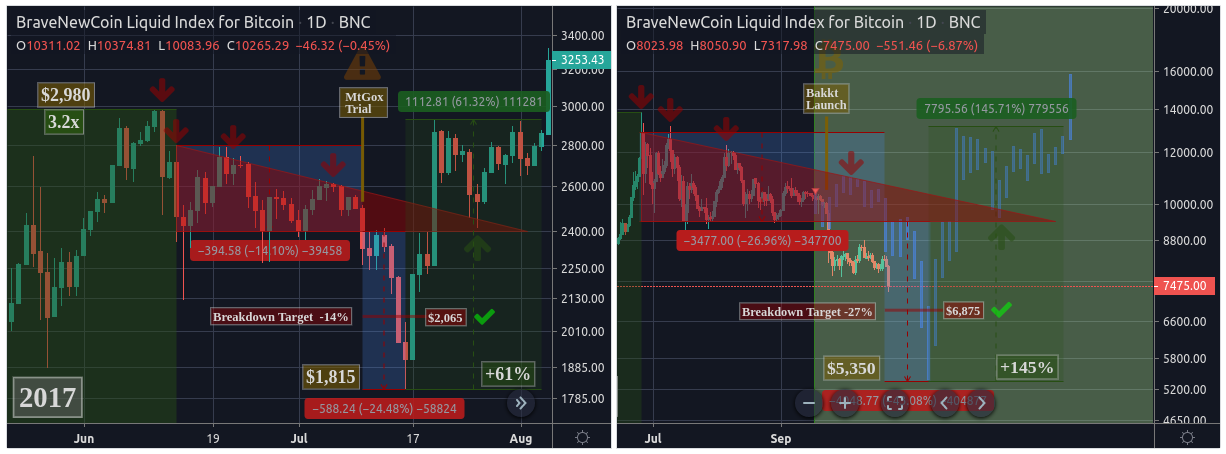 Part 6: If Bitcoin Repeats History? Monthly TD Sequential Red 1 (Neutral - Active)Comment: Red 2 following similar 2014 breakdown structure so far, waiting to see if 20 Month MA will prop up the price for further confirmation. 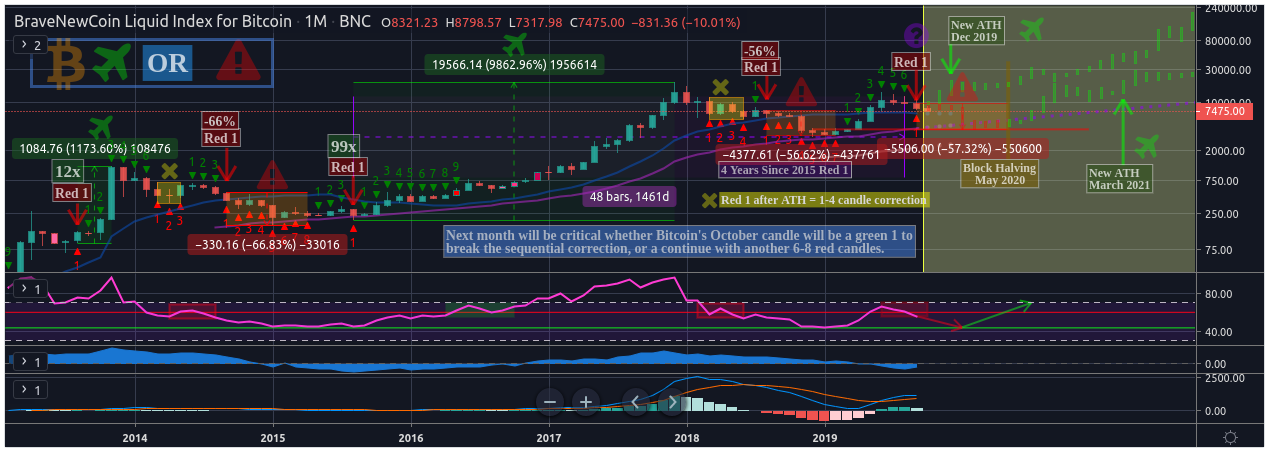 Part 7: Another Bearish Bitcoin Indicator: 200 EMA & MA Bearcross (Short - Completed)Comment: Price broke down after further rejection followed by the bearish crossover as the nail in the coffin, pattern completed. 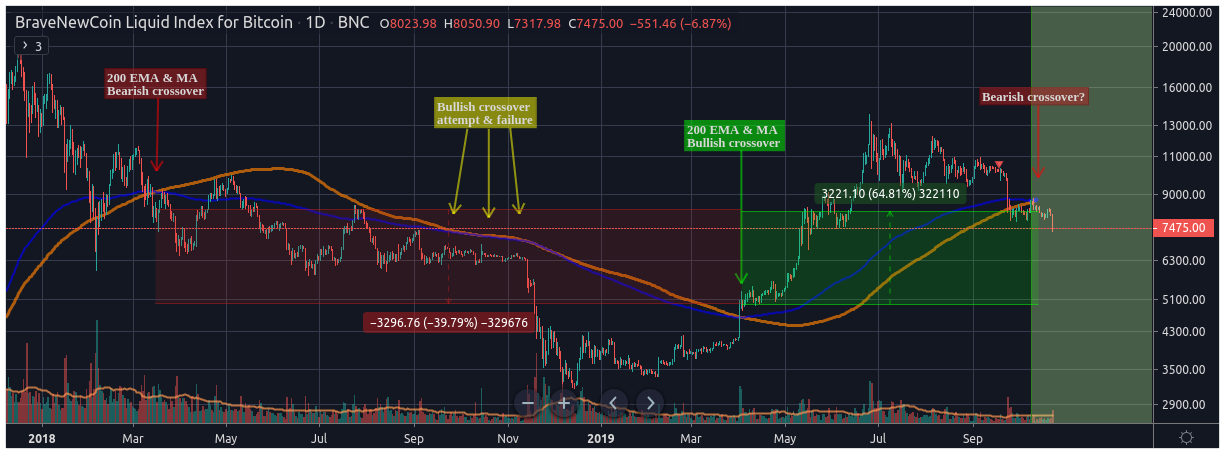 Part 8: Bitcoin's Full Moon Reversal 6 Month Pattern (Neutral - Completed)Comment: Price notably continued to move downwards after making a final swing high during the Harvest Moon, pattern completed. 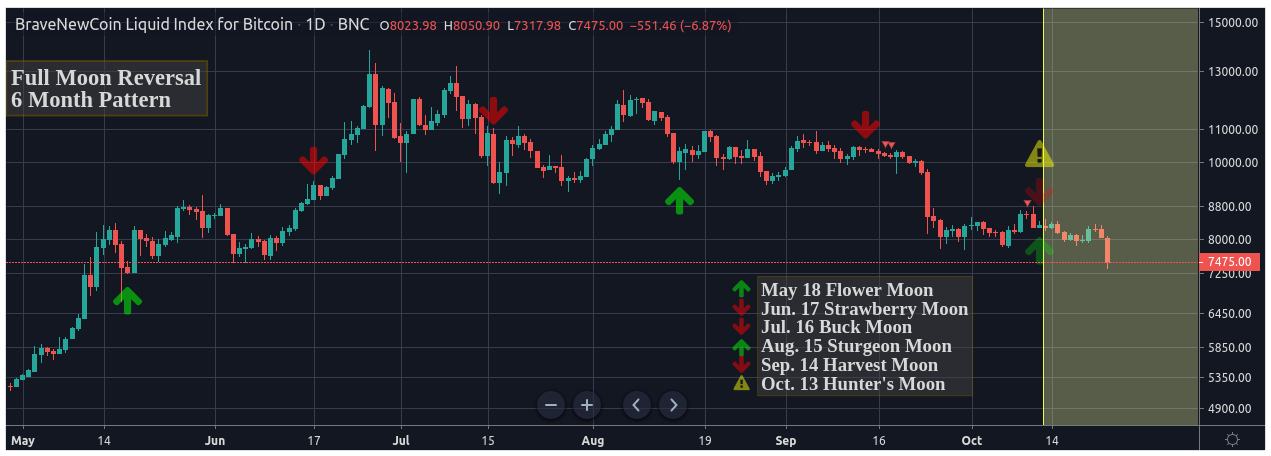 Updated: October 23rd 2019 Part 9: TD Sequential 9 Next Week To Decide Direction? (Neutral - Active)Comment: TD Sequential 9 now in play, waiting to see if "full blown" wedge breakdown (B) will occur, or (C) pattern will continue. |
|
|
|
dragonvslinux (OP)
Legendary
Offline
Activity: 1666
Merit: 2204
Crypto Swap Exchange
|
|
October 27, 2019, 03:29:56 PM
Last edit: September 10, 2023, 02:46:26 PM by dragonvslinux |
|
Part 10: The Final Part.A short call at $9,500 above the 200 Day MA, have I gone mad? This part was an attempt to look at the bullish case of rallying above the 50 & 200 Day bear cross, but unfortunately we've seen this twice before and it only once gave us the bullish case we were hoping for, the other three cases were bearish. Here is therefore the outlook based on extrapolation of past price history and basic probability (nothing else) of what the bear cross implies, if Bitcoin repeats history. It's time to talk about the bear cross that was confirmed yesterday, the 50 Day MA crossing the 200 Day MA. 3 out of 4 of Bitcoin's bear crosses have been bearish long-term indicating a further 50% drop in price (2012, 2014 and 2018). In the shorter-term, Bitcoin also twice rallied by 50% in two of these occasions (2014 and 2015) before continuing higher or falling back down. Only 1 out of 4 of these cases it came at the end of the bear market, in 2015. Here are the current statistics and visual representation of the bear crosses: 2012, 2014, 2015 and 2018.Extrapolating these bear crosses to the current bear cross suggests the following:- 75% probability of reaching the descending triangle breakdown target of $6,410
- 75% probability of dropping a further 50% before the block halving
- 50% probability of rallying further to $12,000 by the end of October
- 50% probability of double bottom at $3,200, specifically in July 2020
- 25% probability of breaking above $9,410 and never coming back down.
Part 1-9 will otherwise be udpated at the end of the week when BLX is updated. Many parts are still relevant, some less some more, some completed, others inactive etc.
|
|
|
|
figmentofmyass
Legendary
Offline
Activity: 1652
Merit: 1483
|
|
October 27, 2019, 06:30:48 PM |
|
Part 10: The Final Part.
A short call at $9,500 above the 200 Day MA, have I gone mad? This part was an attempt to look at the bullish case of rallying above the 50 & 200 Day bear cross, but unfortunately we've seen this twice before and it only once gave us the bullish case we were hoping for, the other three cases were bearish. context is everything. the death crosses that actually followed through occurred after bubble pops, in april 2014 and april 2018. these aren't representative of our current market position. the failed death cross in september 2015 seems like a much more accurate comparison---the first pullback after a long term bullish reversal/trend change. |
|
|
|
dragonvslinux (OP)
Legendary
Offline
Activity: 1666
Merit: 2204
Crypto Swap Exchange
|
|
October 27, 2019, 06:34:58 PM |
|
Part 10: The Final Part.
A short call at $9,500 above the 200 Day MA, have I gone mad? This part was an attempt to look at the bullish case of rallying above the 50 & 200 Day bear cross, but unfortunately we've seen this twice before and it only once gave us the bullish case we were hoping for, the other three cases were bearish. context is everything. the death crosses that actually followed through occurred after bubble pops, in april 2014 and april 2018. these aren't representative of our current market position. the failed death cross in september 2015 seems like a much more accurate comparison---the first pullback after a reversal/trend change. I'd like to believe that, but this death cross came at the end of the bull market (and relative highs), not the end (or lows) of the bear market (like in 2015). But obviously this is subjective to the time frame you are looking at, etc, etc. I think it's most likely this death cross will be unique in it's own way too. |
|
|
|
figmentofmyass
Legendary
Offline
Activity: 1652
Merit: 1483
|
|
October 27, 2019, 08:31:35 PM |
|
context is everything. the death crosses that actually followed through occurred after bubble pops, in april 2014 and april 2018. these aren't representative of our current market position.
the failed death cross in september 2015 seems like a much more accurate comparison---the first pullback after a reversal/trend change.
I'd like to believe that, but this death cross came at the end of the bull market (and relative highs), not the end (or lows) of the bear market (like in 2015). But obviously this is subjective to the time frame you are looking at, etc, etc. yes, time frame is crucial to this assessment. pull up a monthly chart---we need some perspective. there is no comparison between 2013, 2017, and......now. the death crosses from april 2014 and april 2018 came after multi-year bull markets that ended with exponential gains and parabolic bubbles. the current situation is very different. june-october = the first pullback of this bull market on the monthly time frame. you think it's the end?! this correction (and where we are in the market cycle) looks much more like fall 2012 or early 2016---in the early stages a multi-year bull market. in that sense, the late 2015 failed death cross is a much better comparison IMO. |
|
|
|
dragonvslinux (OP)
Legendary
Offline
Activity: 1666
Merit: 2204
Crypto Swap Exchange
|
|
October 27, 2019, 08:50:12 PM
Last edit: September 10, 2023, 02:46:07 PM by dragonvslinux |
|
context is everything. the death crosses that actually followed through occurred after bubble pops, in april 2014 and april 2018. these aren't representative of our current market position.
the failed death cross in september 2015 seems like a much more accurate comparison---the first pullback after a reversal/trend change.
I'd like to believe that, but this death cross came at the end of the bull market (and relative highs), not the end (or lows) of the bear market (like in 2015). But obviously this is subjective to the time frame you are looking at, etc, etc. yes, time frame is crucial to this assessment. pull up a monthly chart---we need some perspective. Here it is already, published last month. The Red 1 monthly candle suggested it was time to make a big decision, either much more downside or the month being more of an "anomaly" and last dip before the bull-run. So far the price has followed the bullish path by flipping to a Green 1, that I imagine at this rate will close a Green 1 too. This is bullish, I agree. Hence the neutral outlook on the monthly chart, despite the bearish scenarios that could have (but didn't) happen. Once the month closes, I'll consider doing another piece of TA, but until then, I don't see the relevance as the intra-week movements are just noise. there is no comparison between 2013, 2017, and......now. the death crosses from april 2014 and april 2018 came after multi-year bull markets that ended with exponential gains and parabolic bubbles. the current situation is very different. june-october = the first pullback of this bull market on the monthly time frame. you think it's the end?!
this correction (and where we are in the market cycle) looks much more like fall 2012 or early 2016---in the early stages a multi-year bull market. in that sense, the late 2015 failed death cross is a much better comparison IMO. I'm definiately not denying this time it's very different, hence being able to draw a series of different scenarios that can ensue. You're right I haven't done enough comparisons with 2013 and 2017, due to lack of similarities I've been able to find. If you have any suggestions I'm all ears by the way, I could do with the inspiration. Although I feel this is similar to how people suggested I compared "bullish" descending triangles instead of just "bearish" ones, until they realised that generally speaking they don't exist for BTC. However think Part 5 is a fair comparison of what could occur during a bull market, and is playing out, regarding a "quick dip" scenario. FYI I'm still hodling long, despite the bearish analysis. I even bought the dip at $7800 and $7500, and a bit of the pump at $9800, so probably not as "bearish" as you may think. |
|
|
|
dragonvslinux (OP)
Legendary
Offline
Activity: 1666
Merit: 2204
Crypto Swap Exchange
|
|
October 28, 2019, 12:16:52 PM
Last edit: September 10, 2023, 02:45:55 PM by dragonvslinux |
|
End up week updates for all active patterns.Main updates include 2012 descending triangle no longerappearing relevant (now labeled as inactive). 2014 slow grind reversal now looking more relevant again so now considered similar (sorry folks). Part 6 & 9 (TD based analysis) are playing out nicely so worth looking at again. Analysis & Status Similar (8] | Relevant (1) | Irrelevant (1) Short (7) | Neutral (3) | Long (0) Active (7) | Completed (2) | Inactive (1) Updated: October 28th 2019
Part 1: Descending Triangle Looking Similar To 2018 (Short - Active)Comment: Broke down too soon for confirmation of similarity. Could still follow same pattern but less likely 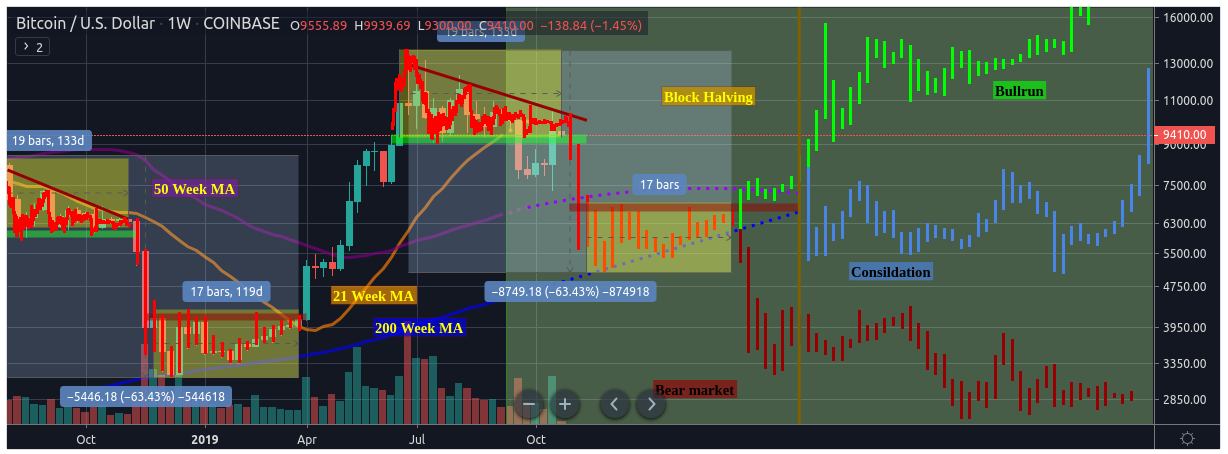 Part 2: Measuring The Move of the Descending Triangle Breakdown (Short - Active)Comment: Broke down as expected with a delayed but eventual re-test of triangle resistance, still awaiting for target. 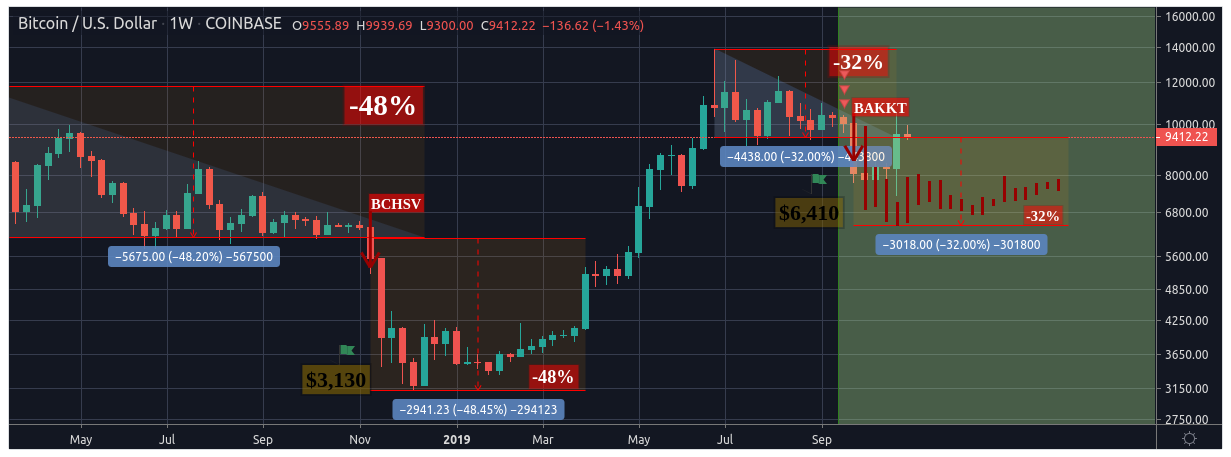 Part 3: A repeat of 2014? Worst Case Scenario A $2,500 Low (Short - Active)Comment: Price is returning to the path of a "slow grind" reversal as well as notably fallen to a similar breakdown level. 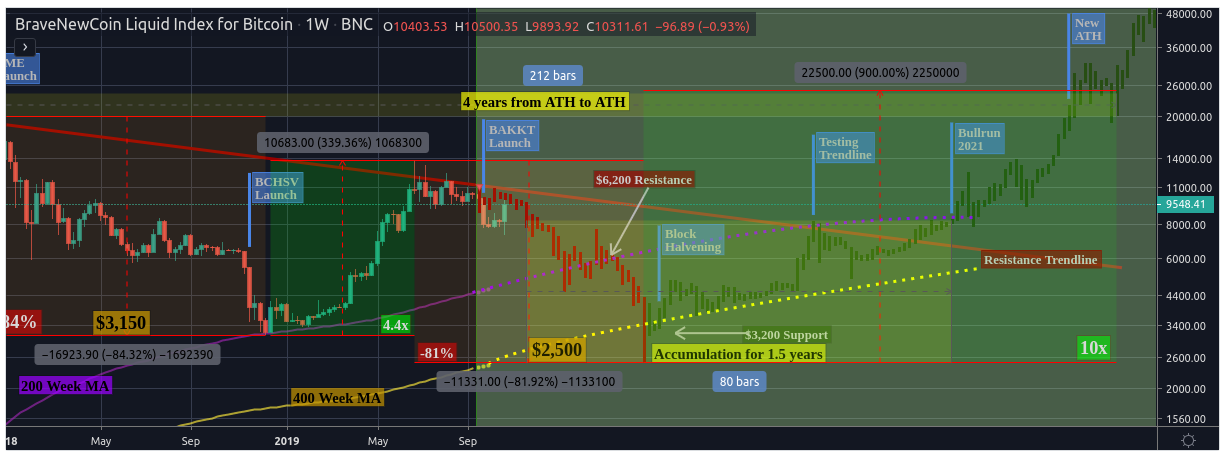 Part 4: If Bitcoin Repeats History? Extrapolating 2012 Breakdown (Short - Inactive)Comment: Broke down as expected but by re-testing triangle resistance it has invalidated the continued sell off into a range. 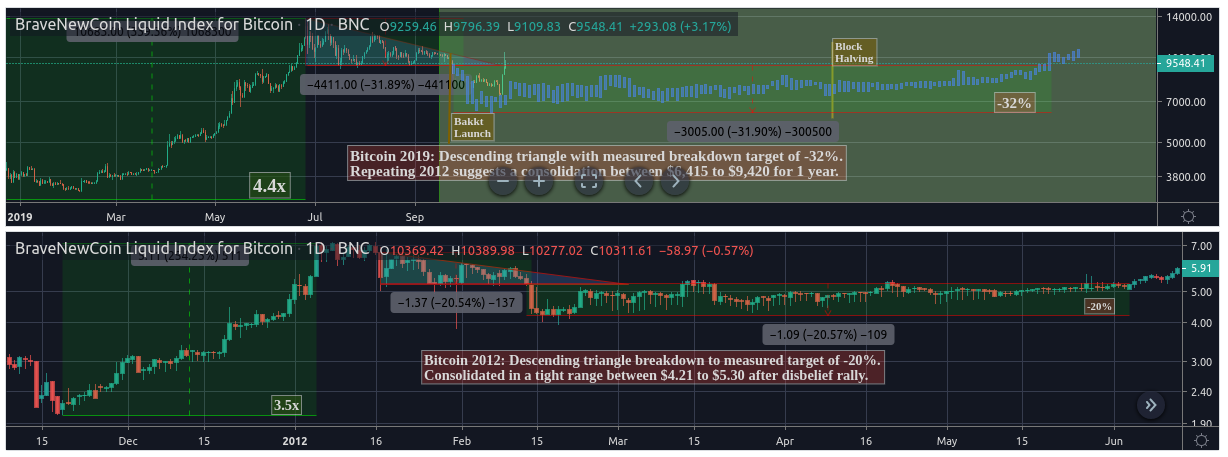 Part 5: If 2017 Descending Triangle Repeats? Best Case Scenario (Short - Active)Comment: Broke too soon to confirm Daily descending triangle target. The re-test of triangle resistance was late, but now returning to similar breakdown pattern. 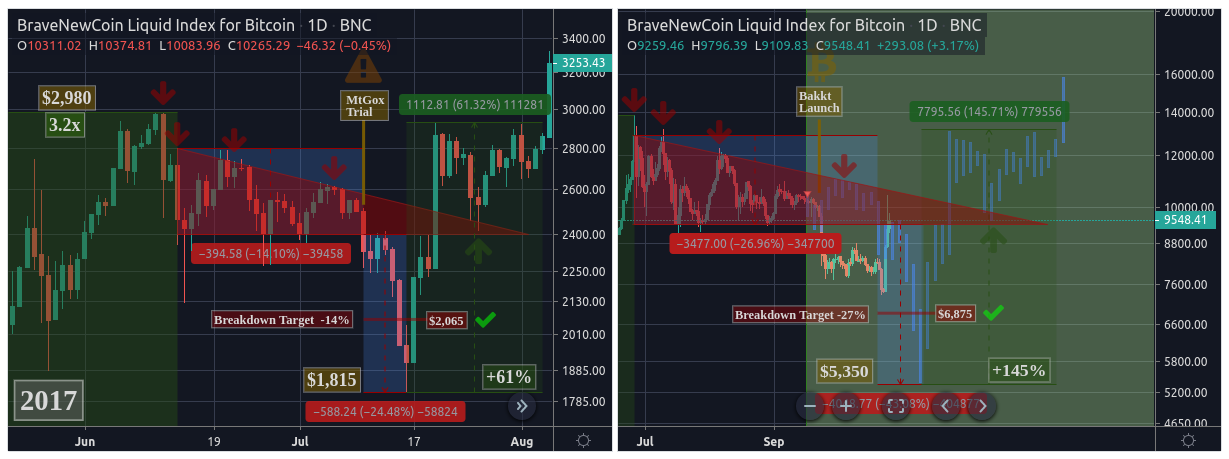 Part 6: If Bitcoin Repeats History? Monthly TD Sequential Red 1 (Neutral - Active)Comment: The engulfing green monthly candle (yet to close) looks to be taking the bullish path of the continued bull-run, despite still being a Red 2. 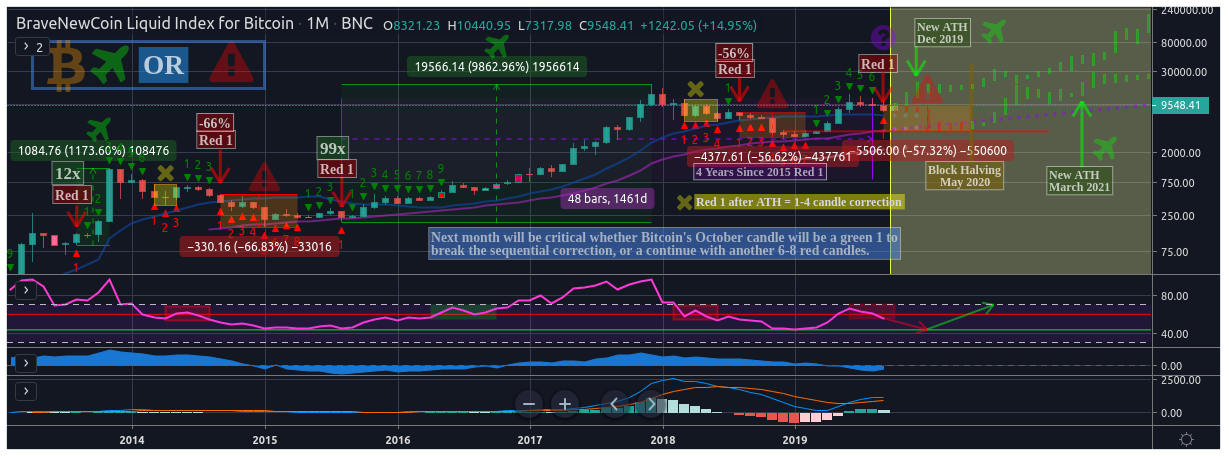 Part 9: TD Sequential 9 Next Week To Decide Direction? (Neutral - Active)Comment: Despite price flipping from a Red 9 to a Green 1, price is none the less now following the path of the "bullish TD 9". 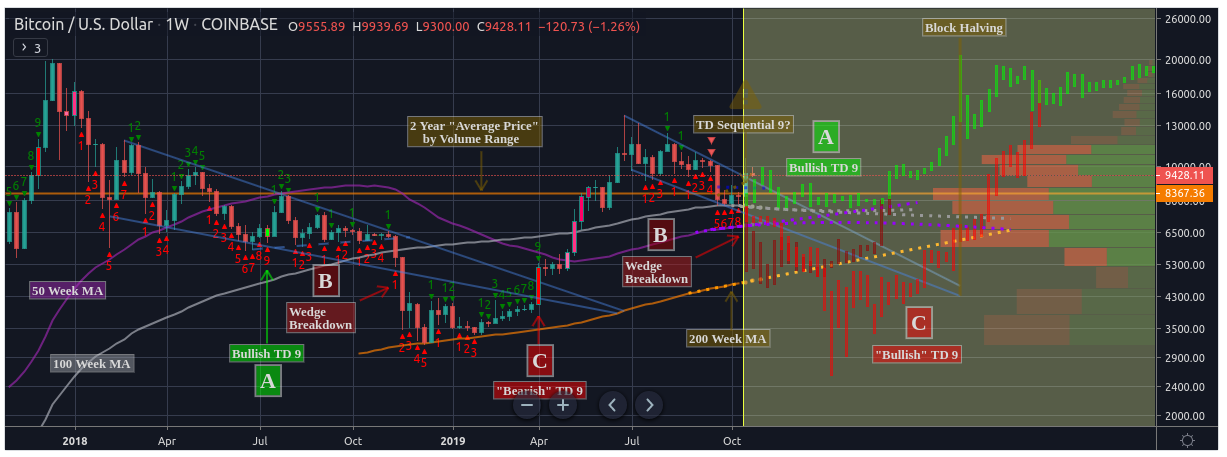 Part 10: Extrapolating the 50 & 200 Day MA bear crosses (Short - Active)Comment: Price is currently following the 2014 and 2015 death cross route with a target of $12,000 by the end of the month, could still go either way. 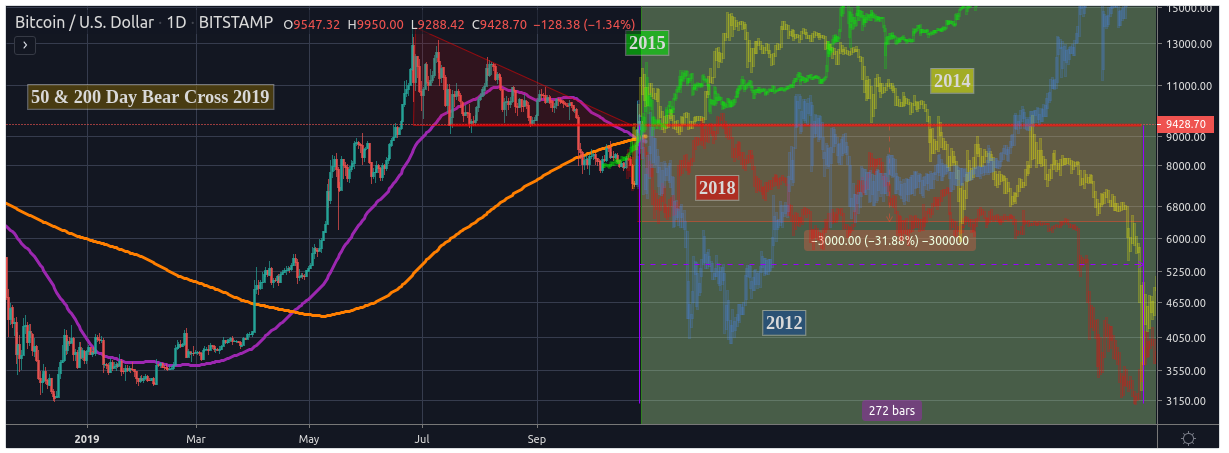
No longer updating patterns that were previously declared completed (Parts 7 & 8 ): Other Indicators
Part 6: If Bitcoin Repeats History? Monthly TD Sequential Red 1
Part 7: Another Bearish Bitcoin Indicator: 200 EMA & MA Bearcross
Part 8: Bitcoin's Full Moon Reversal 6 Month Pattern
Part 9: TD Sequential 9 Next Week To Decide Direction?
Part 10: Extrapolating the 50 & 200 Day MA bear crosses
Completed Patterns: no longer relevant
|
|
|
|
dragonvslinux (OP)
Legendary
Offline
Activity: 1666
Merit: 2204
Crypto Swap Exchange
|
|
November 03, 2019, 12:05:58 AM
Last edit: September 10, 2023, 02:44:01 PM by dragonvslinux |
|
A few random thoughts from charts from this week while awaiting for weekly charts to close to update parts 1-10. Bear trend or bull flag?  Do we need to fill the VPVR gap?  50 & 100 Week MA bullish cross incoming?  Ascending broadening wedge forming?  Or really just another bearish descending triangle? 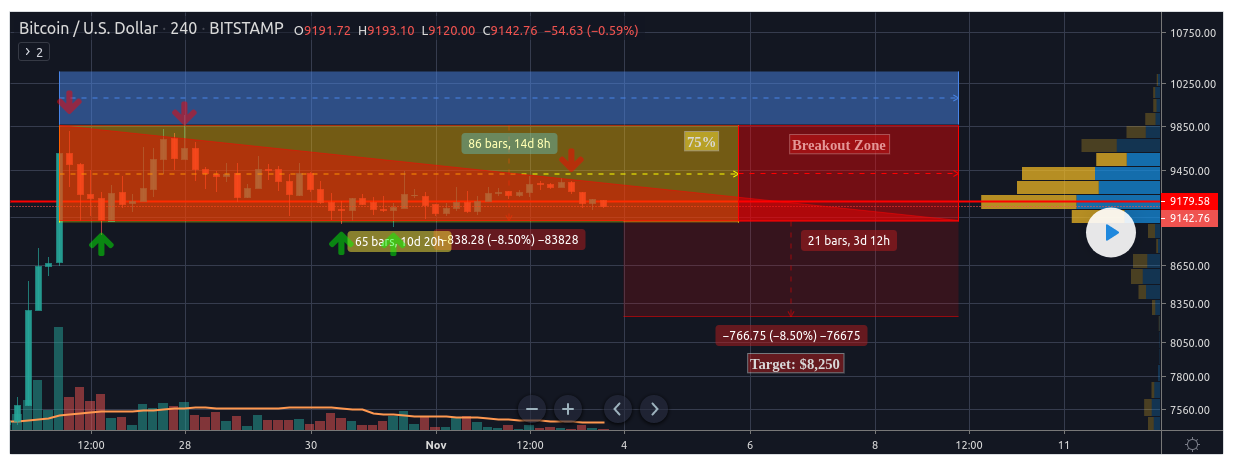 So many potential patterns, all mean nothing without confirmation. Fear & Greed Index: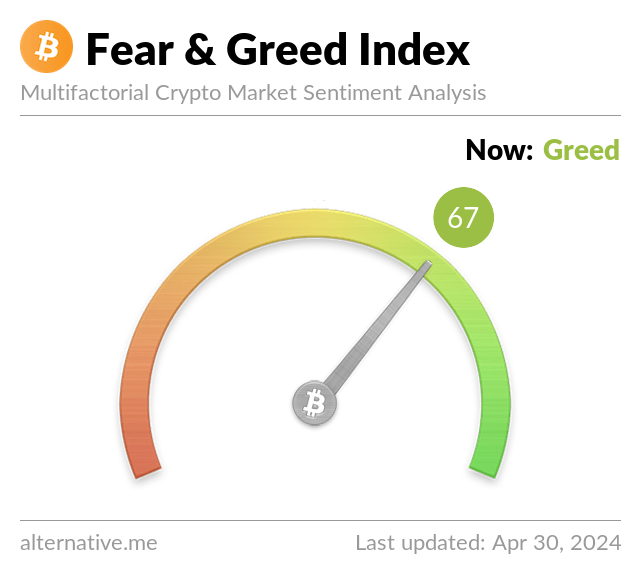 |
|
|
|
dragonvslinux (OP)
Legendary
Offline
Activity: 1666
Merit: 2204
Crypto Swap Exchange
|
|
November 04, 2019, 08:07:58 PM
Last edit: September 10, 2023, 02:41:07 PM by dragonvslinux |
|
Active Parts updated (1, 2, 3, 5, 6, 9, 10). More bearish bias confirmed (2, 3, 5), as well as neutral/bullish (6, 9, 10) bias confirmed compared to last week. A lot of mixed price signals suggesting a lack of definite direction at the moment. Best to remain neutral until further confirmation in my opinion, despite individual biases. Analysis & Status Similar (8] | Relevant (1) | Irrelevant (1) Short (7) | Neutral (3) | Long (0) Active (7) | Completed (2) | Inactive (1) Updated: November 4th 2019
Part 1: Descending Triangle Looking Similar To 2018 (Short - Active)Comment: Broke down too soon for confirmation of similarity. Could still follow same pattern if breaks down again soon, but unlikely. 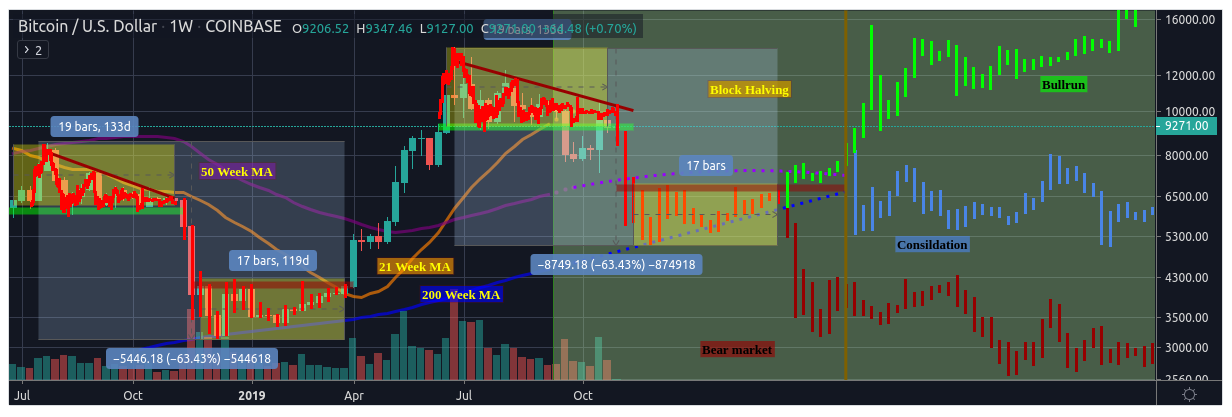 Part 2: Measuring The Move of the Descending Triangle Breakdown (Short - Active)Comment: Broke down as expected with a delayed but eventual re-test of triangle resistance that held up, still awaiting target until breakdown is invalidated. 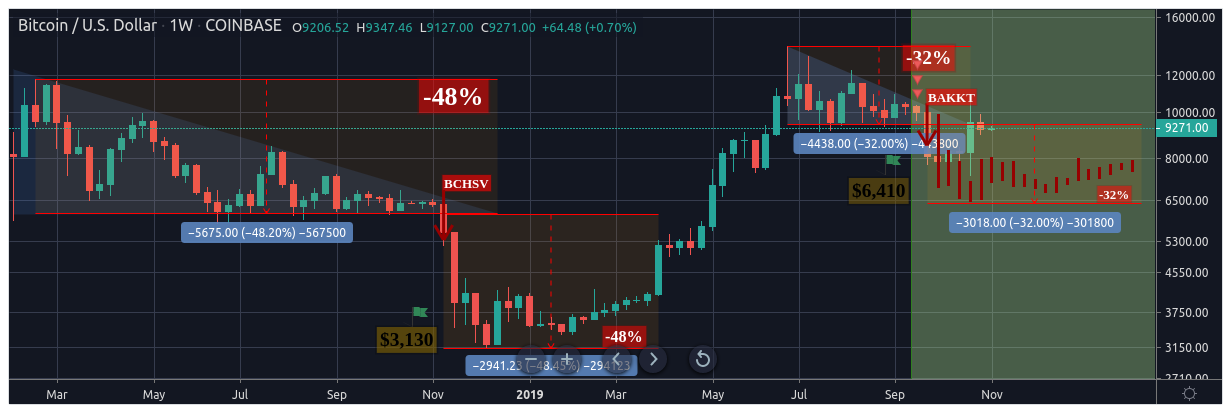 Part 3: A repeat of 2014? Worst Case Scenario A $2,500 Low (Short - Active)Comment: Price is returning to the path of a "slow grind" reversal as well as notably fallen to a similar breakdown level. 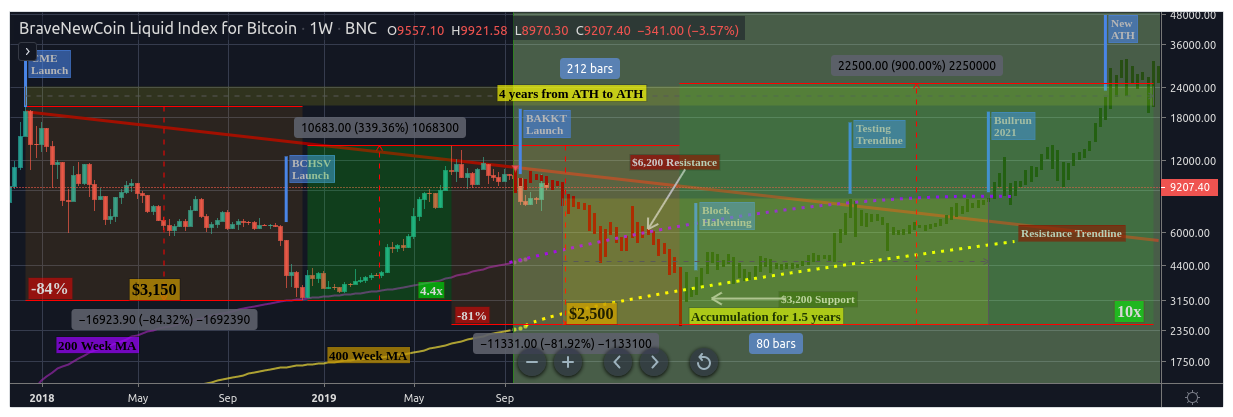 Part 5: If 2017 Descending Triangle Repeats? Best Case Scenario (Short - Active)Comment: The re-test of triangle resistance was late, but now returning to similar price range that suggests further downside. 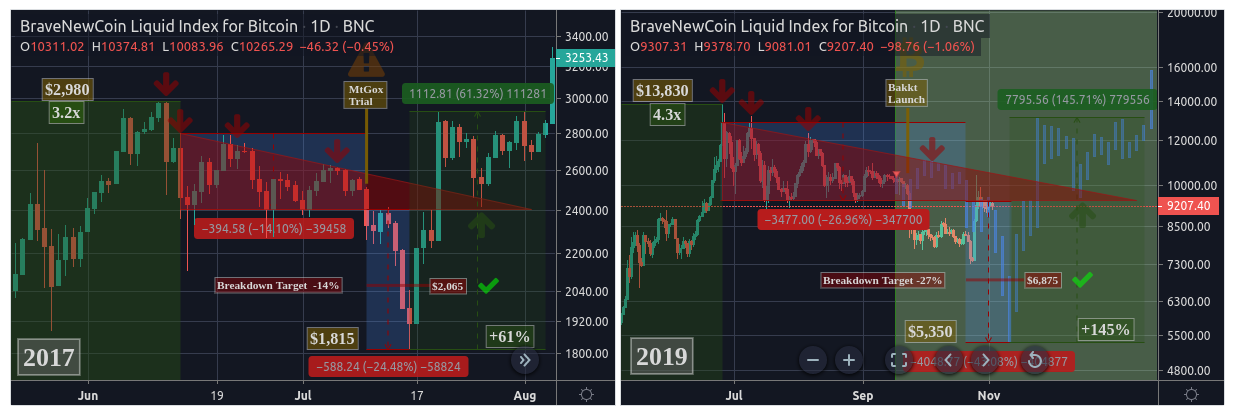 Part 6: If Bitcoin Repeats History? Monthly TD Sequential Red 1 (Neutral - Active)Comment: Last months green monthly candle looks to be taking the bullish path of the continued bull-run. However now sequential is on a Red 3, price could still go either way. 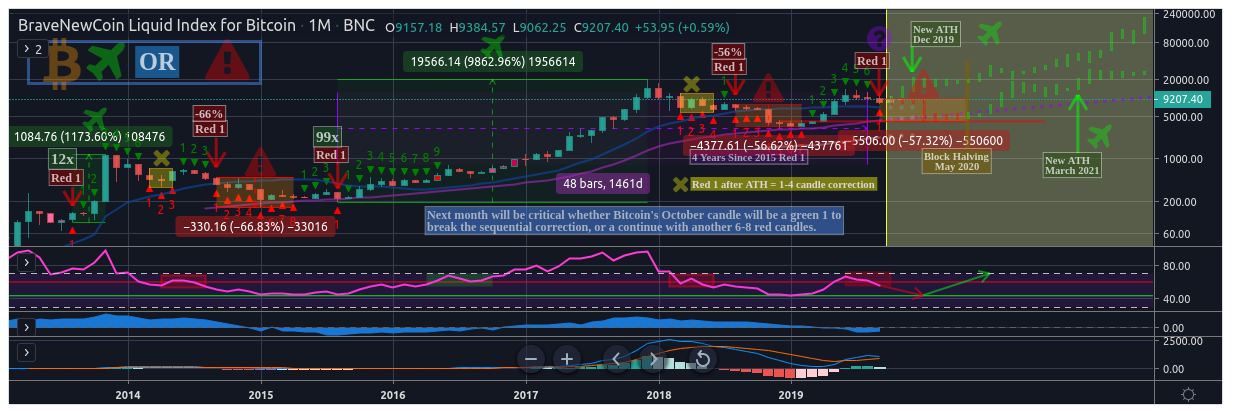 Part 9: TD Sequential 9 Next Week To Decide Direction? (Neutral - Active)Comment: Price is currently following the path of the "bullish TD 9", despite the price flip. Extrapolation suggests a re-test of support before higher highs. 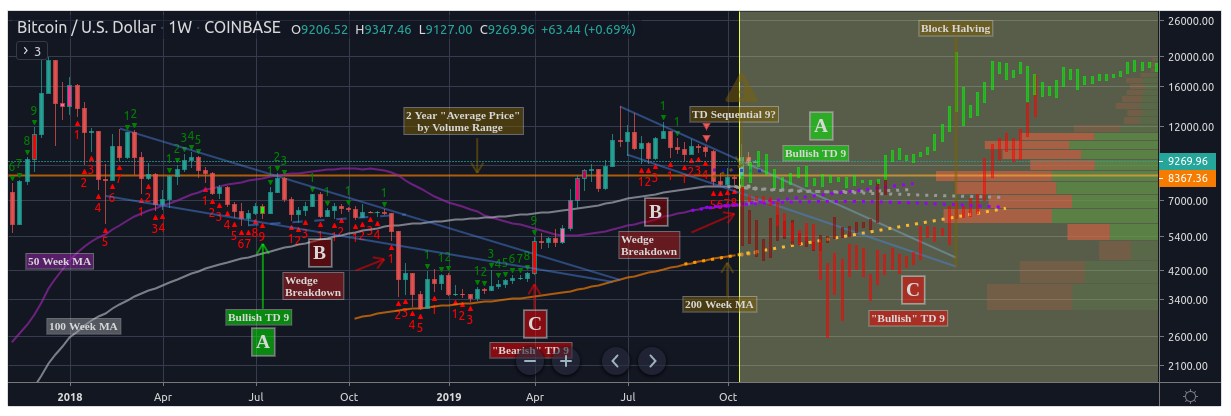 Part 10: Extrapolating the 50 & 200 Day MA bear crosses (Short - Active)Comment: Price remains within the 2014-2015 paths despite failing to $12,000 last month, suggesting further upside or consolidation. 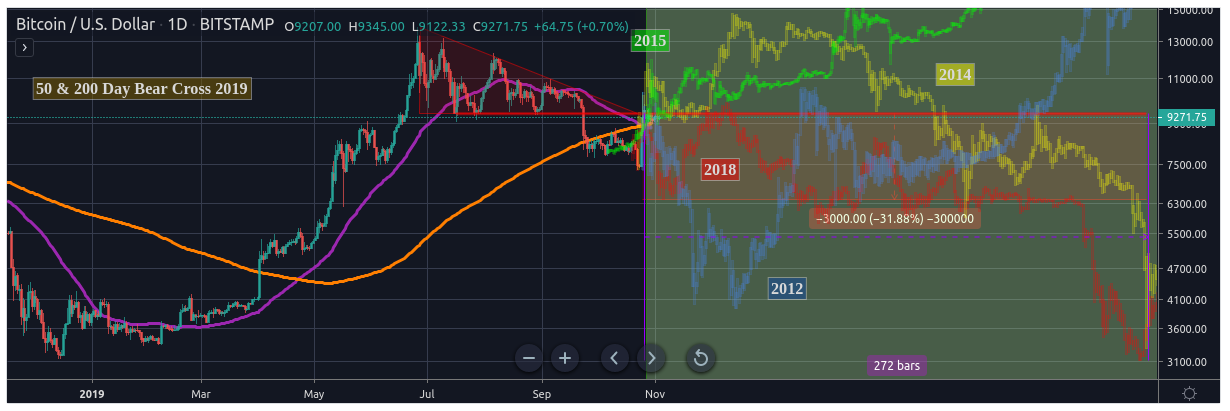 |
|
|
|
dragonvslinux (OP)
Legendary
Offline
Activity: 1666
Merit: 2204
Crypto Swap Exchange
|
|
November 20, 2019, 10:37:46 AM
Last edit: September 10, 2023, 02:39:41 PM by dragonvslinux |
|
Active parts updated. These longer term extrapolations and patterns are looking more relevant than ever as we return to bearish price movements. Changes include Part 1 now gone from relevant to similar, making all 7 remaining active patterns similar to previous price history. The OP has also been updated with up-to-date screenshots as was becoming a bit updated. Analysis & Status Similar (9] | Relevant (0) | Irrelevant (1) Short (7) | Neutral (3) | Long (0) Active (7) | Completed (2) | Inactive (1) Updated: November 19th 2019
Part 1: Descending Triangle Looking Similar To 2018 (Short - Active)Comment: Broke down too soon for confirmation of similarity but now started to follow similar capitulation as 2018. 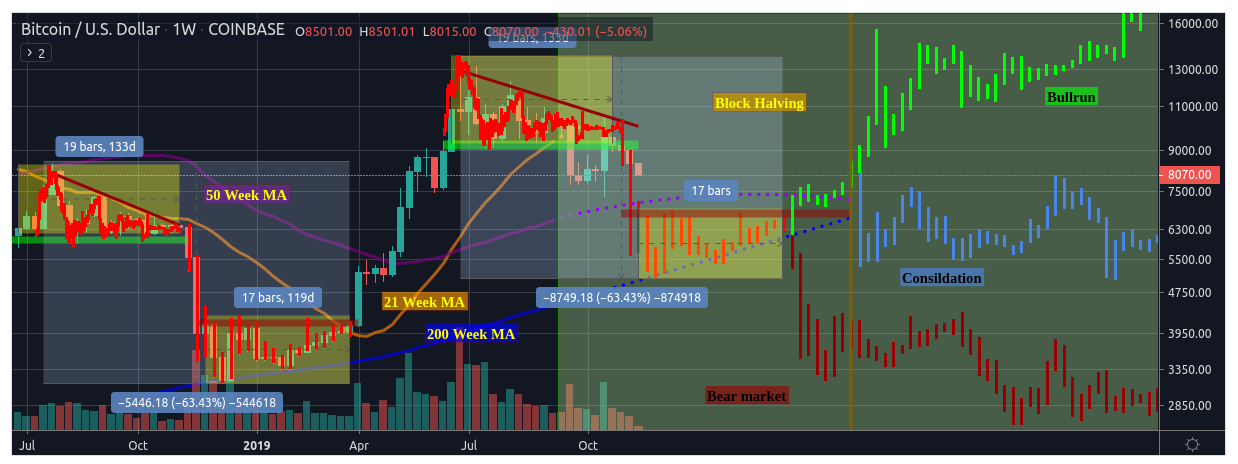 Part 2: Measuring The Move of the Descending Triangle Breakdown (Short - Active)Comment: Broke down as expected with a delayed but eventual re-test of triangle resistance that held up, still awaiting target until breakdown is invalidated. 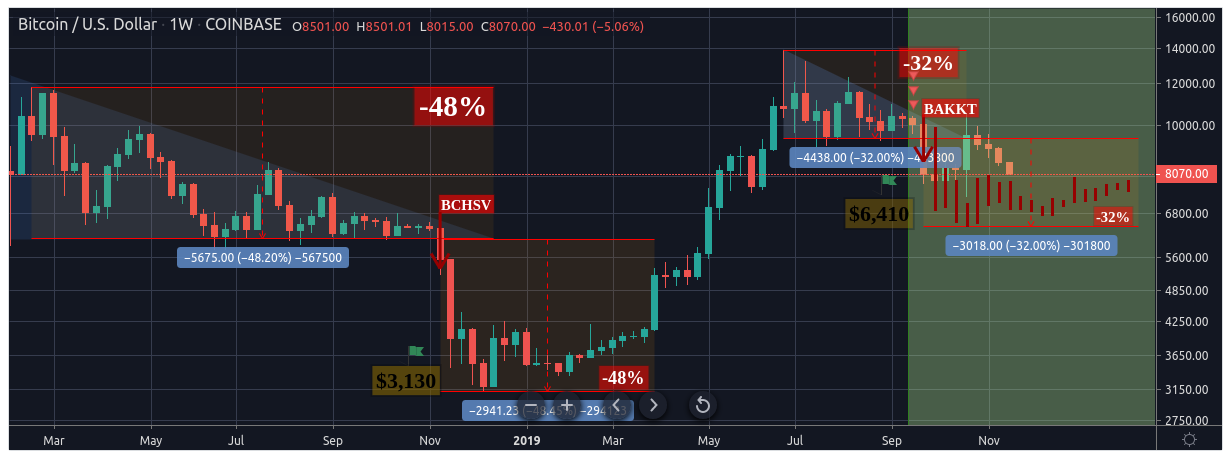 Part 3: A repeat of 2014? Worst Case Scenario A $2,500 Low (Short - Active)Comment: Price is returning to the path of a "slow grind" reversal after notably breaking down to a similar support level. 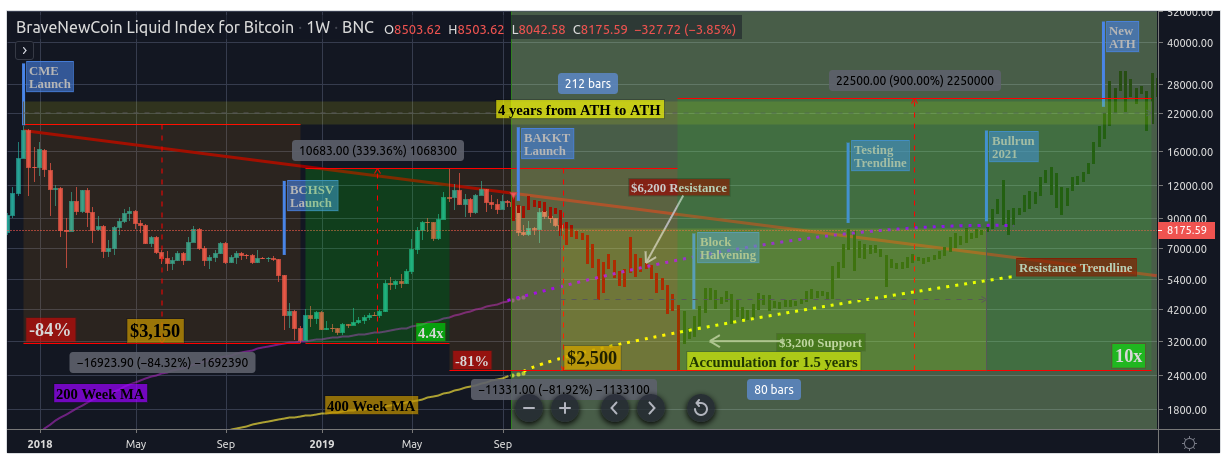 Part 5: If 2017 Descending Triangle Repeats? Best Case Scenario (Short - Active)Comment: The re-test of triangle resistance was delayed but now price is at a similar value as 2017 breakdown, implying a bounce to the upside. 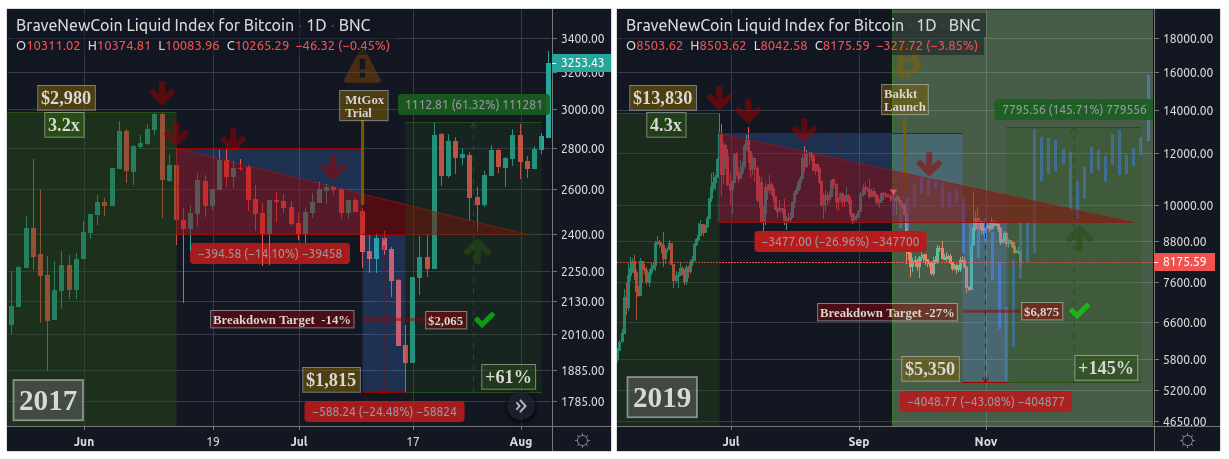 Part 6: If Bitcoin Repeats History? Monthly TD Sequential Red 1 (Neutral - Active)Comment: The Monthly Red 3 candle now looks to in between the "bullish" and bearish paths, however the sequential 3 has a bearish bias. 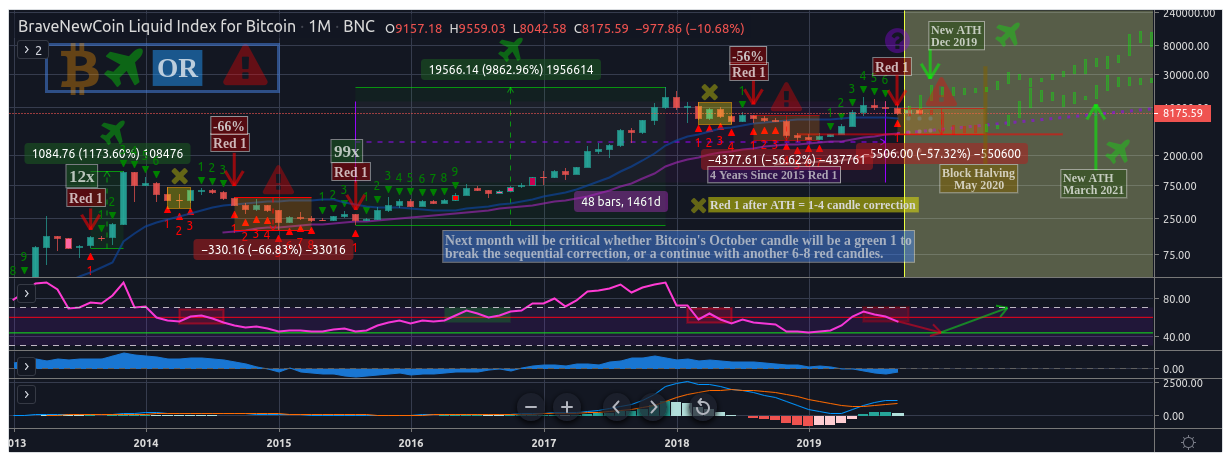 Part 9: TD Sequential 9 Next Week To Decide Direction? (Neutral - Active)Comment: Price is currently following the path of the "bullish TD 9", despite the price flip. Price continues to target support level of 100 Week MA. 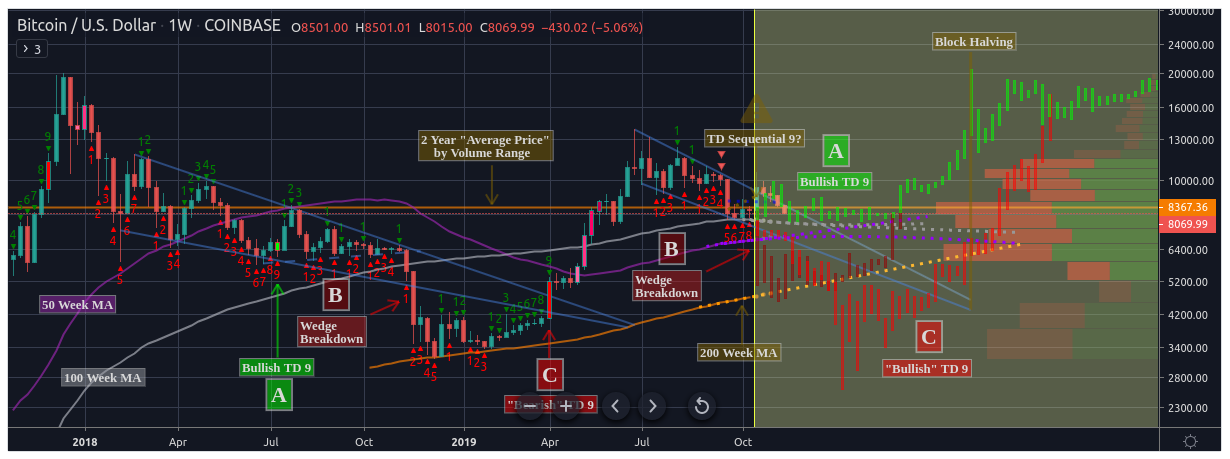 Part 10: Extrapolating the 50 & 200 Day MA bear crosses (Short - Active)Comment: Price failed to follow the 2014 & 2015 path targeting $12,000 last month, now in line with 2018 correction, but with a bounce expected. 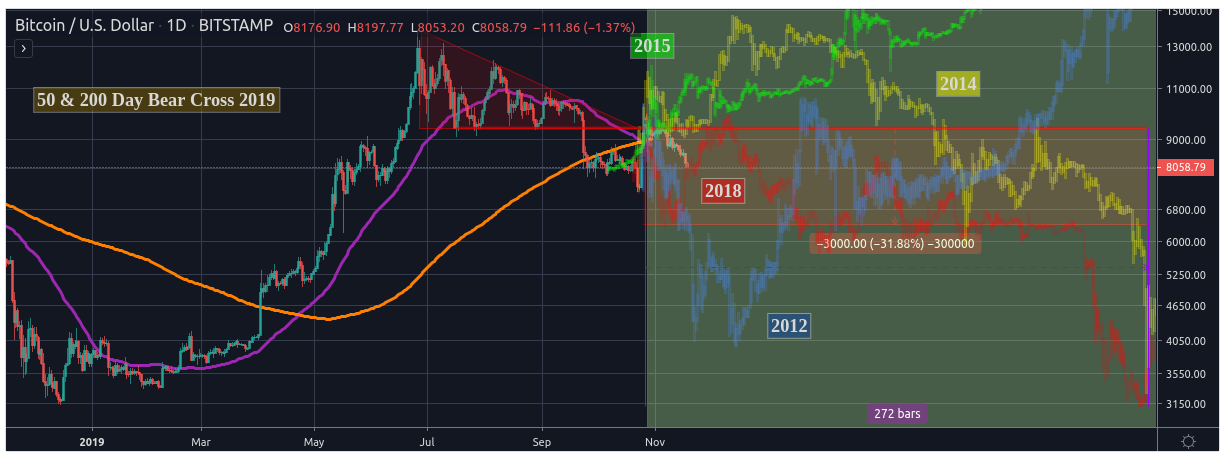
|
|
|
|
dragonvslinux (OP)
Legendary
Offline
Activity: 1666
Merit: 2204
Crypto Swap Exchange
|
|
November 22, 2019, 11:42:17 AM |
|
Active parts updated. These longer term extrapolations and patterns are looking more relevant than ever as we return to bearish price movements.
Bumping this due to the relevancy. Will wait for the Weekly close before updating the charts, but goes to show the value of identifying longer term trends and previous patterns. |
|
|
|
|
jostorres
|
|
November 22, 2019, 01:19:55 PM |
|
Yes, bitcoin repeats history. Let's take high and low and halving since 2013 (the year where bitcoin hit its first $1000 value). In 2014, the then ATH was ~$1200 and prices kept lowering through out the year. Same happened in 2018 after the current ATH of $19,800 happened. In 2015 the low happened which was around 20% of ATH which was below $200. So far the low after current ATH is ~$3800 happened in 2019 which approximately 20% of current ATH.
In 2016, the second halving happened and in 2020 we are going to have the 3rd halving. During the time of second halving there is no significant bull run but prices were in bull mode compared to the time of lowest price happening.
It seems right now there is no ACTIVE BULL market but we are in bullish mode by considering the lowest prices after the current ATH. This may last up to end of 2020 (even after the 3rd halving). But, we may have new ATH by end of 2020 like how 2016 ended and how 2017's beginning had a new ATH.
Hence, in 2021 we may have the new ATH of next bull cycle which may be 100x of lowest prices of current cycle. Because, current ATH of ~$20k is 100x of low of previous cycle which was $200.
|
| | .
.Duelbits│SPORTS. | | | ▄▄▄███████▄▄▄
▄▄█████████████████▄▄
▄███████████████████████▄
███████████████████████████
█████████████████████████████
███████████████████████████████
███████████████████████████████
███████████████████████████████
█████████████████████████████
███████████████████████████
▀████████████████████████
▀▀███████████████████
██████████████████████████████ | | | | ██
██
██
██
██
██
██
██
██
██
██ | | | | ███▄██▄███▄█▄▄▄▄██▄▄▄██
███▄██▀▄█▄▀███▄██████▄█
█▀███▀██▀████▀████▀▀▀██
██▀ ▀██████████████████
███▄███████████████████
███████████████████████
███████████████████████
███████████████████████
███████████████████████
███████████████████████
▀█████████████████████▀
▀▀███████████████▀▀
▀▀▀▀█▀▀▀▀ | | OFFICIAL EUROPEAN
BETTING PARTNER OF
ASTON VILLA FC | | | | ██
██
██
██
██
██
██
██
██
██
██ | | | | 10% CASHBACK
100% MULTICHARGER | │ | | │ |
|
|
|
dragonvslinux (OP)
Legendary
Offline
Activity: 1666
Merit: 2204
Crypto Swap Exchange
|
|
November 25, 2019, 11:00:01 AM
Last edit: September 10, 2023, 02:37:33 PM by dragonvslinux |
|
Part 2 completed.Within a margin of error, in this case $116 (approx 1%), I'm boldly claiming that the original descending triangle target of $6,410 has been achieved. It's usual for descending triangles to come close to their measured move targets, but just shy of it - as too many investors are watching these levels. 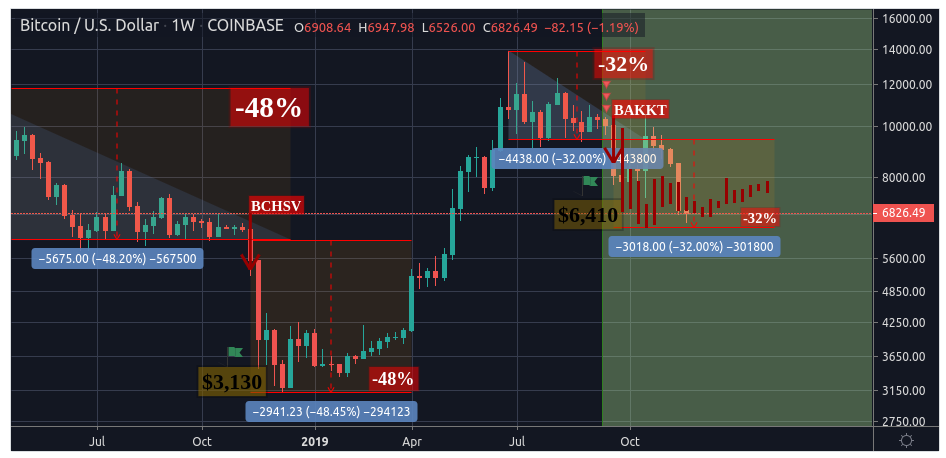 Could we go lower? Of course. Could this be the bottom for the year? Absolutely! Has the bearish triangle target been reached? I believe so. Am I bullish? Short term yes, mid-term neutral, long-term always bullish. Relevance? A bearish targeting lasting more than 2 months is finally over. Updates to rest of active Parts coming soon...
|
|
|
|
dragonvslinux (OP)
Legendary
Offline
Activity: 1666
Merit: 2204
Crypto Swap Exchange
|
|
November 28, 2019, 11:45:29 AM
Last edit: September 10, 2023, 02:37:00 PM by dragonvslinux |
|
Related TA, specifically to Part 10, but also the general theme of Bitcoin incessantly repeating history: The chart speaks for itself. The extrapolated price comes from the "2018 miner capitulation" that caused the price to drop 50%. Will we go back to $3,800? Unlikely, but clearly this is possible if the capitulation is as aggressive as 2018. Notably the VPVR is supporting the price target of $3,800, as is the extrapolation, with forecasted price for the block halving in May 2020 above $6K followed by another swift recovery and subsequent bull-run.
This isn't the first theory regarding price forming a higher low double bottom instead of holding the $5-6K area. As published last month, the 50 & 200 Day death cross [Part 10] also resulted in a 50% drop in price in 2014 and 2018, implying a 50% probability of such an outcome (using 4 sets of available data).Credit to Willy Woo for the Bitcoin Difficulty Ribbon chart and the Hash Ribbons indicator by capriole_charles. Updated to active parts next week. |
|
|
|
dragonvslinux (OP)
Legendary
Offline
Activity: 1666
Merit: 2204
Crypto Swap Exchange
|
|
December 03, 2019, 12:57:04 PM
Last edit: September 10, 2023, 02:36:38 PM by dragonvslinux |
|
Analysis & Status Similar (9] | Relevant (1) | Irrelevant (0) Short (7) | Neutral (3) | Long (0) Active (6) | Completed (4) | Inactive (0) Updates finally made, most relevantly another two patterns have completed as quoted below. Part 3 Re-Activated making all other Active Parts relevant again. This TA series has become increasingly relevant as time goes on. Also see first bullish accumulation long call at the bottom 
Part 5: If 2017 Descending Triangle Repeats? Best Case Scenario (Short - Completed)Comment: The re-test of triangle resistance was delayed but price successfully achieved breakdown target of $6,875, as expected. 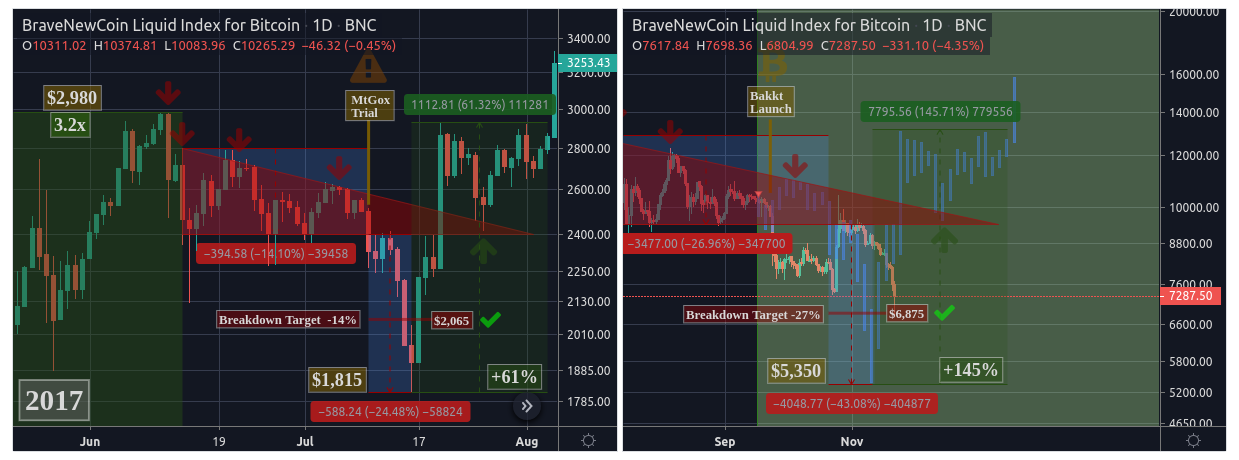 Part 2: Measuring The Move of the Descending Triangle Breakdown (Short - Completed)Comment: Broke down as expected with a delayed but eventual re-test of triangle resistance that held up, price reached target within a <1% margin or error. 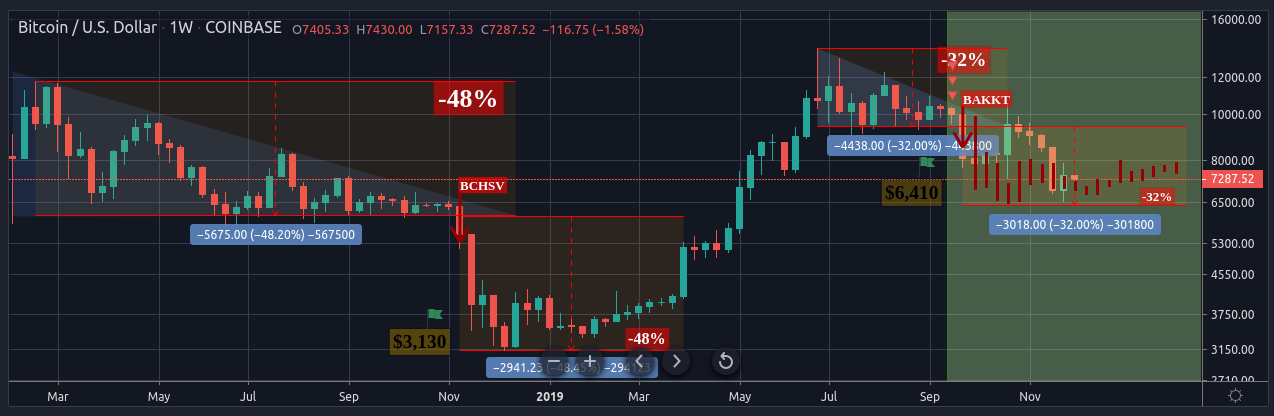
Part 1: Descending Triangle Looking Similar To 2018 (Short - Active)Comment: .Price now started to follow similar capitulation as 2018, notably finding support precisely where resistance is forecasted in the future.. 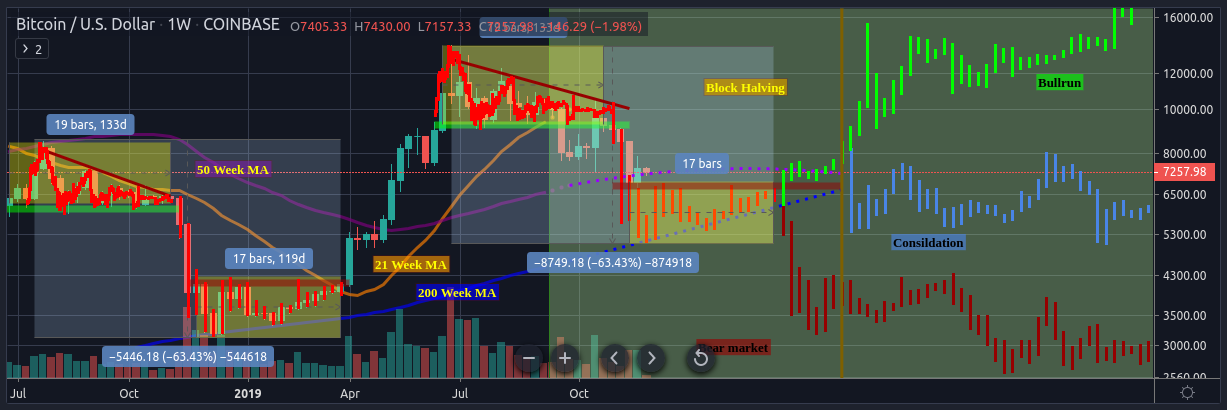 Part 3: A repeat of 2014? Worst Case Scenario A $2,500 Low (Short - Active)Comment: Price has returned to the path of a "slow grind" reversal after notably breaking down to similar support levels. 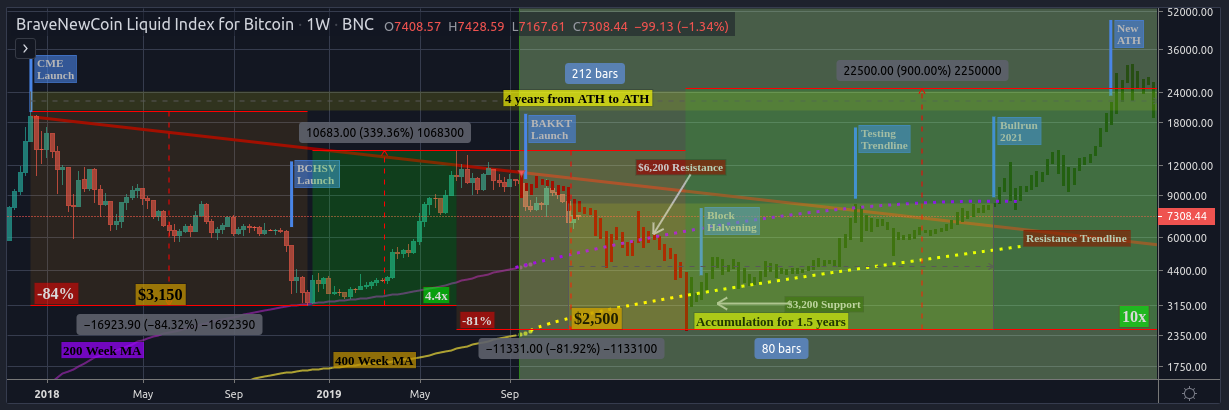 Part 4: If Bitcoin Repeats History? Extrapolating 2012 Breakdown (Short - Re-Active)Comment: Price has notably returned to the same range as the 2012 descending triangle post-breakdown, suggesting further consildation. 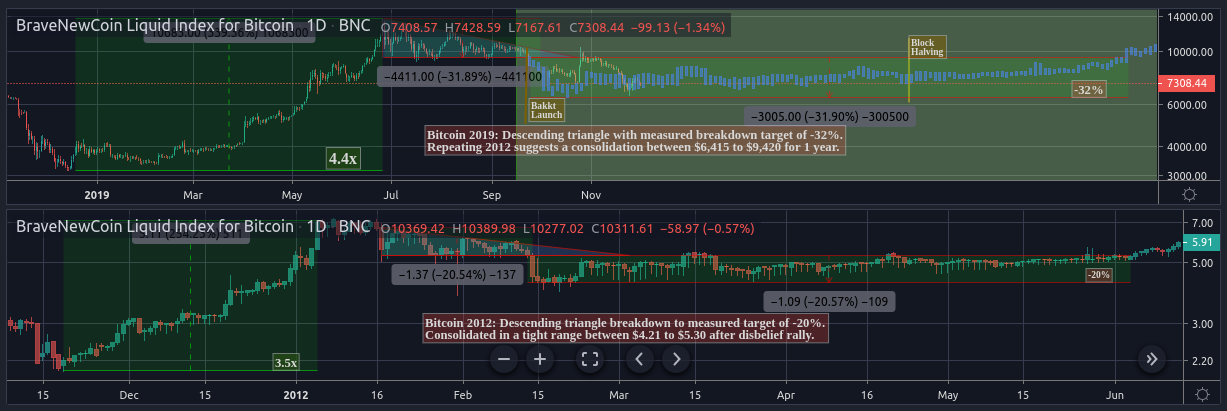 Part 6: If Bitcoin Repeats History? Monthly TD Sequential Red 1 (Neutral - Active)Comment: The Monthly Red 4 candle now looks definitively on the bearish path, implying another 3-5 months of correction. 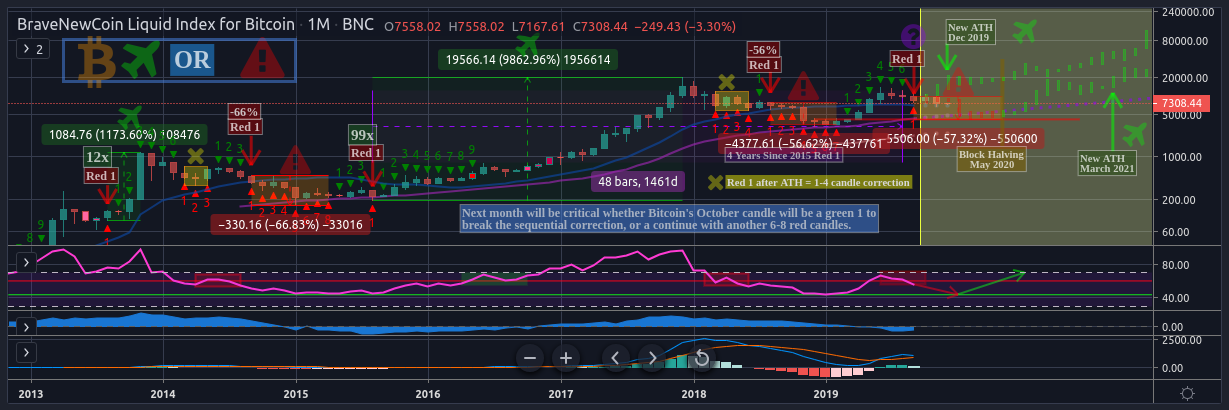 Part 9: TD Sequential 9 Next Week To Decide Direction? (Neutral - Active)Comment: Price accurately followed the path of the "bullish TD 9" with a 1-4 candle correction, but now drifting away from continuation of pattern. 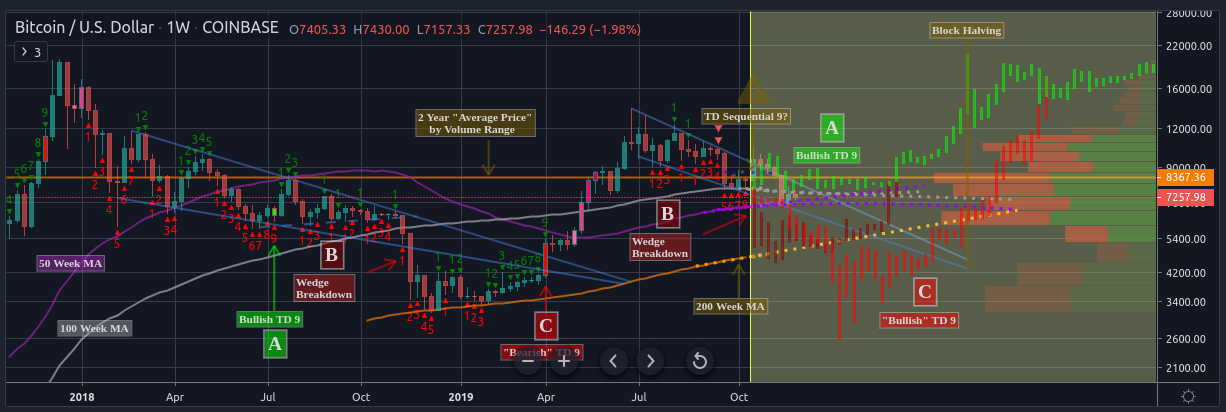 Part 10: Extrapolating the 50 & 200 Day MA bear crosses (Short - Active)Comment: Price followed the 2018 death cross path and more-or-less reaching it's first 75% probability target of $6,410. 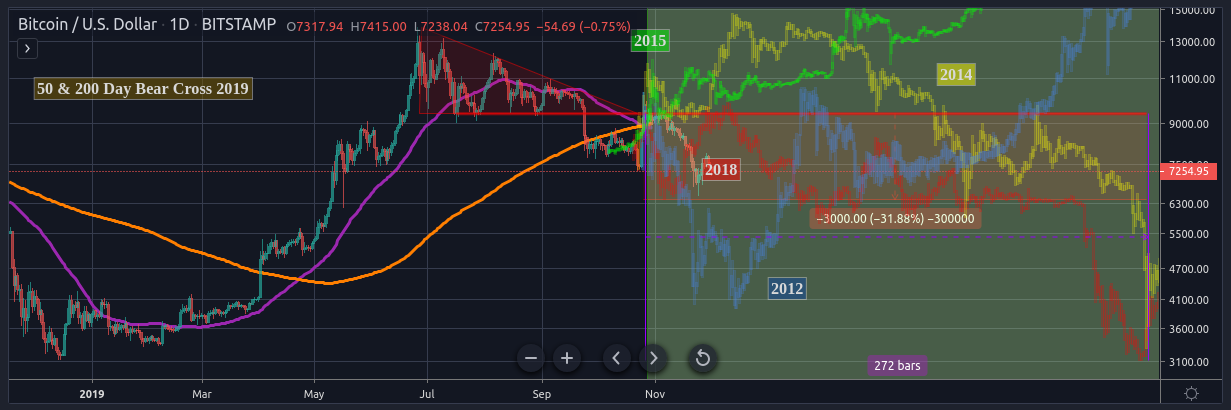
Completed Patterns Last Updated: December 3rd 2019 Part 7: Another Bearish Bitcoin Indicator: 200 EMA & MA Bearcross (Short - Completed)Comment: Price broke down after further rejection followed by the bearish crossover as the nail in the coffin, pattern completed.  Part 8: Bitcoin's Full Moon Reversal 6 Month Pattern (Neutral - Completed)Comment: Price notably continued to move downwards after making a final swing high during the Harvest Moon, pattern completed. 
Bitcoin has now entered the accumulation phase between the 2 & 4 Year MA's, represented by the 730 & 1460 MA's. As highlighted in green, this investment strategy has historically been the best tie to accumulate BTC for the long-term 4-year cycle, for 2014/2015, as well as 2018/2019. The forecasted extrapolation is merely an example of where the price may consolidate in the coming months, but is far from a price target. The reference here is the accumulation phase is currently between $4650 and $7750, which may last only a matter of weeks, but historically lasts for a considerable amount of time, such as in 2014-2015 where there was an 11-month period of price consolidation and therefore accumulation. Time to BTFD.Here's a closer look at how price is currently moving in a similar way to the Winter 2014 breakdown: 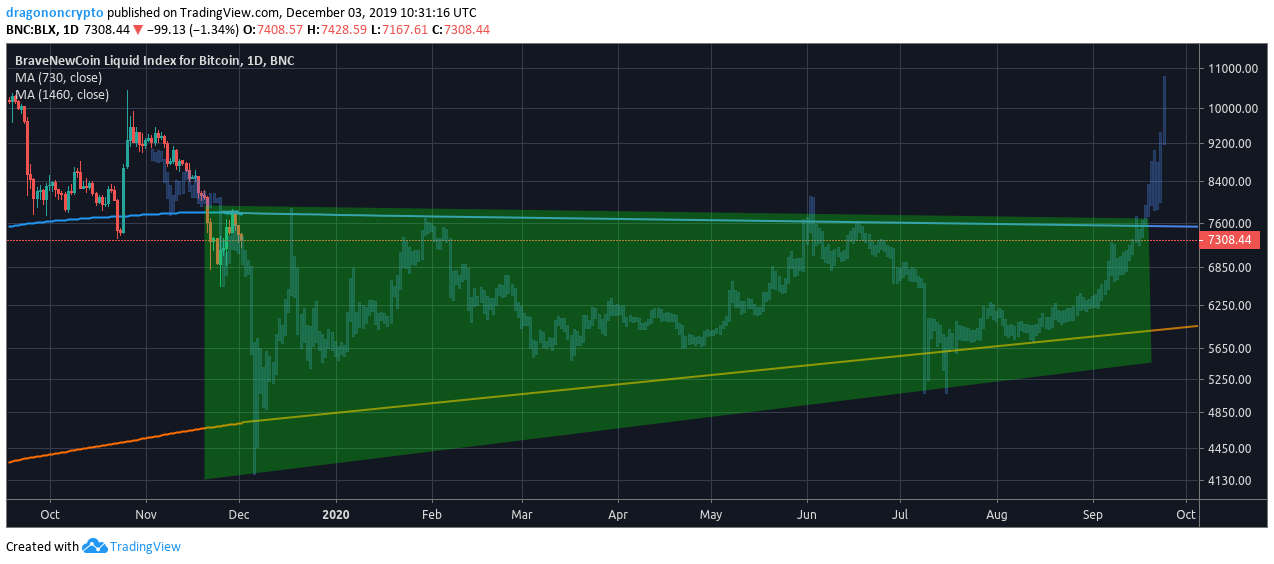 |
|
|
|
|
|
dragonvslinux (OP)
Legendary
Offline
Activity: 1666
Merit: 2204
Crypto Swap Exchange
|
|
December 19, 2019, 11:56:31 AM
Last edit: September 10, 2023, 02:30:24 PM by dragonvslinux |
|
For reference sake, here are a couple of charts (on the 4hr and Daily timeframe) published last week that remain very relevant today. Is the bear market over? Far from it, but as others have put it, we are at a crossroads. Zooming Into The Weekly Chart Doesn't Look Good (December 14th)Comment: Note we are still being rejected by the median downtrend resistance of the long-term bear flag after briefly wicking above it followed by getting rejected by it on the 4hr chart, as well as for now, the 0.382 fib retracement at $7,231. We remain bearish on the Weekly chart, the price requires follow through in order to become bullish. 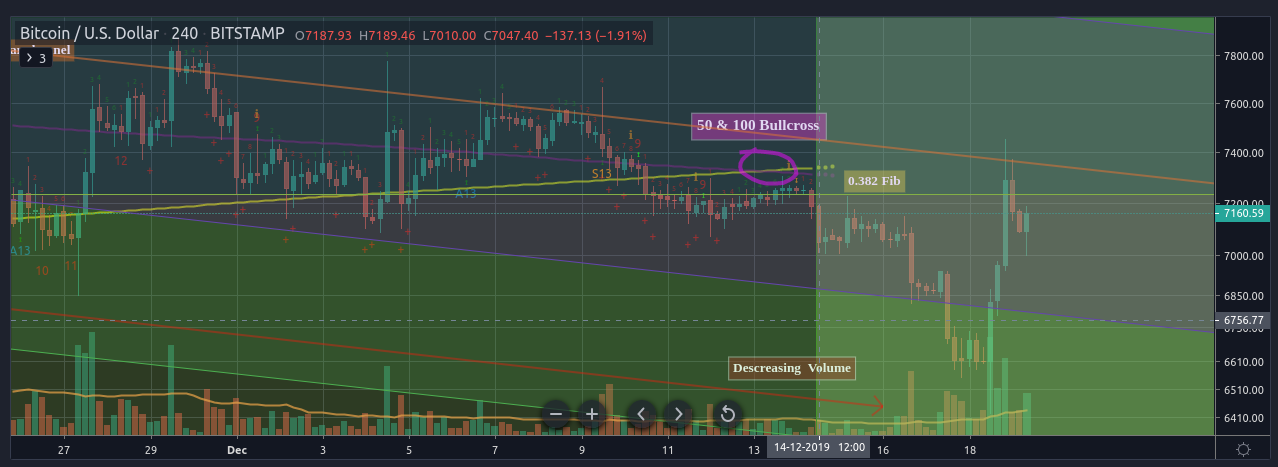 Could This Descending Triangle Be The Final Fake Out? (December 13th)Comment Could This Descending Triangle Be The Final Fake Out? (December 13th)Comment: As anticipated, while breaking down to the target of $6,525 (4hr chart) and $6,600 (Daily chart), it was a bear trap. We are now finding resistance close to the apex of the descending triangle in the breakout zone, ie the downtrend resistance line around $7,250, as well as the horizontal support around $7,170. 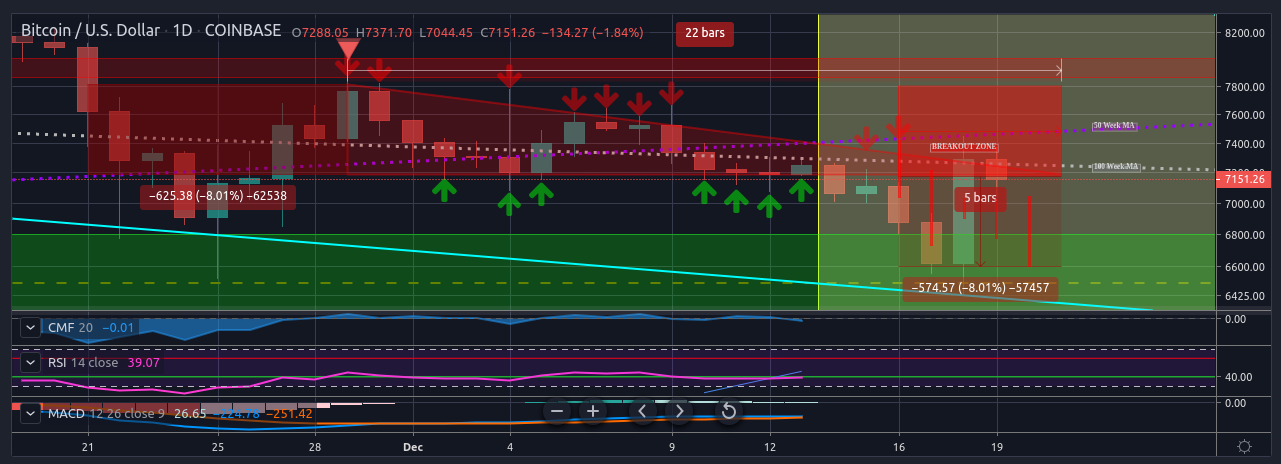 See also related longer-term TA: |
|
|
|
dragonvslinux (OP)
Legendary
Offline
Activity: 1666
Merit: 2204
Crypto Swap Exchange
|
|
December 23, 2019, 11:50:57 AM
Last edit: September 10, 2023, 02:28:01 PM by dragonvslinux |
|
Updates completed, now moved to OP from second post. Will use second post for compilation of latest TA, coming soon. Change log: Part 9 considered completed, Part 1 changed from Similar to Relevant, as referenced.5 Patterns out of 10 now completed, 5 more to go! Descending Triangle Breakdowns
Part 1: Descending Triangle Looking Similar To 2018
Part 2: Measuring The Move of the Descending Triangle Breakdown (C)
Part 3: A repeat of 2014? Worst Case Scenario A $2,500 Low
Part 4: If Bitcoin Repeats History? Extrapolating 2012 Breakdown
Part 5: If 2017 Descending Triangle Repeats? Best Case Scenario (C) Other Indicators
Part 6: If Bitcoin Repeats History? Monthly TD Sequential Red 1
Part 7: Another Bearish Bitcoin Indicator: 200 EMA & MA Bearcross (C)
Part 8: Bitcoin's Full Moon Reversal 6 Month Pattern (C)
Part 9: TD Sequential 9 Next Week To Decide Direction? (C)
Part 10: Extrapolating the 50 & 200 Day MA bear crossesCompleted (C) or Inactive (I) Patterns: no longer relevantClick on images for "live" trading view charts, see next post for newer analysis
Analysis & Status Similar (8] | Relevant (2) | Irrelevant (0) Short (7) | Neutral (3) | Long (0) Active (5) | Completed (5) | Inactive (0) Updated: December 23rd 2019
Part 1: Descending Triangle Looking Similar To 2018 (Short - Active) Update 23/12: Price notably finding support precisely where resistance is forecasted in the future. Holding this level would continue to negate the $2,600 possibility. 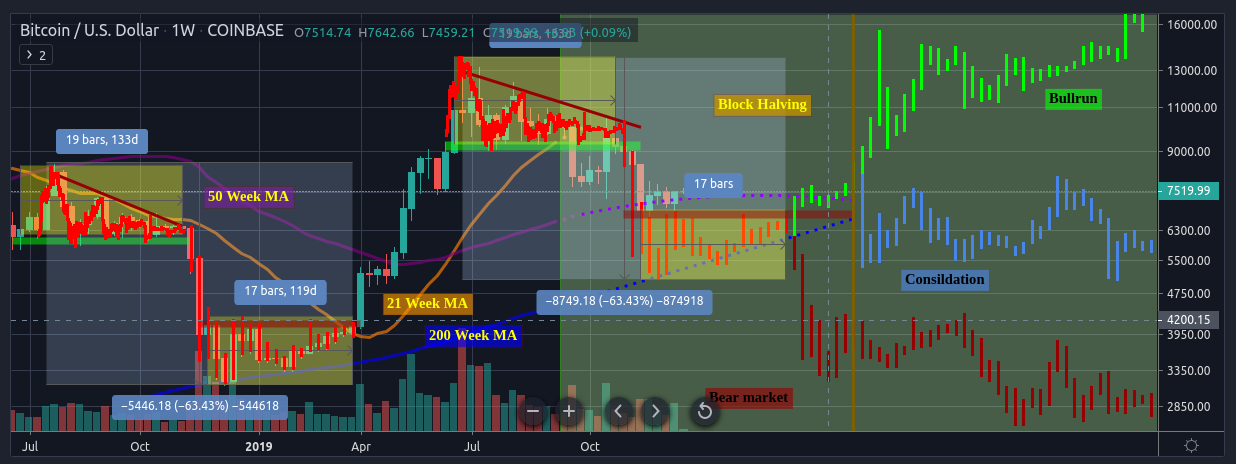 Source: Trading View, September 14th 2019. Screenshot: December 23rd 2019. Source: Trading View, September 14th 2019. Screenshot: December 23rd 2019. The daily bars of the 2018 descending triangle are starting to match the current 2019 descending triangle . If the bearish breakdown also repeats itself in the same way, then this would be the outcome, continuing on from where the charts fit together. Notice how a similar bearish breakdown would take us to the 200 Week MA, given its current trajectory. This would be long-term bullish if this happened, ie finding support again one year later $2K higher. I'd therefore find it unlikely to return to a bear market, or even continued consolidation (which would both be under the 200 Week MA).
Part 2: Measuring The Move of the Descending Triangle Breakdown (Short - Completed)
Update 23/12: Broke down as expected with a delayed but eventual re-test of triangle resistance that held up, price reached target within a $20 margin or error. 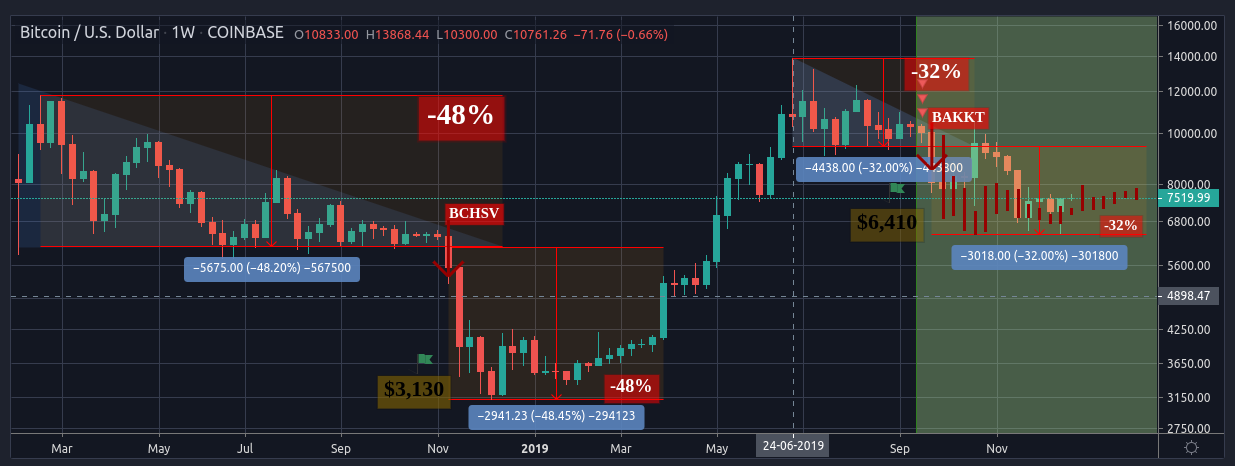 Source: Trading View, September 15th 2019. Screenshot: December 23rd 2019. Source: Trading View, September 15th 2019. Screenshot: December 23rd 2019.[/center] In 2018 there was an accuracy within 0.25% ($16) of the measured breakdown of the descending triangle . The calculation equaled $3,145 (-48.2%) with the low arriving at $3,129. Based on the 2019 Weekly descending triangle, the measured move of -32% takes the price to $6,410, give or take $16. If this Weekly triangle is breached to the upside I will calculate the Daily descending triangle, that has a reduced measured move.
Part 3: A repeat of 2014? Worst Case Scenario A $2,500 Low (Short - Active) Update 23/12: Price continuing to follow the path of a "slow grind" reversal after notably breaking down to similar support levels. Target remains $2,500. This worst case scenario extrapolates the second half of the 2014 bear market going into 2020 with ATL at $2,500 and new ATH in November 2021, as well as reaching $30,000 within the same year. This assumes a double bottom will form in April 2020 prior to the halving, followed by 1.5 years of accumulation/consolidation, with a new ATH being made 4 years after the 2017 ATH.
Part 4: If Bitcoin Repeats History? Extrapolating 2012 Breakdown (Short - Re-Active) Update 23/12: Price remains within the same range as the 2012 descending triangle post-breakdown, suggesting further consolidation until block halving. Bitcoin 2012: Descending triangle breakdown to measured target of -20%. Price consolidated in a tight range between $4.21 to $5.30 after disbelief rally. 7 years later, Bitcoin 2019: Descending triangle with measured breakdown target of -32%. Repeating 2012 suggests a consolidation between $6,415 to $9,420 for 1 year.
The time frames are very different, however the emphasis here is on a BTCUSD descending triangle at the top of a disbelief rally from the bottom of the bear market after a 250% (3.5x) rise. The measured move back then was -20% that Bitcoin achieved. The -32% breakdown target after a 340% (4.4x) doesn't seem unreasonable.Credit to KaliCrypto for the inspiration.
Part 5: If 2017 Descending Triangle Repeats? Best Case Scenario (Short - Completed)
Updated 23/11: The re-test of triangle resistance was delayed but price successfully achieved breakdown target of $6,875, as expected. I remind you of July 2017 descending triangle that completely overshot the measured target by around 12%. This is for all the traders who claim descending triangles never break to the downside in bull markets at the top of the trend. Bare in mind this was at the top of a full-blown bull market, after reaching a new ATH and 3.2x from April 2017 low. This was otherwise half way through the 2017 bull market from a 2016 low of $150, so roughly 20x. This is yet another example in the repeating Bitcoin history series to show how they do break to the downside, especially after parabolic bull markets.
The extrapolated breakdown comes to a low of $5,350 (-43%) with a measured target on the Daily descending triangle of $6,875 (-27%). Note this is different to the Weekly descending triangle measured target of $6,410 (-32% see Part 2 above), and is therefore dependent on BTC breaking out of the Weekly descending triangle to the upside, while remaining within the Daily triangle, which isn't a lot to ask for. [1][1] Never happened, BTC broke down from Weekly descending triangle.
Part 6: If Bitcoin Repeats History? Monthly TD Sequential Red 1 (Neutral - Active) Update 23/12: Despite the bounce, the Red 4 candle remains definitively on the bearish path, implying another 3-5 months of correction, starting with another dump next month. With the month of September coming to close in the coming days on a Monthly TD Sequential Red 1 price flip, October will be critical as to whether Bitcoin's monthly candle will close as a green 1 to break the sequential correction, or continue with another 6-8 red candles - as has happened in 2014 and 2018 during bear markets. Note that the Monthly Red 1 candles immediately preceding ATH have been excluded, as previously only have led to a 1-4 candle correction.
As intriguing is that 4 years have now passed since Bitcoin's 2014 Monthly Red 1 candle that led to the 2016-2017 bull market. Additionally, the monthly RSI has broken down from 60 (bullish) to neutral territory, indicating scope for a 7-9 candle correction.
Part 7: Another Bearish Bitcoin Indicator: 200 EMA & MA Bearcross (Short - Completed)
Update 24/10: Price broke down after further rejection followed by the bearish crossover as the nail in the coffin, pattern completed. A quick look at the projected 200 EMA & MA bear-cross on the Daily chart . From the March 16th 2018 bearcross at $8,273, the bullcross didn't occur until over a year later on April 4th 2019 at $4,911 after a 40% correction. The current gain in price since this 2019 bullcross has been 60%. Unless the price moves above $8500 within the coming days, the EMA & MA bear-cross is due to occur by the end of the week.
Many traders complain that due to Bitcoin's volatility the MA bull & bear crosses on longer timeframes are delayed indicators, while others prefer to utilize the EMA's (Exponential Moving Averages) for this reason. Here you see the value of trading the 200 EMA & MA bull & bear crosses. Note that following the 2018 bearcross the price first increased by 20% to the 200 Day MA, before signaling the longer-term downtrend.Part 8: Bitcoin's Full Moon Reversal 6 Month Pattern (Neutral - Completed)
Update 24/10: Price notably continued to move downwards after making a final swing high during the Harvest Moon, pattern completed. Full moons in 2019
- May 18 Flower Moon
- Jun. 17 Strawberry Moon
- Jul. 16 Buck Moon
- Aug. 15 Sturgeon Moon
- Sep. 14 Harvest Moon
- Oct. 13 Hunter's Moon
Source: https://www.space.com/16830-full-moon-calendar.html
Part 9: TD Sequential 9 Next Week To Decide Direction? (Neutral - Completed)
Updated 23/12: Price accurately followed the path of the "bullish TD 9" with a 1-4 candle correction, but has failed to consolidate above the MAs and continue the bullish path. Next week looks set for a bullish TD Sequential 9 on the Weekly chart that hasn't been seen since July 2018. Back then this led to a 40% increase in the price of Bitcoin followed by 4 months of consolidation. This scenario is labeled "A". Extrapolation C is the inverse of the "bearish" TD 9 in April 2019 that led to a continuation of the bull trend. Hence, C is labeled as the "bullish" TD 9 but would be the most bearish scenario. Scenario B is the extrapolation of the 2018 wedge breakdown, as documented in Part 1 of the Bitcoin repeating history series.
The two year vpvr "average price" is referenced as a key level to break (and close) above at $8376.
Part 10: Extrapolating the 50 & 200 Day MA bear crosses (Short - Active) Update 23/12: Price between the 2012 and 2018 death cross paths, reaching it's first 75% probability target of $6.4K, the next 75% probability target is $4K. It's time to talk about the bear cross that was confirmed yesterday, the 50 Day MA crossing the 200 Day MA. 3 out of 4 of Bitcoin's bear crosses have been bearish long-term indicating a further 50% drop in price (2011*, 2014 and 2018). In the shorter-term, Bitcoin also twice rallied by 50% in two of these occasions (2014 and 2015) before continuing higher or falling back down. Only 1 out of 4 of these cases it came at the end of the bear market, in 2015. Here are the current statistics and visual representation of the bear crosses: 2011*, 2014, 2015 and 2018.*Correction: 2011 not 2012, as originally statedExtrapolating these bear crosses to the current bear cross suggests the following:- 75% probability of reaching the descending triangle breakdown target of $6,410
- 75% probability of dropping a further 50% before the block halving
- 50% probability of rallying further to $12,000 by the end of October
- 50% probability of double bottom at $3,200, specifically in July 2020
- 25% probability of breaking above $9,410 and never coming back down.
If Bitcoin Repeats History?
Descending Triangles Breakdown Summary - 2012: Breakdown to $6,415 with 1 year consolidation (Part 4)
- 2014: Breakdown to $2,500 with 1.5 years consolidation (Part 3)
- 2017: Breakdown to $5,350 with 2 months consolidation (Part 2)
- 2018: Breakdown to $5,050 with 6 months consolidation (Part 1)
- 2019: Measured move to $6,410 to $6,875 (Part 2 & 5)
That's a range between $2,500 and $6,875, with anywhere between 2-18 months of consolidation. Conclusion: Anything could happen. Look for clues.
|
|
|
|
dragonvslinux (OP)
Legendary
Offline
Activity: 1666
Merit: 2204
Crypto Swap Exchange
|
|
January 06, 2020, 10:51:35 AM
Last edit: September 10, 2023, 02:23:34 PM by dragonvslinux |
|
OP updated with 5 (out of 10) Parts still active. These remaining extrapolations are now giving very mixed signals, despite continuing to be useful and accurate, implying long-term indecision in the market that will likely be clarified in the coming weeks, or by next month. For bullish TA from November-December 2019, click here. Part 1: Descending Triangle Looking Similar To 2018 (Short - Active) Update 06/01/20: Price continuing to find support where resistance is forecasted in the future, therefore continuing to negate the $2,600 possibility. 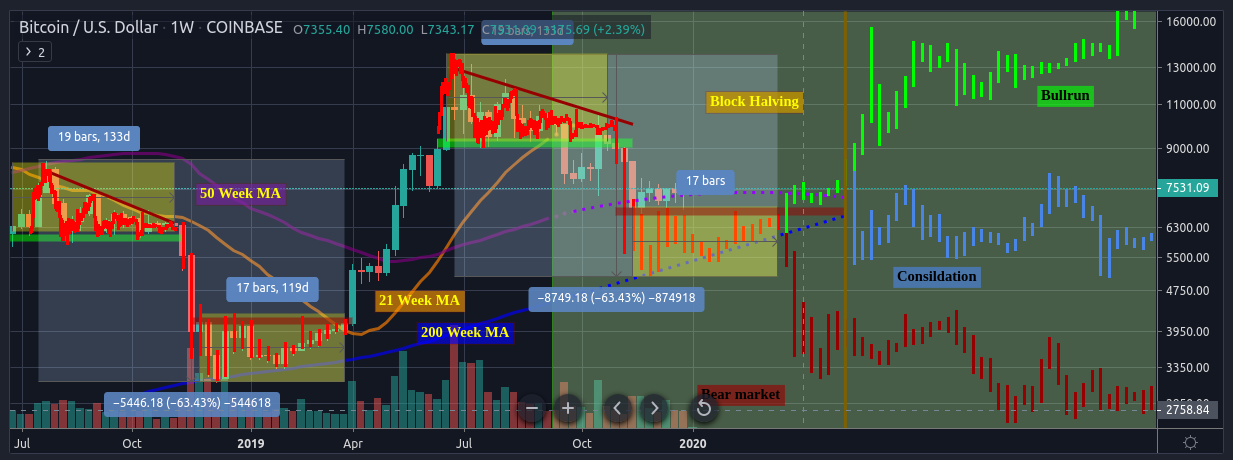
Part 3: A repeat of 2014? Worst Case Scenario A $2,500 Low (Short - Active) Update 06/01/20: Price continues to follow the path of a "slow grind" reversal, implying further downside, unless price breaks away from previous pattern . Target remains $2,500.
Part 4: If Bitcoin Repeats History? Extrapolating 2012 Breakdown (Short - Re-Active) Update 23/12: Price continues to find support from similar breakdown level as the 2012 consolidation, suggesting further range-bound prices until block halving.
Part 6: If Bitcoin Repeats History? Monthly TD Sequential Red 1 (Neutral - Active) Update 23/12: The Red 5 candle remains definitively on the bearish path, implying another 2-4 months of correction, with an implied dump this month.
Part 10: Extrapolating the 50 & 200 Day MA bear crosses (Short - Active) Update 23/12: Price is precisely same level as 2018 bear-cross after reaching it's first 75% probability target of $6.4K, the next 75% probability target is $4K. |
|
|
|
|


