thecryptogandalf (OP)
Member

 Offline Offline
Activity: 147
Merit: 21

|
 |
June 21, 2023, 02:34:23 PM |
|
Chart patterns can be valuable tools for traders to understand market behavior and predict future price movements accurately. They can enhance your strategies, profitability and allow you to make more informed trading decisions. I summarized another article here, this time for the bear flag pattern - one of the most common and used one by traders. Here is the source, where you can find also other chart patterns. What is the Bear Flag Pattern:The bear flag pattern is a technical analysis pattern that occurs during a downtrend. It involves two sharp price drops separated by a brief consolidation phase. The pattern suggests that a further bearish move is likely, and it is confirmed when the lower support trendline is broken. This leads to another downtrend with prices falling towards the low of the formation. 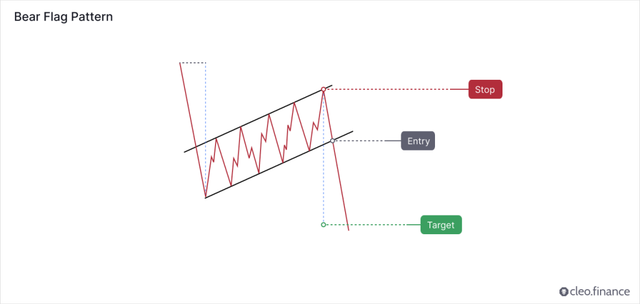 Is the Bear Flag Pattern a Continuation or Reversal Pattern? Is the Bear Flag Pattern a Continuation or Reversal Pattern?Bear flag occurs often in the market and it is generally considered to be a continuation pattern. It signals a pause or consolidation within a downtrend, where the bears take a brief break, and prices move slightly upward in a rectangular shape before continuing the downtrend. The breakout often occurs with a significant trading volume. Traders should look for either a break of important support or a pullback.  How to Identify a Bear Flag Pattern? How to Identify a Bear Flag Pattern?The bear flag pattern is a chart pattern that occurs during a downtrend. Traders should look for a fast and sharp decline in price (called a flagpole). This is followed by a brief period of consolidation (known as a flag), which is surrounded by two parallel upward-trending lines. In bear flag formation, the volume is often in a downward trend. The breakout from the flag pattern typically occurs with a significant volume and confirms the continuation of the downtrend. Although this is not always the case, flag patterns with a diminishing volume or light breakout volume usually perform better.  During the consolidation phase, traders watch out for the price breakdown through the lower trendline and make a new low since it shows the bears are in control again to push another decline. 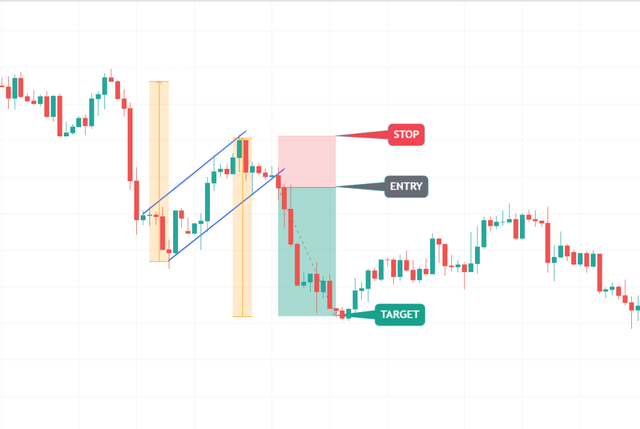 Where to Place Target and Stop Loss? Where to Place Target and Stop Loss? The target can be placed by measuring the distance from the start of the sharp price movement (the pole of the bear flag) to the point where the patterns upper trend line ends. The stop loss can be placed above the upper trend line of the pattern. And you should aim for a risk-to-reward ratio of at least 2R. (for every 1 unit of risk you expect 2 units of reward).  How to incorporate the Bear Flag Pattern into your automated trading strategy? How to incorporate the Bear Flag Pattern into your automated trading strategy? To include the Bear Flag Pattern in your automated trading strategy, you can identify the pattern on the cleo.finance chart and use the pattern's lines as your automated entry and exit conditions, along with your stop losses and take profits. Then automate it.  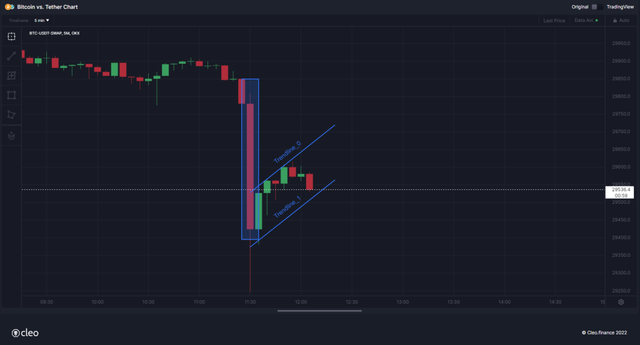 |
|
|
|
|
|
|
|
"If you don't want people to know you're a scumbag then don't be a scumbag." -- margaritahuyan
|
|
|
Advertised sites are not endorsed by the Bitcoin Forum. They may be unsafe, untrustworthy, or illegal in your jurisdiction.
|
|
|
|
|
|
|
|
dansus021
|
|
June 21, 2023, 03:39:28 PM |
|
Yeah but in my opinion, some patterns need other indicators that support them sometimes it fails to use only pattern, especially in a lower timeframe you also don't want an ending like this image below.  trade is crazy tho  anyway good information  |
| .
.Duelbits. | │ | | │ | ▄▄█▄▄░░▄▄█▄▄░░▄▄█▄▄
███░░░░███░░░░███
▀░░░▀░░▀░░░▀░░▀░░░▀
▄░░░░░░░░░░░░
▀██████████
░░░░░███░░░░▀
░░█░░░███▄█░░░█
░░██▌░░███░▀░░██▌
░█░██░░███░░░█░██
░█▀▀▀█▌░███░░█▀▀▀█▌
▄█▄░░░██▄███▄█▄░░▄██▄
▄███▄
░░░░▀██▄▀ | .
REGIONAL
SPONSOR | | ███▀██▀███▀█▀▀▀▀██▀▀▀██
██░▀░██░█░███░▀██░███▄█
█▄███▄██▄████▄████▄▄▄██
██▀ ▀███▀▀░▀██▀▀▀██████
███▄███░▄▀██████▀█▀█▀▀█
████▀▀██▄▀█████▄█▀███▄█
███▄▄▄████████▄█▄▀█████
███▀▀▀████████████▄▀███
███▄░▄█▀▀▀██████▀▀▀▄███
███████▄██▄▌████▀▀█████
▀██▄███▀██▄█▄▄▄██▄████▀
▀▀██████████▄▄███▀▀
▀▀▀▀█▀▀▀▀ | .
EUROPEAN
BETTING
PARTNER | |
|
|
|
|
Flexystar
|
|
June 21, 2023, 04:10:59 PM |
|
I am not sure if I will ever understand the seriousness of trading view and technical analysis but for the hardcore trader and new comer this article is just great help. Just lovely how you have extracted detailed info about it. I think I have seen some other thread in similar ways, may be it was you only and the cleo Website.
I dont really believe in TA to the fullest. The pattern you shown, how is it based on and what are the chances that it will bounce back at particular period of time as shown in the trading charts above?
Let us say I learn the TA to fullest of my knowledge. How do you concur about the events repeating themselves so keenly? Consider me curious and naive in TA.
|
|
|
|
|
thecryptogandalf (OP)
Member
Offline
Activity: 147
Merit: 21
|
|
June 22, 2023, 02:14:47 PM |
|
Yeah but in my opinion, some patterns need other indicators that support them sometimes it fails to use only pattern, especially in a lower timeframe you also don't want an ending like this image below. trade is crazy tho anyway good information Thanks! Precisely, the thing is using chart patterns alone won't give you the best result for predicting market moves. That is why it is always advisable to use chart patterns in conjunction with other technical indicator for the best results. We can think of chart patterns as some kind of essential piece of a trader's toolkit. For the picture, I would say that, it is a flag pattern because flag patterns are very short consolidations with a flag a pole (the sharp price drop right before the pattern forms) and it works best on 4h, 1H and Daily. Flag patterns are one of the most frequent chart patterns that form and they need to be watched carefully and always should be looked for confirming factors, such as volume and other technical indicators |
|
|
|
|
thecryptogandalf (OP)
Member
Offline
Activity: 147
Merit: 21
|
|
June 22, 2023, 02:27:16 PM |
|
I am not sure if I will ever understand the seriousness of trading view and technical analysis but for the hardcore trader and new comer this article is just great help. Just lovely how you have extracted detailed info about it. I think I have seen some other thread in similar ways, may be it was you only and the cleo Website.
I dont really believe in TA to the fullest. The pattern you shown, how is it based on and what are the chances that it will bounce back at particular period of time as shown in the trading charts above?
Let us say I learn the TA to fullest of my knowledge. How do you concur about the events repeating themselves so keenly? Consider me curious and naive in TA.
I appreciate the positive comment, thanks. Every trader understands that it's impossible to predict market moves with 100% certainty. However, using technical indicators can help us make better decisions. These indicators and patterns give us clues about how buyers and sellers behave in the market. For instance, with a bear flag, when prices consolidate and volume is low, it means neither buyers nor sellers have control. But when there's a breakout, it suggests that sellers are gaining momentum again, giving us an idea of how to position ourselves. The concept of events repeating themselves in the market is often attributed to the belief that human psychology plays a role in shaping market dynamics. Market participants tend to exhibit similar patterns of behavior when faced with similar market conditions, leading to the repetition of certain patterns over time. You can also check out the Bulkowski statistics here about flag patterns, in terms of breakout, throwback, etc stats. He has one of the most extensive research and tests on chart pattern and where he shared all the stats he got. https://thepatternsite.com/flags.html |
|
|
|
|
|
palle11
|
|
June 22, 2023, 02:49:57 PM |
|
I appreciate the positive comment, thanks.
Every trader understands that it's impossible to predict market moves with 100% certainty. However, using technical indicators can help us make better decisions. These indicators and patterns give us clues about how buyers and sellers behave in the market. For instance, with a bear flag, when prices consolidate and volume is low, it means neither buyers nor sellers have control. But when there's a breakout, it suggests that sellers are gaining momentum again, giving us an idea of how to position ourselves.
I also like to say briefly that when there is breakouts , it also depends on the strategy of the trader or type of trader. Like if a trader is a daily trader, he should be careful of the breakout and not be carried away because at every breakout there is correction and such correction may take time to continue the breakout position. Some traders like swingers or daily trader may feel no reversal after the breakout and they may be caught on the web of correction if they don't use stop loss. Breakout only means a directional position but not that it may not change from time to time within the moment. |
|
|
|
|
SystemTrader
Newbie
Offline
Activity: 23
Merit: 1
|
|
June 28, 2023, 07:27:59 AM |
|
Good info. It is nice and clean. I have saved the article and the other ones. Your blog seems pretty cool! About the bear flag pattern, the diminishing volume during the formation is a must?
|
|
|
|
|
|
MusaMohamed
|
|
June 28, 2023, 08:12:56 AM |
|
Yeah but in my opinion, some patterns need other indicators that support them sometimes it fails to use only pattern, especially in a lower timeframe you also don't want an ending like this image below.
Many times, the market moves oppositely to what it should move based on patterns which are used by most of market participants. If the market moves exactly like what most of us think, most of us will be rich. Many years, in all markets, most of people lose money and only very intelligent investors, traders get richer. Don't trust patterns and indicators which are set up by Market Makers to help them richer and make us poorer. Focus on fundamentals and have a wide overview, long term plan are better. |
| R |
▀▀▀▀▀▀▀██████▄▄
████████████████
▀▀▀▀█████▀▀▀█████
████████▌███▐████
▄▄▄▄█████▄▄▄█████
████████████████
▄▄▄▄▄▄▄██████▀▀ | LLBIT | │ | CRYPTO
FUTURES | | | | | | | | | [ | 1,000x
LEVERAGE | ] | [ | .
COMPETITIVE
FEES | ] | [ | INSTANT
EXECUTION | ] | | | ██████
██
██
██
██
██
██
██
██
██
██
██
██████ | ████████████████████████████████████████████████████████
.
TRADE NOW
.
████████████████████████████████████████████████████████ | ██████
██
██
██
██
██
██
██
██
██
██
██
██████ |
|
|
|
|
Aanuoluwatofunmi
|
|
June 28, 2023, 08:41:32 AM |
|
It should be understood that any strategy has a time of use and relevance. And sometimes it is extremely difficult to choose the right moment. It is better to try your hand at a demo account first, as an option.
I like the fact that people are developing new strategies to help boost their trading experience with the use of different patterns base on their research work on the effective use of alternatives to trading indications used over time, one can use many approach just to arrived on same accurate result for trading purpose and we just have to certainly create a trial for the use of the new one from the existing ones for more successful result while tracking on price speculations. |
|
|
|
|
gabbie2010
|
|
June 28, 2023, 09:30:42 AM |
|
I appreciate the positive comment, thanks.
Every trader understands that it's impossible to predict market moves with 100% certainty. However, using technical indicators can help us make better decisions. These indicators and patterns give us clues about how buyers and sellers behave in the market. For instance, with a bear flag, when prices consolidate and volume is low, it means neither buyers nor sellers have control. But when there's a breakout, it suggests that sellers are gaining momentum again, giving us an idea of how to position ourselves.
I also like to say briefly that when there is breakouts , it also depends on the strategy of the trader or type of trader. Like if a trader is a daily trader, he should be careful of the breakout and not be carried away because at every breakout there is correction and such correction may take time to continue the breakout position. Some traders like swingers or daily trader may feel no reversal after the breakout and they may be caught on the web of correction if they don't use stop loss. Breakout only means a directional position but not that it may not change from time to time within the moment. Personally I like trading the breakout of a Flag pole however I prefer price retouching or pullback to the outer line of the flag pole and watch out for Price Action for possible price continuation something like exhaustion on a bullish or bearish candle that touched the line before pulling the trigger for a possible long or Short order with reference to the 1 hour or 2 hour timeframe definitely anot daily timeframe which I believe trading it breakout will lead to a massive drawdown if the price undergoes correction, however multi timeframe analysis is also very helpful to determine the trend of the market. |
|
|
|
Timmzzy
Member
Offline
Activity: 784
Merit: 34
👉bit.ly/3QXp3oh | 🔥 Ultimate Launc
|
|
June 28, 2023, 11:45:58 AM |
|
Good post but, we aint getting the timeframe we should currently be looking for this BEAR FLAG pattern. as much as i know this pattern dont usually comes up in the lower TF on like the higher TF. like the 1hr, 2hr, 3hr, 4hr down to the daily. And one thing i noticed this current year people talk more of SMC, ICT than patterns, as at 2018 i started with patterns. who noticed this too...  |
|
|
|
|
Eternad
|
|
June 28, 2023, 11:59:11 AM |
|
Good post but, we aint getting the timeframe we should currently be looking for this BEAR FLAG pattern. as much as i know this pattern dont usually comes up in the lower TF on like the higher TF. like the 1hr, 2hr, 3hr, 4hr down to the daily. And one thing i noticed this current year people talk more of SMC, ICT than patterns, as at 2018 i started with patterns. who noticed this too... It can happened on any timeframe including long time frame. Probably you are just looking on specific coin that doesnt behave a steady movement in long term but you can see it if you browse on other tokens/coin. Its normally being notice on short timeframe since theres a lot of price action on short timeframe compared to long timeframe. Patterns is still being use to get an overview on whats gonna happened next. Indicators is just popular nowadays since it can provide a data that easy to analyze for signals compared on finding a pattern on candles and wait for the next candle to establish to confiremd the next movement of the price. |
|
|
|
|
jeraldskie11
|
|
June 28, 2023, 12:31:46 PM |
|
About the bear flag pattern, the diminishing volume during the formation is a must?
No, it isn't. However, in order to maximize your chances of winning the trade, you must use the volume indicator as your confluence. Some individuals use numerous indicators such as EMA and RSI in addition with a bear flag pattern. The more confluences the higher the probability. If you see a bear flag, you can utilize the EMA as dynamic resistance and the RSI for divergence. If you find these all in the chart, it raises your chances of winning the trade. |
|
|
|
|
Hamza2424
Legendary
 Offline
Activity: 966
Merit: 1040
#SWGT CERTIK Audited

|
|
June 28, 2023, 06:23:42 PM |
|
About the bear flag pattern, the diminishing volume during the formation is a must?
No, it isn't. However, in order to maximize your chances of winning the trade, you must use the volume indicator as your confluence. Some individuals use numerous indicators such as EMA and RSI in addition with a bear flag pattern. The more confluences the higher the probability. If you see a bear flag, you can utilize the EMA as dynamic resistance and the RSI for divergence. If you find these all in the chart, it raises your chances of winning the trade. Hmm, everyone has his own preference, Moving Average seems to be more attractive for those only who are jumping in the market for the long run as whales, and patient holders as well, wining a trade is not at all granted a bit with any sort of pattern because as for particularly the condition in the market, we are facing its completely based on the developments related the market. Keep close eyes on the developments to win the trade with your analysis. |
|
|
|
|
palle11
|
|
June 28, 2023, 08:26:21 PM |
|
Personally I like trading the breakout of a Flag pole however I prefer price retouching or pullback to the outer line of the flag pole and watch out for Price Action for possible price continuation something like exhaustion on a bullish or bearish candle that touched the line before pulling the trigger for a possible long or Short order with reference to the 1 hour or 2 hour timeframe definitely anot daily timeframe which I believe trading it breakout will lead to a massive drawdown if the price undergoes correction, however multi timeframe analysis is also very helpful to determine the trend of the market.
To this end I think scalpers may not have too much to do here with exhaustion, you are definitely waiting for correction and multi timeframe is useful to determine this position but I don't like to go for scalping because it is rather slow not to be caught up by retracement.. Although sometimes depending on the timeframe that this exhaustion is severe, it may change market direction especially with higher timeframe like daily above. |
|
|
|
|
|
Hamphser
|
|
June 28, 2023, 08:46:08 PM |
|
Personally I like trading the breakout of a Flag pole however I prefer price retouching or pullback to the outer line of the flag pole and watch out for Price Action for possible price continuation something like exhaustion on a bullish or bearish candle that touched the line before pulling the trigger for a possible long or Short order with reference to the 1 hour or 2 hour timeframe definitely anot daily timeframe which I believe trading it breakout will lead to a massive drawdown if the price undergoes correction, however multi timeframe analysis is also very helpful to determine the trend of the market.
To this end I think scalpers may not have too much to do here with exhaustion, you are definitely waiting for correction and multi timeframe is useful to determine this position but I don't like to go for scalping because it is rather slow not to be caught up by retracement.. Although sometimes depending on the timeframe that this exhaustion is severe, it may change market direction especially with higher timeframe like daily above. When you do consider you out on doing scalping then everything would really be on fastrack or would really be into that fast pacing when it comes on buying and selling or simply actively been facing up with that volatility which is something that not all would able to pull on because i could really say that scalping is really indeed hardest thing to be done when you do make out trades. You would really be finding these technical indicators to be that your main friend when it comes to this. The difference on here is that you wouldn't really be sticking on higher time frame on which you would be mainly focusing on smaller ones. I have tested out on doing scalping and it turns out that it isnt really something that it is really for me. It is really that hard once you do step your foot into the market. Lots of indicators which you might really be needing but since we do know that trading isnt an assured thing no matter how well you do make TA's then its up to you on how you would gonna handle yourself. |
| │ | ███████████████████████
███████████████████████
███████████████████████
███████████████████████
███▀▀▀█████████████████
███▄▄▄█████████████████
███████████████████████
███████████████████████
███████████████████████
█████████████████████
███████████████████
███████████████
████████████████████████ | ███████████████████████████
███████████████████████████
███████████████████████████
█████████▀▀██▀██▀▀█████████
█████████████▄█████████████
████████▄█████████▄████████
█████████████▄█████████████
█████████████▄█▄███████████
██████████▀▀█████████████
██████████▀█▀██████████
▀███████████████████▀
▀███████████████▀
█████████████████████████ | | | O F F I C I A L P A R T N E R S
▬▬▬▬▬▬▬▬▬▬
ASTON VILLA FC
BURNLEY FC | │ | | │ | | BK8? | | | █▀▀▀
█
█
█
█
█
█
█
█
█
█
█
█▄▄▄ | .
PLAY NOW | ▀▀▀█
█
█
█
█
█
█
█
█
█
█
█
▄▄▄█ |
|
|
|
|
justdimin
|
|
July 01, 2023, 08:56:00 AM |
|
Yeah but in my opinion, some patterns need other indicators that support them sometimes it fails to use only pattern, especially in a lower timeframe you also don't want an ending like this image below.
Many times, the market moves oppositely to what it should move based on patterns which are used by most of market participants. If the market moves exactly like what most of us think, most of us will be rich. Many years, in all markets, most of people lose money and only very intelligent investors, traders get richer. Don't trust patterns and indicators which are set up by Market Makers to help them richer and make us poorer. Focus on fundamentals and have a wide overview, long term plan are better. The same thing when I play gambling and I'm expecting to win, I will only lose but by the time I play randomly and I forgot to think about winning a profit, I can win smoothly lol, why is that? But did you get what I am thinking? Maybe we should start thinking the opposite from now on when we trade and play gambling. Let's see if we will make a profit this time. You said to focus on the fundamentals. Really? But I think many traders are focusing on technical too much and I still believe not many are losing because they are also wise and they don't just rely on others' pattern or signals. Another thing about relying on our own, is that we can avoid blaming other's in case we lose. |
|
|
|
GreatArkansas
Legendary
Offline
Activity: 2296
Merit: 1345
Buy/Sell crypto at BestChange
|
|
July 04, 2023, 08:12:11 AM |
|
A quick tip using this bear flag pattern is before you enter the trade, you must also consider the other timeframe because sometimes, it is bullish or bearish (it's not aligned on your current timeframe)
By doing this, you can decide a better entry, stop loss and take profit price.
|
|
|
|
|
palle11
|
|
July 04, 2023, 03:20:47 PM |
|
Bear flags is just a confirmation of bear trend and nothing much to it. A newbie may find it a little bit confused if not explained in simple terms. Watch the trend if you can use longer time, confirm lower minutes and go in if it suits you then within minutes you are already in profit that shows you are right with the trend. It is not a rocket science that if you enter a wrong trend then you will come out in loss.
|
|
|
|
|
AmoreJaz
Legendary
Offline
Activity: 3094
Merit: 1102
Leading Crypto Sports Betting & Casino Platform
|
|
July 05, 2023, 08:54:14 PM |
|
A quick tip using this bear flag pattern is before you enter the trade, you must also consider the other timeframe because sometimes, it is bullish or bearish (it's not aligned on your current timeframe)
By doing this, you can decide a better entry, stop loss and take profit price.
that is true, sometimes it depends on the time frame that you are looking at. because the bear or bull season has no defined timeline, it depends on where you referenced your time frame to another one. and do remember, every project has their own timelines and so what do you call the bear and bull season. it is relative to the market they have. as much as possible, check the whole market performance of the project, so you know what kind of season you are entering with respect to their overall market. |
| ..Stake.com.. | | | ▄████████████████████████████████████▄
██ ▄▄▄▄▄▄▄▄▄▄ ▄▄▄▄▄▄▄▄▄▄ ██ ▄████▄
██ ▀▀▀▀▀▀▀▀▀▀ ██████████ ▀▀▀▀▀▀▀▀▀▀ ██ ██████
██ ██████████ ██ ██ ██████████ ██ ▀██▀
██ ██ ██ ██████ ██ ██ ██ ██ ██
██ ██████ ██ █████ ███ ██████ ██ ████▄ ██
██ █████ ███ ████ ████ █████ ███ ████████
██ ████ ████ ██████████ ████ ████ ████▀
██ ██████████ ▄▄▄▄▄▄▄▄▄▄ ██████████ ██
██ ▀▀▀▀▀▀▀▀▀▀ ██
▀█████████▀ ▄████████████▄ ▀█████████▀
▄▄▄▄▄▄▄▄▄▄▄▄███ ██ ██ ███▄▄▄▄▄▄▄▄▄▄▄▄
██████████████████████████████████████████ | | | | | | ▄▀▀▀▀▀▀▀▀▀▀▀▀▀▀▀▀▀▀▄
█ ▄▀▄ █▀▀█▀▄▄
█ █▀█ █ ▐ ▐▌
█ ▄██▄ █ ▌ █
█ ▄██████▄ █ ▌ ▐▌
█ ██████████ █ ▐ █
█ ▐██████████▌ █ ▐ ▐▌
█ ▀▀██████▀▀ █ ▌ █
█ ▄▄▄██▄▄▄ █ ▌▐▌
█ █▐ █
█ █▐▐▌
█ █▐█
▀▄▄▄▄▄▄▄▄▄▄▄▄▄▄▄▄▄▄▀█ | | | | | | ▄▄█████████▄▄
▄██▀▀▀▀█████▀▀▀▀██▄
▄█▀ ▐█▌ ▀█▄
██ ▐█▌ ██
████▄ ▄█████▄ ▄████
████████▄███████████▄████████
███▀ █████████████ ▀███
██ ███████████ ██
▀█▄ █████████ ▄█▀
▀█▄ ▄██▀▀▀▀▀▀▀██▄ ▄▄▄█▀
▀███████ ███████▀
▀█████▄ ▄█████▀
▀▀▀███▄▄▄███▀▀▀ | | | ..PLAY NOW.. |
|
|
|
|


