N12 (OP)
Donator
Legendary

 Offline Offline
Activity: 1610
Merit: 1010

|
 |
September 06, 2011, 06:46:15 PM |
|
Does this really like like a healthy, historically normal correction to you?  |
|
|
|
|
|
|
|
|
|
|
|
|
|
Bitcoin addresses contain a checksum, so it is very unlikely that mistyping an address will cause you to lose money.
|
|
|
Advertised sites are not endorsed by the Bitcoin Forum. They may be unsafe, untrustworthy, or illegal in your jurisdiction.
|
|
NothinG
|
|
September 06, 2011, 06:54:26 PM |
|
I don't see why everyone has their panties in a wad.
|
|
|
|
N12 (OP)
Donator
Legendary
Offline
Activity: 1610
Merit: 1010
|
|
September 06, 2011, 06:56:12 PM |
|
I don't see why everyone has their panties in a wad.
Because there is a lot at stake. Will the log chartists please stand up? Show me evidence this is a normal correction and not an exceptionally deep and long one! |
|
|
|
|
Elwar
Legendary
 Offline
Activity: 3598
Merit: 2384
Viva Ut Vivas

|
|
September 06, 2011, 06:58:27 PM |
|
This: 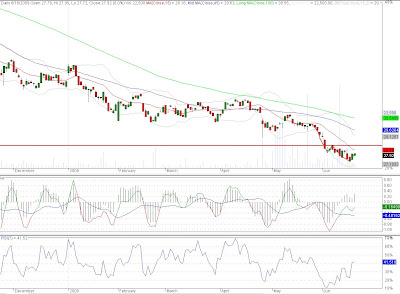 |
First seastead company actually selling sea homes: Ocean Builders https://ocean.builders Of course we accept bitcoin. |
|
|
fcmatt
Legendary
Offline
Activity: 2072
Merit: 1001
|
|
September 06, 2011, 06:59:35 PM |
|
This: Hey Elwar, you did not start your chart at 0.000001. Why is that? Are you trying to show some type of bias here that others who post a chart starting at .000001 do not seem to have? ;-) |
|
|
|
|
|
Jixtreme
|
|
September 06, 2011, 06:59:58 PM |
|
*standing*
Math major here, vouching for log chart.
|
|
|
|
|
Elwar
Legendary
Offline
Activity: 3598
Merit: 2384
Viva Ut Vivas
|
|
September 06, 2011, 07:01:14 PM |
|
This: Hey Elwar, you did not start your chart at 0.000001. Why is that? Are you trying to show some type of bias here that others who post a chart starting at .000001 do not seem to have? ;-) The random chart I found on the Internet did not start at .000001 I just wanted to feel included in the chart posting.  |
First seastead company actually selling sea homes: Ocean Builders https://ocean.builders Of course we accept bitcoin. |
|
|
ElectricMucus
Legendary
Offline
Activity: 1666
Merit: 1057
Marketing manager - GO MP
|
|
September 06, 2011, 07:12:58 PM
Last edit: September 06, 2011, 07:35:59 PM by ElectricMucus |
|
Log chartist reporting. What's up?  srsly what's your problem, just thing of it this way: Blow up the chart to 2030 or so and draw a tanh() funtion over it. It only behaves linearly (or exponential on a linear chart) because we are looking at a small fraction of it. here did that for ya:  |
|
|
|
|
|
greyhawk
|
|
September 06, 2011, 07:27:30 PM |
|
I scrolled to the end of that huge picture in hope there was a funny ending to it. There wasn't.  |
|
|
|
|
ElectricMucus
Legendary
Offline
Activity: 1666
Merit: 1057
Marketing manager - GO MP
|
|
September 06, 2011, 07:36:31 PM |
|
I scrolled to the end of that huge picture in hope there was a funny ending to it. There wasn't. k fixed Sorry not very creative  |
|
|
|
|
|
d'aniel
|
|
September 06, 2011, 07:42:26 PM |
|
Log chartist reporting. What's up? srsly what's your problem, just thing of it this way: Blow up the chart to 2030 or so and draw a tanh() funtion over it. It only behaves linearly (or exponential on a linear chart) because we are looking at a small fraction of it. Are you modelling the diffusion of Bitcoin with the logistic differential equation? Is that why you used tanh? |
|
|
|
|
ElectricMucus
Legendary
Offline
Activity: 1666
Merit: 1057
Marketing manager - GO MP
|
|
September 06, 2011, 07:44:02 PM |
|
Log chartist reporting. What's up? srsly what's your problem, just thing of it this way: Blow up the chart to 2030 or so and draw a tanh() funtion over it. It only behaves linearly (or exponential on a linear chart) because we are looking at a small fraction of it. Are you modelling the diffusion of Bitcoin with the logistic differential equation? Is that why you used tanh? I'm sorry I have no idea what you are talking about But you might be on to something here  |
|
|
|
|
|
d'aniel
|
|
September 06, 2011, 08:02:18 PM |
|
Log chartist reporting. What's up? srsly what's your problem, just thing of it this way: Blow up the chart to 2030 or so and draw a tanh() funtion over it. It only behaves linearly (or exponential on a linear chart) because we are looking at a small fraction of it. Are you modelling the diffusion of Bitcoin with the logistic differential equation? Is that why you used tanh? I'm sorry I have no idea what you are talking about But you might be on to something here Oh. If you're interested: http://en.wikipedia.org/wiki/Diffusion_of_innovations. Notice the graph at the top of the page, and the "logistic function" link underneath. |
|
|
|
|
ElectricMucus
Legendary
Offline
Activity: 1666
Merit: 1057
Marketing manager - GO MP
|
|
September 06, 2011, 08:08:15 PM |
|
Log chartist reporting. What's up? srsly what's your problem, just thing of it this way: Blow up the chart to 2030 or so and draw a tanh() funtion over it. It only behaves linearly (or exponential on a linear chart) because we are looking at a small fraction of it. Are you modelling the diffusion of Bitcoin with the logistic differential equation? Is that why you used tanh? I'm sorry I have no idea what you are talking about But you might be on to something here Oh. If you're interested: http://en.wikipedia.org/wiki/Diffusion_of_innovations. Notice the graph at the top of the page, and the "logistic function" link underneath. thanks, I've already looked it up, pretty interesting. But we have a problem: Scaling the function to the actual data would be quite a demanding task, and would require skillfull programming instead of naive curve drawing by hand  |
|
|
|
|
wee baby seamus
Newbie
 Offline
Activity: 15
Merit: 0
|
|
September 06, 2011, 08:40:39 PM |
|
are you guys just drawing lines with paint, or are you actually fitting to some curve or something? nothing's properly labeled so I can't tell, but it seems like you're just making this shit up
|
|
|
|
|
Synaptic
Member
Offline
Activity: 84
Merit: 10
|
|
September 06, 2011, 08:42:07 PM |
|
are you guys just drawing lines with paint, or are you actually fitting to some curve or something? nothing's properly labeled so I can't tell, but it seems like you're just making this shit up
Welcome to Bitcoin. Please purchase your tokens now. |
|
|
|
|
|
d'aniel
|
|
September 06, 2011, 08:43:04 PM |
|
Log chartist reporting. What's up? srsly what's your problem, just thing of it this way: Blow up the chart to 2030 or so and draw a tanh() funtion over it. It only behaves linearly (or exponential on a linear chart) because we are looking at a small fraction of it. Are you modelling the diffusion of Bitcoin with the logistic differential equation? Is that why you used tanh? I'm sorry I have no idea what you are talking about But you might be on to something here Oh. If you're interested: http://en.wikipedia.org/wiki/Diffusion_of_innovations. Notice the graph at the top of the page, and the "logistic function" link underneath. thanks, I've already looked it up, pretty interesting. But we have a problem: Scaling the function to the actual data would be quite a demanding task, and would require skillfull programming instead of naive curve drawing by hand lol Plus, I think you'd want to use the linear scaling when fitting the logistic function. Would be a pretty bad fit, then  |
|
|
|
|
|
d'aniel
|
|
September 06, 2011, 08:49:00 PM |
|
are you guys just drawing lines with paint, or are you actually fitting to some curve or something? nothing's properly labeled so I can't tell, but it seems like you're just making this shit up
Mostly just having fun with some math. I wouldn't place much confidence in the predictive power of this model. Too many significant hurdles yet to be overcome to say it's just a simple matter of spreading the word. |
|
|
|
|
|
Minsc
|
|
September 06, 2011, 11:38:42 PM |
|
|
1DcXvfJdeJch9uptKopte5XQarTtj5ZjpL
|
|
|
|
|
|


