buwaytress
Legendary

 Offline Offline
Activity: 2800
Merit: 3443
Join the world-leading crypto sportsbook NOW!

|
There's a more rational explanation. Longs were piling on for days heading into the last breakout. There were big expectations for a rally above the 200-day MA. When that rally never materialized, supply came back in and longs began to unwind. Then stops were triggered.
This is all normal price action, bouncing off expected resistance. The 200-day MA was obviously going to be sold. The question was/is whether it would be just a temporary, local top.
For the rational-minded like me (who have at best a weak grasp of economic logic and a keen sense of nonsense TA) 9k was always going to be the selloff point. Who among speculators would want to ignore a quick chance at 15% profits (from those who bought in below 8k)? And the fact that this slip only went as far as 8.6 will be good news for all them profit takers since it only means another repeat of 9k is possible and not too far away. That sustained stay above the 200MA though! |
|
|
|
|
|
|
|
|
"If you don't want people to know you're a scumbag then don't be a scumbag." -- margaritahuyan
|
|
|
Advertised sites are not endorsed by the Bitcoin Forum. They may be unsafe, untrustworthy, or illegal in your jurisdiction.
|
exstasie (OP)
Legendary
Offline
Activity: 1806
Merit: 1521
|
That sustained stay above the 200MA though!
Can't wait! Breaking above the 200-day MA and then testing/holding it as support will be an epic reversal sign. All in due time though. We saw what happens when the market breaks out too quickly. The October run to the $10,300s flew above the 200-day MA but since we never built up any support on the way up, the chart ended up an Eiffel Tower anyway. Traders call this phenomenon "too far, too fast."This slow and steady stair stepping price action where bears sell every resistance and bulls buy every consolidation is much healthier. I like to see things in terms of baby steps. As an example, for months bear analysts have been clinging to the 20-week MA (now hovering ~$8,300) as a bearish indicator. "As long as the market is below the 20MA, we're still in a downtrend." Well, the market just closed its first weekly candle above it! Another baby step complete! Next, we set our sights on the 200-day.  |
|
|
|
exstasie (OP)
Legendary
Offline
Activity: 1806
Merit: 1521
|
Annoying price action. My buddy's characterization might be best: "WTF is this shit?"   Classical TA would probably consider this a variant of bear flag, some kind of bearish consolidation. Trend-sideways-continuation is the expected progression. On the other hand, it's taking so long to drop (and OBV is looking healthy enough) that it begins to look like an accumulation range where bulls are absorbing supply and bears are not following through on the January 19th dump. It's definitely not a bearish H&S formation and it doesn't look like a typical bear flag. It looks like a shakeout to me. For now, I still maintain: - This dump doesn't look like it has legs.
- Continuing to trade above $8,463 (Bitstamp) is bullish.
|
|
|
|
El duderino_
Legendary
Offline
Activity: 2506
Merit: 12076
BTC + Crossfit, living life.
|
 |
January 22, 2020, 11:23:36 AM |
|
^ Thx for the nice updates, wanna merit but max = 50 in 30 days ....  |
XhomerX10 designed my nice avatar HATs!!!!! Thanks Bro
|
|
|
exstasie (OP)
Legendary
Offline
Activity: 1806
Merit: 1521
|
|
January 22, 2020, 10:26:41 PM |
|
Chop city continues.  We have a sign of strength, a potential double bottom printed on the daily chart off $8,465. The rally to $8,775 looks impulsive which is a good sign for bulls. Returning back to the previous 4-day mode in the mid-$8,600s is normal, but it's pretty crucial this area holds as support now and we resume an upward slope:  Otherwise it'll be a decent sign that the market doesn't want to move up. |
|
|
|
JL0
Full Member
 Offline
Activity: 817
Merit: 158
Bitcoin the Digital Gold
|
|
January 22, 2020, 11:06:49 PM |
|
Chop city continues. We have a sign of strength, a potential double bottom printed on the daily chart off $8,465. The rally to $8,775 looks impulsive which is a good sign for bulls. Returning back to the previous 4-day mode in the mid-$8,600s is normal, but it's pretty crucial this area holds as support now and we resume an upward slope: Otherwise it'll be a decent sign that the market doesn't want to move up.I hope so. Many have become bearish and are already talking about 5K-6K. What do you think ? Is the bottom in or not ? |
|
|
|
|
exstasie (OP)
Legendary
Offline
Activity: 1806
Merit: 1521
|
|
January 23, 2020, 10:49:42 AM |
|
Well, the $8,600s faltered. It didn't take long for the market to make new lows after that. If the daily wicks up and closes > $8,463 then my bullish count is still alive. Closing in the $8,300s or lower will kill it for good. We've got 13 hours until the candle closes. It's possible the market confirms the broken long term downtrend channel and/or 20-day MA as support:  Based on Tim West's TAM model, the daily just made a downward range expansion candle. A spring back above the daily high (~$8,670) would indicate a bullish reversal and would be a reasonable long entry. I want to wait and see what happens over the next 24 hours before saying much else. |
|
|
|
Wexlike
Legendary
Offline
Activity: 1473
Merit: 1086
|
|
January 23, 2020, 01:33:59 PM |
|
Based on Tim West's TAM model, the daily just made a downward range expansion candle. A spring back above the daily high (~$8,670) would indicate a bullish reversal and would be a reasonable long entry. I want to wait and see what happens over the next 24 hours before saying much else. I don't want to go back again to that doomed channel... |
|
|
|
|
|
ft73
|
|
January 23, 2020, 07:29:42 PM |
|
Well, MA20/W is running at about 8270$.
It's also middle of weekly BB.
Let's see.
|
|
|
|
|
exstasie (OP)
Legendary
Offline
Activity: 1806
Merit: 1521
|
|
January 23, 2020, 08:19:31 PM |
|
I'm about ready to chuck that local EW count in the trash. It was always a bit too ambitious, aiming for the 2.618 extension. I have an alternative in mind which I'll post sometime after the daily close. Many have become bearish and are already talking about 5K-6K. What do you think ? Is the bottom in or not ?
I believe the bottom is already in. Here's a look at where I think we are in the larger cycle: I don't want to go back again to that doomed channel...
Me neither. I figured we might go back to test the upper channel line as support, but was hoping we could keep stair stepping up instead, as that would be more reliable bull market behavior. We don't want to fall back into the channel for long, that's for sure. That would indicate failure to break the downtrend. A wick on the weekly chart or even one candle close below the channel top might be okay, but beyond that.....  Well, MA20/W is running at about 8270$.
It's also middle of weekly BB.
Let's see.
Yes, we have the 20-week MA, 20-day MA, and broken channel top all in this same area. The market may find support here for that reason. |
|
|
|
exstasie (OP)
Legendary
Offline
Activity: 1806
Merit: 1521
|
|
January 25, 2020, 11:46:02 AM |
|
Updated primary count:  I don't like the internal (lower degree) count, but I think the overall wave proportions really support this idea. The deep pullback in Wave 2 and the > 1.618 extension in Wave 3 definitely looks like impulsive behavior to me. This is the general idea:  The 20-day MA doesn't seem to be providing support. I consider bears to be in control until the market breaks back above ~$8,670, the top of that failure candle two days ago. Looking at daily Chande levels and considering the overall structure, I would expect a few more days of consolidation in this general area. We prefer to hold $8,000+ and ideally at/above the 0.382 to maintain good impulsive channel form. A sustained drop back into that yellow channel will suggest we are actually in a larger correction, in which case I offer xxxx123abcxxxx's alternative: |
|
|
|
exstasie (OP)
Legendary
Offline
Activity: 1806
Merit: 1521
|
Nice bullish engulfing on the daily chart! We broke above this downtrend line and 20-MA resistance:  This overlap into the previous range shows the market is not in a new impulsive downtrend. It also supports my belief that we are in a temporary sideways consolidation. I'm not totally convinced this Wave 4 is complete yet (there could be more sideways chop or a tag of the 0.382 before any notable move up) but the short term price action looks promising for bullish continuation past last week's high:  |
|
|
|
exstasie (OP)
Legendary
Offline
Activity: 1806
Merit: 1521
|
Another test of the 200-day MA! Almost time to break above it for good? I think so:  See how the market wicked below the downtrend line but strongly recovered? This is a textbook example of how "resistance becomes support":  Fellow analyst dragonvslinux points out a similar bullish dynamic based on volume support in his thread: https://bitcointalk.org/index.php?topic=5221059.0It really looks like Wave 5 is now commencing. Here's what a typical impulse might look like, with final targets in the $9,900-$10,350 range:  Bitcoin may be anything but typical, but I still have a hard time believing we can break through the $10K area without a significant pullback. |
|
|
|
exstasie (OP)
Legendary
Offline
Activity: 1806
Merit: 1521
|
|
January 29, 2020, 08:17:27 PM |
|
Buyers are looking really strong. All stair stepping, no pullbacks allowed so far. The 200-day MA was broken with a pretty authoritative candle close, a major long term victory for bulls:  You can also see a confirmed three white soldiers pattern, which is a very bullish candlestick formation. More on that: Three white soldiers is a bullish candlestick pattern that is used to predict the reversal of the current downtrend in a pricing chart. The pattern consists of three consecutive long-bodied candlesticks that open within the previous candle's real body and a close that exceeds the previous candle's high.
The three white soldiers candlestick pattern suggests a strong change in market sentiment in terms of the stock, commodity or pair making up the price action on the chart. When a candle is closing with small or no shadows, it suggests that the bulls have managed to keep the price at the top of the range for the session. Basically, the bulls take over the rally all session and close near the high of the day for three consecutive sessions. A typical example: 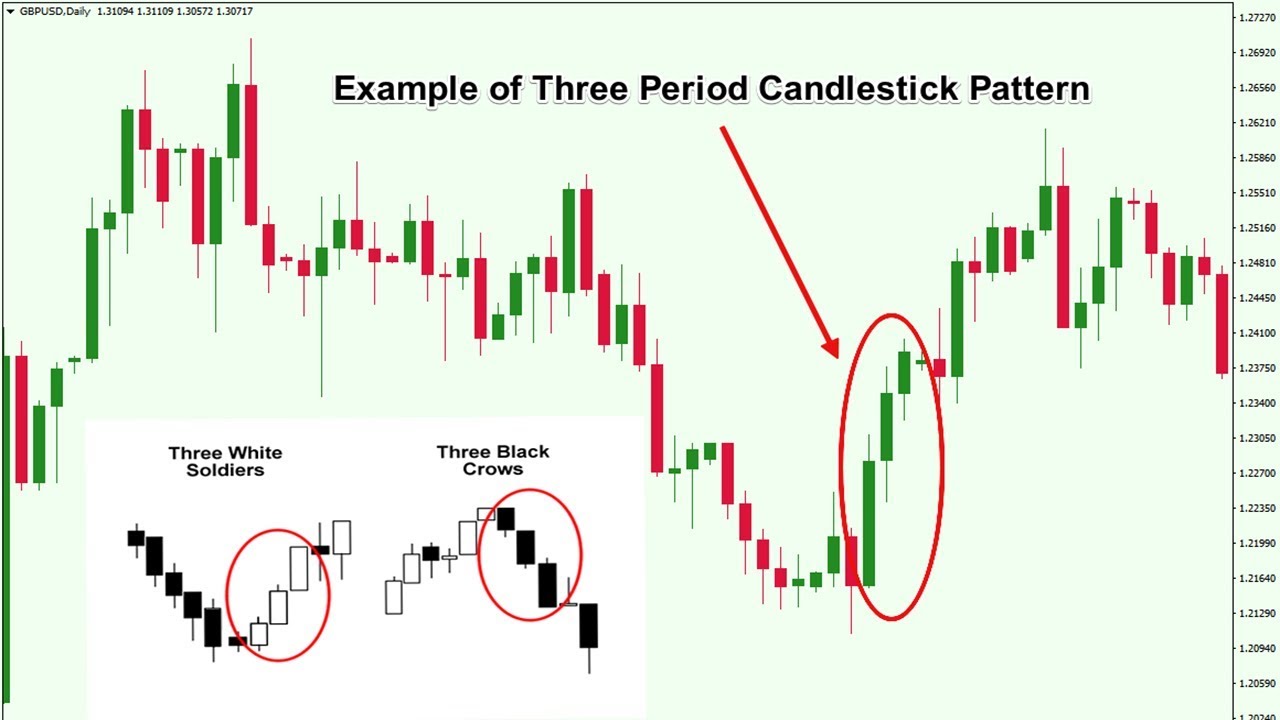 |
|
|
|
exstasie (OP)
Legendary
Offline
Activity: 1806
Merit: 1521
|
|
January 30, 2020, 09:15:51 PM |
|
Our Wave 5 is developing nicely. Quickly recovered wicks like this indicate lots of panic buying and very strong bullish momentum:  I do want to stress some caution here, though. Like David, I am expecting a pullback off the $10K+ area. I suspect bears will attempt a selloff from below the October 2019 pivot ($10,540 Coinbase or $10,350 Bitstamp) since it's such an important technical level.  We've already met all minimum expectations for this wave, so it's time to start thinking about profit taking. Although this wave could further subdivide (like that crazy (v) of 3 that went from $7,667 to $9,188) I am conservatively planning to close longs in the $10K area. This does not mean you should necessarily enter shorts.  Just a profit taking level. |
|
|
|
GuyFromBarcelona
Newbie
Offline
Activity: 25
Merit: 4
|
|
January 31, 2020, 10:12:44 AM |
|
Our Wave 5 is developing nicely. Quickly recovered wicks like this indicate lots of panic buying and very strong bullish momentum: https://i.imgur.com/ekdraqK.pngI do want to stress some caution here, though. Like David, I am expecting a pullback off the $10K+ area. I suspect bears will attempt a selloff from below the October 2019 pivot ($10,540 Coinbase or $10,350 Bitstamp) since it's such an important technical level. https://i.imgur.com/lutU0sF.pngWe've already met all minimum expectations for this wave, so it's time to start thinking about profit taking. Although this wave could further subdivide (like that crazy (v) of 3 that went from $7,667 to $9,188) I am conservatively planning to close longs in the $10K area. This does not mean you should necessarily enter shorts. Just a profit taking level. I also wait a pullback in the 10k area. The question is how big do you think will be. I think it could be just a small one and going fast to 10500-10600 or a moderate one to 9k-9,2k or 8,8k at much. There are a fucking lot of buying orders at 9,2 and 9, and in case going lower which I doubt, 8,8k is very strong again. An strong pullback to like 8k or so seems very unlikely to me. And for me an strong one would be a good thing because I just receive some money I can invest and could make a better entry. But I don't think I will be able to buy lower than 9075, where I currently have the order ready. In fact I think I should maybe put it higher. |
|
|
|
|
exstasie (OP)
Legendary
Offline
Activity: 1806
Merit: 1521
|
|
January 31, 2020, 11:27:30 AM |
|
 The Fear & Greed index is finally registering "greed" for the first time in a long time. Bitfinex longs are also up almost 18% over the last week. As a contrarian, this supports my feeling that we're nearing a local top. I also wait a pullback in the 10k area. The question is how big do you think will be. I think it could be just a small one and going fast to 10500-10600 or a moderate one to 9k-9,2k or 8,8k at much. There are a fucking lot of buying orders at 9,2 and 9, and in case going lower which I doubt, 8,8k is very strong again.
An strong pullback to like 8k or so seems very unlikely to me. $8K would just be a 50% pullback from here. Very normal in the early stages of a bull market. Look at the corrections in June-August 2016, January 2017, March 2017. These were deep 62%+ retracements of the previous wave. And that was in the throws of a bull market, so it wouldn't be out of the ordinary. I think the low $8,000s where the 20-week MA is may end up being a great target zone. This is one scenario I'm preparing for:  A 50-62% retracement would be typical, although it doesn't need to go that deep. This is just one idea. You may be right. The pullback may just go sideways and we may get no lower than the upper $8,000s. It's just too early to say; we need to see how the price action unfolds. If we see strong impulsive downside off the top, then a deep zig-zag shaped pullback to the lower $8,000s or upper $7,000s becomes more likely. |
|
|
|
oarmas
Newbie
Offline
Activity: 12
Merit: 9
|
|
February 01, 2020, 11:27:44 AM |
|
Hey exstasie, read your reply on David's page. Sorry, didn't realize you had your own. I'm going to try to post the image from trading view.
[img][https://www.tradingview.com/chart/GBTC/tcWPrQFK-Current-wave-analysis-of-GBTC/img]
|
|
|
|
|
exstasie (OP)
Legendary
Offline
Activity: 1806
Merit: 1521
|
|
February 01, 2020, 06:57:28 PM |
|
Thanks. That lines up with my thoughts from yesterday. Do you see that structure as a wedge, or a triangle? Do you have a higher degree count that shows how it fits into the bigger picture? I'm not sure I like the idea of giving GBTC precedence. So much less price data, so many gaps......it seems like spot charts should give us a more accurate picture. I still think the structure works best as a sub-dividing impulse: One thing is for sure: we don't want to rule out this scenario, especially just a few months before the halving. BTC and LTC have consistently rallied into past halving events. |
|
|
|
oarmas
Newbie
Offline
Activity: 12
Merit: 9
|
|
February 02, 2020, 05:23:32 PM |
|
Thanks. That lines up with my thoughts from yesterday. Do you see that structure as a wedge, or a triangle? Do you have a higher degree count that shows how it fits into the bigger picture?
You and I are off by one degree, with your count probably more correct, as I think we just started a supercycle 1 wave (SC1/P1/I1/M1/m1... using your minor wave 1). I'm using the BTC / GBTC IPO as the start of SC 0 Primary B wave (B ending in 2017), the way a lot of Elliotticians use the start of an IPO as a continuation trend like in Facebook (wave 2). I counted the wave last year as major 1 primarily because of the time it took (about 5 months Feb to July 2019), I like your interpretation better. I tend to look at that cycle as a Diagonal (M1/m1) / Triangle (M2/m2), primarily because of the length of time in correction tends to negate the impulse. Why am I doing it this way? Because GBTC and BTC disagree on the SC 0 low, with BTC in 2018 and GBTC in Feb 2019. Why is this significant? Primarily because with BTC I can interpret your i as an a your ii as a b, but your v as a c and your minor 2 as a d with us entering another diagonal five wave sequence to finish m1/M1 as an e (or a 5 wave impulse, if the subsequent correction stays above 7340 BTCUSD. I hope you can see the relationship between potential b and potential d with respect to the a / c designation.
Why do I use GBTC? It's simple, the Elliott wave works best with a time and price Fibonacci ratio. Time Fibonacci is relatively hard to define in a 24/7 market. You can use a 1 hour, 12 hour, 1 day and possibly 3w (=21 days) to align your parameters. The stock market is perfect Fibonacci time, with 30m (13 candles in one day), 4 hour (2 per day), 1 day, 1 week (5 days) and 1 month (21 days). Any one of these can be used to align a chart to compare price movement to time with both variables taking Fibonacci values. So, if a wave is a true impulse in the stock market, the time relationship for a correction is very easy to forecast with a small margin of error. You simply add the two longest times of consecutive decline in the rising wave and move them up one degree and you can more or less guess what the subsequent low date will be. Best example, an impulse with five falling days will predict a correction of 8 days. If the correction exceeds the predicted number of days, then the rising wave was NOT an impulse. This type of precision eludes me in 24/7 markets. Looking at the 12h BTC chart, I believe the time since 1/2 is looking like an impulse right now. Time will tell.
On GBTC, if the wave pans out the predicted rise is to 16.73 which is equivalent to BTC 15573 right now, assuming Grayscale doesn't do another BTC buy between now and the completion. The time frame is one month! We'll see, right. Sorry about the length of the post, but I'm trying to answer your questions with reasonable presentation. Again, I believe that last February, GBTC entered m OR M1 of I1 of P1 of SC1. Good luck with your trading.
|
|
|
|
|
|


