exstasie (OP)
Legendary

 Offline Offline
Activity: 1806
Merit: 1521

|
4-hour bullish divergences continue to pile up. Could this be a (bullish) falling wedge? We could easily see another undercut of the lows but the bearish momentum is pretty unimpressive so far. Daily Godmode continues to turn upwards towards the 50% level after a bullish signal cross with caution dots. Looking bouncy off this 20-week MA too:  We may end up disappointing those who are waiting for $8K and below. Looks like David is getting bullish too: S&P 500 futures are attempting a recovery (up 4% on the day) after pretty insane volume last Friday. If the stock market recovers this week, that's also good news for BTC bulls. |
|
|
|
|
|
|
|
|
Every time a block is mined, a certain amount of BTC (called the
subsidy) is created out of thin air and given to the miner. The
subsidy halves every four years and will reach 0 in about 130 years.
|
|
|
Advertised sites are not endorsed by the Bitcoin Forum. They may be unsafe, untrustworthy, or illegal in your jurisdiction.
|
|
|
dragonvslinux
Legendary
Offline
Activity: 1666
Merit: 2204
Crypto Swap Exchange
|
Bulls didn't follow through, so we're still waiting for signs of reversal from this downward pressure.  The MACD is signalling first signs of seller exhaustion. Still needs to confirm by the end of the day (without price dropping further), but worth keeping an eye on: Daily Godmode is showing the same, waning downward momentum. It could take a few more days to build out a reversal though. David is looking at March 2-5: https://bitcointalk.org/index.php?topic=5140701.msg53934955#msg53934955That's good to know, I haven't looked at too many other indicators that signal bearish exhaustion, probably it's something I should do to find more confluence. March 2nd-5th makes sense to me to confirm $8.5K as support, this would be the amount of time required to confirm a rounding bottom on smaller time-frame (1hr/4hr): Unlikely most analysts at the moment (it seems), I still don't believe we need to go lower to confirm a bottom, even if I see it as possibility. For me lower prices (above $7.5K) increases the chances of a low being found if it happens in the next few days. The more oversold this bull market correction lasts for, the stronger the bounce recovery imo.
I'm still bullish until proven otherwise  Me too. Bullish enough to buy the dip on spot anyway. I am not bullish enough to build a margin long position yet. Waiting for a good setup and clearer picture. Indeed, as I've reference elsewhere, I'm laddering into long positions with a pretty wide macro range. Definitely no time to be playing with margin indeed. |
|
|
|
exstasie (OP)
Legendary
Offline
Activity: 1806
Merit: 1521
|
The daily chart is turning bullish. Yesterday's candle printed as a bullish engulfing, a typical reversal signal at the end of a downtrend. See the green arrows for other examples of bullish engulfing candles since January:  The aqua arrows on Godmode show times where a bullish signal cross coincided with the histogram moving above the 50% level. This is a very powerful signal. Another one just printed yesterday. You may notice the only failed bullish engulfing on the chart (February 18th) did not coincide with bullish Godmode conditions. This time, bulls are in much better shape: - 20-week MA ($8,400) tested as support
- 200-day MA ($8,750) broken as resistance
- Daily bullish engulfing
- Bullish daily Godmode
- Stock market recovery
|
|
|
|
El duderino_
Legendary
Offline
Activity: 2492
Merit: 11998
BTC + Crossfit, living life.
|
 |
March 03, 2020, 10:00:38 AM |
|
^
Damn i'm at 50 send merit in 30 days period again.... so +merit for last post, will send later
|
XhomerX10 designed my nice avatar HATs!!!!! Thanks Bro
|
|
|
dragonvslinux
Legendary
Offline
Activity: 1666
Merit: 2204
Crypto Swap Exchange
|
|
March 03, 2020, 10:40:28 PM
Last edit: September 10, 2023, 01:56:51 PM by dragonvslinux |
|
The daily chart is turning bullish. Yesterday's candle printed as a bullish engulfing, a typical reversal signal at the end of a downtrend. See the green arrows for other examples of bullish engulfing candles since January: 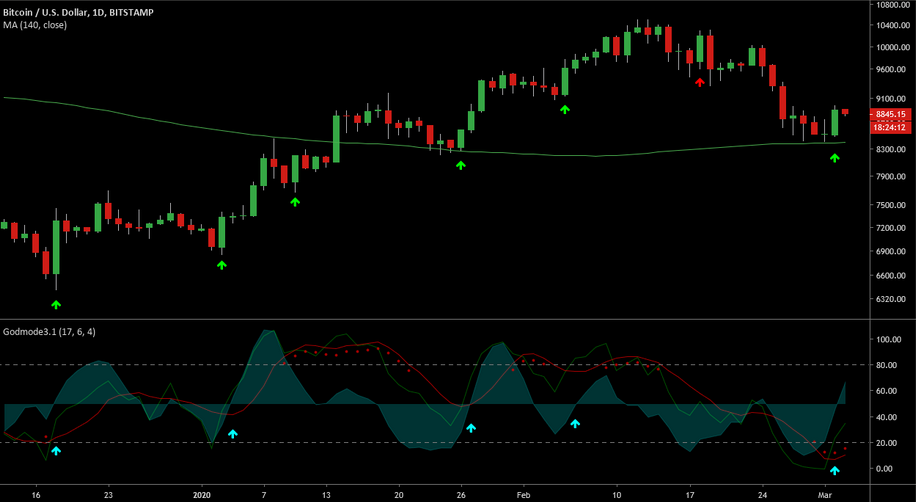 The aqua arrows on Godmode show times where a bullish signal cross coincided with the histogram moving above the 50% level. This is a very powerful signal. Another one just printed yesterday. You may notice the only failed bullish engulfing on the chart (February 18th) did not coincide with bullish Godmode conditions. This time, bulls are in much better shape: - 20-week MA ($8,400) tested as support
- 200-day MA ($8,750) broken as resistance
- Daily bullish engulfing
- Bullish daily Godmode
- Stock market recovery
Liking your update. I generally look at different indicators than you it seems, so it's always great to see from your analysis you also see the case for bouncing back I don't have much to add*, apart from things are looking good on smaller time-frame. I would prefer price tested the bottoming curve, instead of continuing to move in parabolic fashion that could result in a harsh rejection from $9K+ levels. I already tried moving it to include current local support, but doesn't fit btw.  I'll reserve my concerns for a potential bearish macro head & shoulders pattern when it's nearer. But also bullish is bullish, so not going to argue with it  *Edit: *Edit: Currently testing the 61.8 fib retracement level from the $6.4K to $10.5K move, after finding support from the 0.5, courtesy of strong volume support:  |
|
|
|
exstasie (OP)
Legendary
Offline
Activity: 1806
Merit: 1521
|
|
March 04, 2020, 07:00:58 PM |
|
Liking your update. I generally look at different indicators than you it seems, so it's always great to see from your analysis you also see the case for bouncing back I don't have much to add*, apart from things are looking good on smaller time-frame. I would prefer price tested the bottoming curve, instead of continuing to move in parabolic fashion that could result in a harsh rejection from $9K+ levels. I already tried moving it to include current local support, but doesn't fit btw. Seems we're taking the slow and (hopefully) steady route. No follow through on the March 2nd bullish engulfing yet. In Wyckoffian terms, we've seen a bullish "spring" but have yet to see a "sign of strength" that confirms it yet. Hoping to see an attack on the local highs relatively soon before the spring begins to look like a failure. Here is a potentially bearish count. I would like to see a convincing break above this potential channel aimed at the $8K area, to help rule it out:  That 4-hour OBV isn't too encouraging. I still stand by dip buying the 20-week MA on spot, but there is no easy long here. David is still considering a run below $8K. Unfortunately we can't rule these scenarios out until bulls actually make their move. "Near the bottom" and "the bottom is in" are both distinct possibilities. |
|
|
|
dragonvslinux
Legendary
Offline
Activity: 1666
Merit: 2204
Crypto Swap Exchange
|
|
March 04, 2020, 10:34:09 PM |
|
On the 1hr, this level looks like the level to bounce from to continue rounding bottom formation, or otherwise continue forming wyckoff falling lower to re-test 50 Week MA. Obviously not ruling out sub $8K yet, but also not seeing any signs that we will drop below $8.2K either. Needing more confirmation for sure.  Closing the Daily above the 200 Day MA for the third consecutive candle would be bullish though, as well as negating the 3 previous candles that closed below in my mind. |
|
|
|
exstasie (OP)
Legendary
Offline
Activity: 1806
Merit: 1521
|
|
March 05, 2020, 06:39:41 AM |
|
Here is a potentially bearish count. I would like to see a convincing break above this potential channel aimed at the $8K area, to help rule it out:
The market broke above that potential bearish channel. We are now on watch for this inverse H&S:  We're close to confirming that bullish engulfing from a few days ago. Bitfinex needs to breach $8,990. Curious to see how price interacts with the overhead 20-day and 50-day MAs:  |
|
|
|
dragonvslinux
Legendary
Offline
Activity: 1666
Merit: 2204
Crypto Swap Exchange
|
|
March 05, 2020, 10:41:22 AM
Last edit: September 10, 2023, 01:54:55 PM by dragonvslinux |
|
Here is a potentially bearish count. I would like to see a convincing break above this potential channel aimed at the $8K area, to help rule it out:
The market broke above that potential bearish channel. We are now on watch for this inverse H&S:  From a rounding bottom perspective (with same target as inverse H&S), we've definitely popped and closed an hourly candle above the neckline  I make the measured move target of around 6% to $9.5K, but this will vary on different time-frames depending on how you like to draw 
If we move above the 61.8, the next level of fib resistance (0.786) would be $9628 Now moving above the 61.8 fib with some decent bullish price action on smaller time-frames. Daily RSI is bouncing from 40 (avoiding bearish price strength) while the CMF is more or less neutral. There's some nice confluence between the VPVR point of control and the 200 Day MA from the past 6 months, indicating building a new support base around the $8,700 level.  |
|
|
|
exstasie (OP)
Legendary
Offline
Activity: 1806
Merit: 1521
|
|
March 06, 2020, 10:24:35 PM |
|
We got that inverse H&S breakout. The volume and momentum was not too impressive, but consolidating above the neckline (~$9K) is bullish:  The S&P 500 went on a fishing expedition, probably to form a higher low, which may have affected BTC's momentum. I'm actually really impressed that BTC remained so strong given the carnage in stocks the past few days:  Fear about the rug getting pulled out from underneath world markets is tangible. Everyone is nervous, waiting to see what the market does. I still think both BTC and equities will be uptrending come late March. |
|
|
|
exstasie (OP)
Legendary
Offline
Activity: 1806
Merit: 1521
|
Looks like a bullish triangle. Here's a potential count:  We've got the 20-day and 50-day MAs and that aqua channel top clustered in the $9,300s area. We've also got pivots and a high volume zone there too, as seen here:  So there is big resistance overhead. There is also EW to consider. As a rule, third waves cannot be the shortest wave in an impulse. Wave (iii) was shorter than Wave (i), meaning Wave (v) must be shorter than Wave (iii). That means at a maximum we would expect the $9,500s. A wick to $9,400 and back down would probably be typical though considering all the overhead resistance there and the current lack of bullish momentum. We may be building up a larger sideways base before an exponential rise in late March or early April. ETHBTC showing some life again, which supports the bullish case for BTC. Let's see if we can't get this old count back on track:  |
|
|
|
dragonvslinux
Legendary
Offline
Activity: 1666
Merit: 2204
Crypto Swap Exchange
|
|
March 07, 2020, 11:00:40 AM
Last edit: September 10, 2023, 01:54:47 PM by dragonvslinux |
|
Looks like a bullish triangle. Here's a potential count:  Well spotted, the mid-level of the unconfirmed bullish channel drew this triangle for me However, I see it as more of a purely bullish ascending triangle with horizontal resistance around $9180 (with my permabull bias):  Depending on when/if the breakout occurs, the target would be around $9.3-$9.4K, which would help to invalidate the larger potential bearish head & shoulders pattern that many speculators are nervous about at current prices (a potential right shoulder). A lot of volume building up around $9,100 is becoming very noticeable and promising too, which is close to shifting the local point of control up another leg from $8700. I still don't see any confirmed bearish case at the moment, at least not yet, only bullish. |
|
|
|
exstasie (OP)
Legendary
Offline
Activity: 1806
Merit: 1521
|
|
March 07, 2020, 10:12:10 PM |
|
Sigh, this is the problem with triangles. The thrust is so unpredictable. Reminds me of this failure from January. Ugly reversal candle on relatively high volume:  The above count is still in play, with related Fibonacci levels labeled. A 0.618 retracement would align with a 200-day MA retest near $8,700. The daily chart shows we bounced off the 20-day MA. Unless bulls rally significantly into the daily close this will print a bearish engulfing:  |
|
|
|
exstasie (OP)
Legendary
Offline
Activity: 1806
Merit: 1521
|
The above count is still in play, with related Fibonacci levels labeled. A 0.618 retracement would align with a 200-day MA retest near $8,700. The daily chart shows we bounced off the 20-day MA. Unless bulls rally significantly into the daily close this will print a bearish engulfing: The bearish engulfing printed and confirmed. The bullish count mentioned above is dead. The 200-day MA did not provide any support. Unfortunately, on top of the factors mentioned yesterday, the short term picture remains bearish. We are back to targeting $8K and below until further notice. The structure now looks like a zig zag. I wouldn't be surprised at something like this:  The bullish forecast for late March and April has not changed. We are still waiting for an inflection point marking the Minor Wave 2 bottom, as seen here. We may need to run a bit deeper and endure some more pain first but I would still consider this a shakeout. |
|
|
|
exstasie (OP)
Legendary
Offline
Activity: 1806
Merit: 1521
|
Many analysts have been speculating about the CME gap left in January: In other words "the gap must be filled before we can go up!" Well the gap has now been filled with yesterday's low of $7,640. This chart is probably worth cross-posting, since the market has now reached a potential reversal area:  There are 3 things to pay attention to on this chart. Most importantly, we have the December 2019 pivot at $7,693. This monthly resistance was broken to the upside in January. Let's test the idea that "resistance becomes support." Next, the market has now reached the 0.705 retracement of the December-February bull market. Old school crypto traders are probably familiar with ICT and Brian Beamish and their use of the "Optimal Trade Entry" zone. This is the 0.618 - 0.786 Fibonacci retracement zone. The 0.705 is often a sweet spot for price reversals, so I'm looking for a reaction off this area. I don't normally track the 60-week MA, but it's very interesting to see how price reacted with it in November-December last year. It provided support 4 times on the weekly chart before the January uptrend began. The market has just now tagged it again. So........is there blood in the streets yet? The Fear & Greed index suggests we are close. It's plunged down to 17: https://alternative.me/crypto/fear-and-greed-index/ |
|
|
|
dragonvslinux
Legendary
Offline
Activity: 1666
Merit: 2204
Crypto Swap Exchange
|
|
March 10, 2020, 12:02:28 AM
Last edit: September 10, 2023, 01:53:23 PM by dragonvslinux |
|
Yes, there's been enough blood, even if there could be a little more. Anymore than that, price could be in serious trouble, but the probability of this remains low: Similar to December 2019, we reached a couple of hundred dollars from the lower support trend of the logarithmic growth curve (currently at $7413 as of 10/03). This is otherwise known as the adoption s-curve. 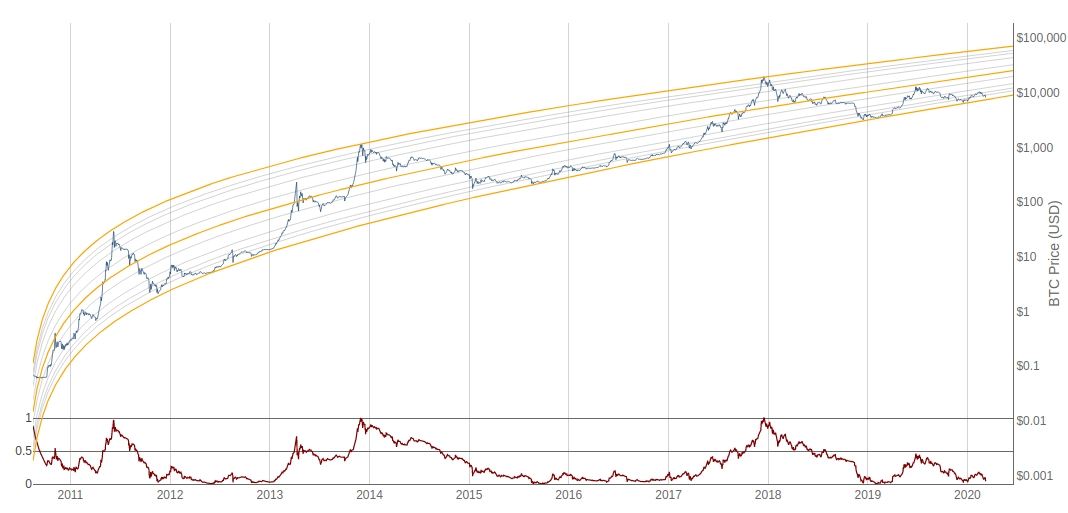 Despite all the bearish sentiment and indicators, the Daily close was bullish: longer wick at the bottom showing strong buying with high volume:  Remember the 6-month bear channel, bull flag? We re-tested that level and finally found some buyers |
|
|
|
exstasie (OP)
Legendary
Offline
Activity: 1806
Merit: 1521
|
|
March 11, 2020, 08:38:32 AM |
|
I was taking a closer look at the weekly chart:  The Godmode histogram is beginning to show unconfirmed hidden bullish divergence. See the aqua arrows for previous examples. https://www.babypips.com/learn/forex/divergence-cheat-sheetConnorsRSI (a pretty effective mean reversion indicator) is also reaching oversold levels. Taken together, both of these signals indicate that a bounce is coming soon. They don't strongly distinguish between "just a bounce" and continuation of the December-February uptrend, but......baby steps. Every bottom begins with a bounce. |
|
|
|
buwaytress
Legendary
Offline
Activity: 2786
Merit: 3437
Join the world-leading crypto sportsbook NOW!
|
|
March 11, 2020, 12:46:48 PM |
|
ConnorsRSI (a pretty effective mean reversion indicator) is also reaching oversold levels.
Taken together, both of these signals indicate that a bounce is coming soon. They don't strongly distinguish between "just a bounce" and continuation of the December-February uptrend, but......baby steps. Every bottom begins with a bounce.
Coming together nicely, I would say, even aligning with dragonv's log charts + oversold indicator (by means of Greed index). Unlike there, I'm still not convinced we've seen the year's bottom yet, though. Still a lot of irrational panic seeping through to bitcoin markets, I think there's still room to halving for us to see more selling against logic, so the strength of bounce should correspond, if/when it comes. |
|
|
|
exstasie (OP)
Legendary
Offline
Activity: 1806
Merit: 1521
|
|
March 11, 2020, 09:27:29 PM |
|
ConnorsRSI (a pretty effective mean reversion indicator) is also reaching oversold levels.
Taken together, both of these signals indicate that a bounce is coming soon. They don't strongly distinguish between "just a bounce" and continuation of the December-February uptrend, but......baby steps. Every bottom begins with a bounce.
Coming together nicely, I would say, even aligning with dragonv's log charts + oversold indicator (by means of Greed index). Unlike there, I'm still not convinced we've seen the year's bottom yet, though. Still a lot of irrational panic seeping through to bitcoin markets, I think there's still room to halving for us to see more selling against logic, so the strength of bounce should correspond, if/when it comes. Certainly. BTC tends to surprise everyone in both directions. In the short term, I've been waiting for another undercut of the lows. A rejection of new lows and a spring back into the previous range would show seller exhaustion. I believe we may be seeing that now with these hammer/dragonfly candles on the 4H and daily charts, along with bullish divergences:   I've got my fingers crossed for strong 4H and daily closes in ~3 hours. Tentatively I would say momentum is turning bullish on multiple higher time frames. Given that we're coming off fairly obvious support levels, a reversal is brewing. If you're holding shorts, be careful! The 4H, daily, and weekly time frames are all lining up for a bounce, or possibly a very powerful rally. |
|
|
|
El duderino_
Legendary
Offline
Activity: 2492
Merit: 11998
BTC + Crossfit, living life.
|
|
March 12, 2020, 10:42:37 AM |
|
not bouncing yet |
XhomerX10 designed my nice avatar HATs!!!!! Thanks Bro
|
|
|
|


