|
TPTB_need_war
|
 |
February 18, 2016, 11:51:28 AM |
|
Meh, sorry, but banning or not, chinese miners or not, bitcoin will stay, and nobody nor nothing will ever control it but greed.
Follow the link dude. China's miners already vetoed any block size increase. They are in control. You are just blowing nonsense out of your mouth. (nothing personal man, I like you, just telling you how it is) |
|
|
|
|
|
|
"Bitcoin: mining our own business since 2009" -- Pieter Wuille
|
|
|
Advertised sites are not endorsed by the Bitcoin Forum. They may be unsafe, untrustworthy, or illegal in your jurisdiction.
|
tabnloz
Legendary

 Offline Offline
Activity: 961
Merit: 1000

|
|
February 18, 2016, 11:52:13 AM |
|
Looks like yet another charlatan
January 15, 2016, 05:02:04 PM
5. Absolute high in real estate in 2007 - wrong
January 17, 2016,
It shows the peak at 2007.15 and then a decline to 2033. And the reality is real estate now is way higher than 2007 levels almost everywhere. Look at what is going on in San Francisco, LA, New York
You just posted a chart that contradicts your earlier assertions and shows MA to be correct in the US market. |
|
|
|
|
sloanf
Jr. Member
 Offline
Activity: 64
Merit: 1
|
|
February 18, 2016, 12:52:29 PM |
|
Looks like yet another charlatan
January 15, 2016, 05:02:04 PM
5. Absolute high in real estate in 2007 - wrong
January 17, 2016,
It shows the peak at 2007.15 and then a decline to 2033. And the reality is real estate now is way higher than 2007 levels almost everywhere. Look at what is going on in San Francisco, LA, New York
You just posted a chart that contradicts your earlier assertions and shows MA to be correct in the US market. Where exactly, be specific How many times do we have to go through this? As with everything else, as we have seen above, you are not able to get things from the first/second/third time. Ok, lets do it again. That real estate picture that MA claims to have drawn in 1979 uses the Case-Shiller home price index. Back then there was nothing like internationally inflation adjusted value and nowhere was it mentioned by MA or anybody. He started to exploit this trick relatively recently when it became obvious that he failed yet another of his numerous predictions so he had to cover his ass by making it up. Interestingly, he uses that IIM trick on real estate because, as he argues, real estate attracts global money but at the same time he does not use IIM when he makes predictions on the Dow, Gold, Nikkei and so on (which also attract global capital). Now, if you compare the index and the picture, youll easily find out that they do not match (put it mildly). First, the index had been rising without any drop up until 2006 (the MAs graph predicted drops after every 8.6 years). Second, the absolute high according to MA should have been reached in 2007.15, but in reality the S&P Case-Shiller topped in 2006 https://research.stlouisfed.org/fred2/series/CSUSHPINSA, http://www.spindices.com/index-family/real-estate/sp-case-shiller, and the original Case-Shiller topped in 2005 http://www.econ.yale.edu/~shiller/data.htmThird, the index significantly recovered and keeps rising, contrary to what MA predicted. Here is another dirty trick that MA used. When real estate picked he did not say anything. Only after the crisis hit and real estate plunged he came out and claimed that hed predicted the top. Not only that, he claimed that he predicted the top to the day referencing to (wait!) the S&P Reit index. Again, there was nothing about internationally inflation adjusted value or any of such bs. But wait, theres more. The S&P Reit includes not only home RE, but everything else such as residential, office, health-care, hotels, etc. In other words, from very beginning he used the Case-Shiller (only home RE). Then when it didnt work out, he switched to the S&P Reit which tracks all RE, and now he switches again by bs people with a new trick called internationally inflation adjusted value. I am curious to see what else is he going to come up with when his post-2015 forecast eventually fails. |
|
|
|
|
|
TPTB_need_war
|
|
February 18, 2016, 01:32:01 PM |
|
MA has been using international capital flows and internationalized value since the 1970s when he picked the top in gold using it.
He has been emphasizing that "international" aspect to his analysis every since.
sloanf is like the drunk troublemaker who arrives late to French class, hears someone speak in English, and thinks he was in English class. Then forever refuses to admit he was really in French class while slandering all the students in the classroom asserting they are fools for following this charlatan teacher who claims to be a French teacher and is really just bluffing (i.e. changing his tune from English because sloanf challenged him).
The insane student ends up in the classroom all by himself because everyone else just leaves him there to rant to himself. The police eventually show up and put him in a straight jacket and cart him off to a mental institution.
|
|
|
|
tabnloz
Legendary
Offline
Activity: 961
Merit: 1000
|
|
February 18, 2016, 02:31:11 PM |
|
Looks like yet another charlatan
January 15, 2016, 05:02:04 PM
5. Absolute high in real estate in 2007 - wrong
January 17, 2016,
It shows the peak at 2007.15 and then a decline to 2033. And the reality is real estate now is way higher than 2007 levels almost everywhere. Look at what is going on in San Francisco, LA, New York
You just posted a chart that contradicts your earlier assertions and shows MA to be correct in the US market. Where exactly, be specific How many times do we have to go through this? As with everything else, as we have seen above, you are not able to get things from the first/second/third time. Ok, lets do it again. That real estate picture that MA claims to have drawn in 1979 uses the Case-Shiller home price index. Back then there was nothing like internationally inflation adjusted value and nowhere was it mentioned by MA or anybody. He started to exploit this trick relatively recently when it became obvious that he failed yet another of his numerous predictions so he had to cover his ass by making it up. Interestingly, he uses that IIM trick on real estate because, as he argues, real estate attracts global money but at the same time he does not use IIM when he makes predictions on the Dow, Gold, Nikkei and so on (which also attract global capital). Now, if you compare the index and the picture, youll easily find out that they do not match (put it mildly). First, the index had been rising without any drop up until 2006 (the MAs graph predicted drops after every 8.6 years). Second, the absolute high according to MA should have been reached in 2007.15, but in reality the S&P Case-Shiller topped in 2006 https://research.stlouisfed.org/fred2/series/CSUSHPINSA, http://www.spindices.com/index-family/real-estate/sp-case-shiller, and the original Case-Shiller topped in 2005 http://www.econ.yale.edu/~shiller/data.htmThird, the index significantly recovered and keeps rising, contrary to what MA predicted. Here is another dirty trick that MA used. When real estate picked he did not say anything. Only after the crisis hit and real estate plunged he came out and claimed that hed predicted the top. Not only that, he claimed that he predicted the top to the day referencing to (wait!) the S&P Reit index. Again, there was nothing about internationally inflation adjusted value or any of such bs. But wait, theres more. The S&P Reit includes not only home RE, but everything else such as residential, office, health-care, hotels, etc. In other words, from very beginning he used the Case-Shiller (only home RE). Then when it didnt work out, he switched to the S&P Reit which tracks all RE, and now he switches again by bs people with a new trick called internationally inflation adjusted value. I am curious to see what else is he going to come up with when his post-2015 forecast eventually fails. Specifically the part where you said an absolute high in 2007 was wrong and that real estate was way higher everywhere. You linked to the Case Shiller index, which shows RE has yet to exceed the 2007 peak. Therefore real estate is not way higher everywhere and 2007 is the current peak. But you make a confused argument: after linking to CSI you said MA used case shiller from the beginning but changed when it didnt work out. Yet, I just showed that the CSI backs up his ECM chart, so which is it? The bolded parts are exactly what MA predicted (ie to pick up - not however to exceed the previous peak), but now its a dirty trick that you think he didn't say anything about being correct? As I interpret it, Feb 07 date was a turning point. It just so happened to mark the top in the price of the RE focused REIT. And you also make the point that the CSI ramps up while the ECM model drops every 8.6 years. Again, here is another article that shows correlation http://moneyweek.com/is-the-uk-property-market-facing-an-18-year-slump/"The cycle is by no means perfect. But 2012 did kind of mark the point at which London started to go bananas. His 2007 high coincided with the top in UK property. 1998 was a take-off point. 1989 was a high (before the bear market of 1989-94). 1981 was a take-off point, and so on." |
|
|
|
|
sloanf
Jr. Member
Offline
Activity: 64
Merit: 1
|
|
February 18, 2016, 04:08:14 PM |
|
Specifically the part where you said an absolute high in 2007 was wrong and that real estate was way higher everywhere. You linked to the Case Shiller index, which shows RE has yet to exceed the 2007 peak. Therefore real estate is not way higher everywhere and 2007 is the current peak.
Ok, lets examine this carefully. When I talked about LA, London, Hong-Kong, etc. back then I didnt know which metrics MA used for his chart (proof): Lets take a look at this picture again http://s3.amazonaws.com/armstrongeconomics-wp/2012/08/realestate-cycle.jpg Since 1955, from which the graph begins, to 1979, when it was first created (claimed to be created, to be precise), there must have been some metric MA used to measure real estate dynamics, right? And it wasnt the S&P Reit index, because there was no S&P Reit index back then, ok? So you cant use it or any other metric that was developed later to argue that the forecast is correct. so I was talking about those locations as obvious examples where top segments of home RE did exceed the 2006-2007 peak. Later when it became clear that MA used the CS home price index, I looked at it and shared my observations in the post I quoted earlier. Yes, the CSI overall has not yet exceeded the high. Only premium segments of it and most notably in such places like San Francisco, LA, and New York, but nationwide is slightly below the high.
But you make a confused argument: after linking to CSI you said MA used case shiller from the beginning but changed when it didnt work out. Yet, I just showed that the CSI backs up his ECM chart, so which is it?
The bolded parts are exactly what MA predicted (ie to pick up - not however to exceed the previous peak), but now its a dirty trick that you think he didn't say anything about being correct?
The CSI peaked in July 2006 (184.62), not in 2007.15, as MA predicted. The latest value 175.71 is the highest since Oct 2007. Here but since you havent read it apparently, let me read it for you. Here (the report is dated Oct10, 2008) http://www.armstrongeconomics.com/wp-content/uploads/2012/03/its-just-time-martin-armstrong.pdf MA says gold is likely to go to $2,500 or jump beyond even $5,000. By the way, he also says this The reaction should have been to the downside into 2008, with a consolidation into early 2009, but another serious decline is still possible going into June 13th, 2011. Do not expect the real estate markets to recover by much. All turned out to be false. MA says Do not expect the real estate markets to recover by much. His chart shows 2015.75 is well below 2007.15 yet the CSI is only 9 points below the high and keeps rising. So are you saying that MA prediction was right? And how the CSI backs up his ECM chart if during 1955-2007 the CSI never had any drop contrary to the MA chart with drops every 8.6 years? As I interpret it, Feb 07 date was a turning point. It just so happened to mark the top in the price of the RE focused REIT. And you also make the point that the CSI ramps up while the ECM model drops every 8.6 years. Again, here is another article that shows correlation http://moneyweek.com/is-the-uk-property-market-facing-an-18-year-slump/"The cycle is by no means perfect. But 2012 did kind of mark the point at which London started to go bananas. His 2007 high coincided with the top in UK property. 1998 was a take-off point. 1989 was a high (before the bear market of 1989-94). 1981 was a take-off point, and so on." This article is totally irrelevant because the CSI and therefore the MA chart is about the US RE whereas the article is about the UK RE. Again, you dont need articles or someones opinions, just work with sources https://research.stlouisfed.org/fred2/series/CSUSHPINSA. Top in July 2006 (184.62), instead of 2007.15. Constant rise 1955-2006 instead of drops every 8.6 years. Now its just slightly below the highs at 175.71 and rising instead of Do not expect the real estate markets to recover by much. |
|
|
|
|
|
TPTB_need_war
|
|
February 18, 2016, 06:26:59 PM |
|
There is that blind lunatic sloanf again screaming at the French teacher. Even a dumbass could look at this chart and realize that if population and building costs are rising, then price should be rising. They see price is not rising so thus it must make sense the rise was occurring in the appreciation of the dollar. Duh.  QUESTION: Mr. Armstrong, your real estate cycle turned up from 1955. It does not match the Case-Shiller index which peaked in 1890s and bottomed in 1920 and then began to rally after 1940 into the 1955 period. Something seem strange with that index given the huge Florida real estate bubble which burst in 1927. Can you explain why the Case-Shiller seems to be off so much? Here is a chart that has been going around the Web. Thanks  ANSWER: This is the typical problem with people creating an index and then trying to extend it back in time. They ALWAYS ignore the currency and project purely a domestic view. During the 1890s, J.P. Morgan had to bail out the U.S. Treasury for it was dead broke. As people feared the government would declare bankruptcy, private assets rose in NOMINAL terms. This was matched by the massive exit of foreign capital from the USA. The Case-Shiller index bottoms in 1920, but this was the point of a massive rise in the dollars value. Foreign capital poured into the USA to park because of World War I. This, in turn, led to wild speculation in Florida, which as you correctly stated, burst in 1927. Because rhis isdex is national, it also suppresses regional booms. As real estate peaked in Florida, the hot money then shifted to stocks creating the Phase Transition into 1929. It was this capital flows between asset classes into stocks where that concentration led to the 1929 bubble. The Case-Shiller index, which suddenly rose from the Great Depression, does not take into account the dollar devaluation that sparked that rise as it did in equities. That was virtually a 60% devaluation of the dollar that moved it from $20 to $35 on a gold standard by FDR. Was that rise real or currency related? Sorry, the real rise begins post-war from 1955. That was the real housing boom. The Case-Shiller does not accurately reflect the changes in currency. One must look at everything in terms of international value before they can see if they really made money or just broke even because the currency declined. From a value perspective, the 1929 high was more than three times that of the 1890s. So the high of the 1890s was purely a rise due to the collapse in the dollar; it was the hallmark of the panic of 1893 and was best expressed in Grover Clevelands speech before Congress. |
|
|
|
|
TPTB_need_war
|
|
February 19, 2016, 03:12:28 PM
Last edit: February 19, 2016, 04:54:26 PM by TPTB_need_war |
|
This really is a pointless
Only to someone who isn't paying attention to what is really going in the world that is oblivious to most (see below). Whereas, it has helped me greatly to decide how to launch a coin wherein it will be legal every where. Which is very important compared to those coins which may run into trouble later, such as Ethereum and Zcash (assuming Zcash continues with their plan to have miners act as money transmitters to the foundation). Note the issues I raised in this thread may not apply for those coins that never reach some level of millions of adoption, if they are no threat to the powers-that-be and haven't caused anger among investors. You're trying to second guess what regulators will do in each country by reference to America?
https://www.armstrongeconomics.com/world-news/taxes/2017-the-year-from-political-hell/https://www.armstrongeconomics.com/world-news/2017-is-coming-and-the-g20-has-agreed-to-share-all-info-on-everyone/https://www.armstrongeconomics.com/world-news/swiss-to-give-up-everything-everybody/https://www.armstrongeconomics.com/international-news/western_europe/britain-to-ban-any-encryption-that-prevents-the-taxman-from-exposing-british-citizens/https://www.armstrongeconomics.com/international-news/western_europe/uk-to-ban-whatsapp-messaging-service/https://www.armstrongeconomics.com/world-news/larry-summers-calls-to-end-100-billis-here-comes-the-totalitarian-state/https://www.armstrongeconomics.com/world-news/taxes/the-new-age-of-economic-totalitarianism-the-london-meeting-to-end-currency/https://www.armstrongeconomics.com/world-news/nsa-blames-snowden-for-paris/https://www.armstrongeconomics.com/world-news/nsa-a-tax-economics-espionage-agency/https://www.armstrongeconomics.com/category/world-news/taxes/http://www.nestmann.com/http://www.nestmann.com/best-place-to-launder-money-surprisinglyhttp://www.nestmann.com/theyre-coming-for-your-cashhttp://www.independent.co.uk/news/world/asia/china-has-made-obedience-to-the-state-a-game-a6783841.htmlhttp://theantimedia.org/china-just-launched-the-most-frightening-game-ever-and-soon-it-will-be-mandatory/At G20 last year, all governments agreed to report everyone everywhere to their host countries for tax purposes. The hunt for taxes is destroying the world economy at a staggering rapid pace and this is far worse than even I had anticipated when we first forecast BIG BANG would hit 2015.75 back in 1985. Here is a email a non-US citizen received from his trust company in Malta. The reporting charges have arisen due to the implementation of new U.S legislation known as the Foreign Account Tax Compliance Act (FATCA) which has been introduced as part of a global initiative to create an International tax reporting regime. Together with the majority of the Worlds major trading nations, the Maltese Government has entered into an agreement with the US Authorities to implement FATCA legislation in Malta. The legislation has required all Trust Companies in Malta to evaluate all structures operated on behalf of clients and categorise them according to detailed rules set out in the FATCA legislation. This categorisation process is not just limited to structures operated on behalf of US clients, or clients holding US assets but has to include all clients and structures irrespective of where clients and their structures are domiciled. We can advise you that <Name> has taken extensive legal and tax advice regarding the categorisation of clients and which information should be reported according to various trigger reporting events since our accounting and client management systems have to be tailored to supply relevant information on a per client and <Name> entity basis to the Malta Authorities who then report directly to the IRS.
Consistent with many other Trust Companies a decision has been taken to pass on some of the costs of this work to client structures for whom we act. Accordingly a December invoice will be issued for a one off fee of £250 that will be described in the invoice as a FATCA classification fee.
The dollar rally and the devaluation of the yuan is not a fluke and it most certainly is not a one-time event. The dollar declined against the yuan for 19 years during the same timing that saw gold decline from 1980 to 1999. The major low on an annual closing basis at 2013 and 2014 was an outside reversal to the upside for the dollar. The Yearly Bullish Reversal stands at 683 and technical resistance stands at 658. The dollar filled the gap that existed prior to 1994 and is yet another confirmation that the dollar rally is underway.
Yes, the world trade is contracting and will get much worse after October. Governments are destroying the world economy on their hunt for taxation. Politicians are hunting money as if it were some sport and are undoing everything that was built postwar. Numerous reports are coming in to us about people traveling on trains and having their bags searched for money in Europe. The hunt for cash is wiping out the world economy. Americans are being thrown out of banks and mutual funds everywhere. FATCA has forced Americans to repatriate dollars. The only real Americans who can operate overseas are now established multinational companies. Small companies cannot expand from the United States nor can individuals send money anywhere.
Add to FATCA the problem in Europe and we see capital still pouring into the USA from both China and Europe. The real estate cycle has/or will peak with this turning point around the world from Switzerland, Britain, Canada, to Asia right down into India and Australia. We are plagued by politicians who have absolutely no clue how to run an economy and it is now all about them retaining power virtually everywhere we look.
The dollar rally is unfolding despite the fact people do not understand why. They look only at the USA debt and assume the dollar must crash, when in fact, the problem we face is on a global scale and $18 trillion in U.S. debt is simply not the large enough for international capital to hide. The future is going to be anything but a textbook move. This is why this years World Economic Conference is going to be a real eye opener.
|
|
|
|
OROBTC (OP)
Legendary
Offline
Activity: 2912
Merit: 1852
|
|
February 20, 2016, 05:44:38 AM |
|
... Martin warming up a wee bit to gold, it's just one paragraph so I copy 'n' paste it below (blue highlighting mine): "While government may see gold as a barbaric relic of monetary history, it still will serve as a hedge against them from the private individual side. Our biggest problem is the hunt for money. They are of the opinion that it is not their fiscal mismanagement that is causing the instability, but rather it is that we have money that they see as theirs. This is the classic battle between public and private that I have warned about. You may not be able to travel with gold anymore as they close the corral and try to slaughter us for money. History still demonstrates that they will collapse, and that is when gold will provide its historically based purpose as the hedge against government. It is not a hedge against inflation nor will it track with the increase in money supply. It is driven by confidence and the lack thereof. When the latter raises it head, then it is time for gold to rise. Keep in mind I would recommend real gold coins of bullion value common dates compared to bullion. At least then you can claim you are a coin collector. That worked before, at least in the 1930s."https://www.armstrongeconomics.com/markets-by-sector/precious-metals/gold/gold-the-hedge-against-government-2/* * * I agree w/ Armstrong. Confidence... |
|
|
|
|
sidhujag
Legendary
Offline
Activity: 2044
Merit: 1005
|
|
February 20, 2016, 08:00:17 AM
Last edit: February 20, 2016, 08:12:29 AM by sidhujag |
|
There is that blind lunatic sloanf again screaming at the French teacher. Even a dumbass could look at this chart and realize that if population and building costs are rising, then price should be rising. They see price is not rising so thus it must make sense the rise was occurring in the appreciation of the dollar. Duh. QUESTION: Mr. Armstrong, your real estate cycle turned up from 1955. It does not match the Case-Shiller index which peaked in 1890s and bottomed in 1920 and then began to rally after 1940 into the 1955 period. Something seem strange with that index given the huge Florida real estate bubble which burst in 1927. Can you explain why the Case-Shiller seems to be off so much? Here is a chart that has been going around the Web. Thanks ANSWER: This is the typical problem with people creating an index and then trying to extend it back in time. They ALWAYS ignore the currency and project purely a domestic view. During the 1890s, J.P. Morgan had to bail out the U.S. Treasury for it was dead broke. As people feared the government would declare bankruptcy, private assets rose in NOMINAL terms. This was matched by the massive exit of foreign capital from the USA. The Case-Shiller index bottoms in 1920, but this was the point of a massive rise in the dollars value. Foreign capital poured into the USA to park because of World War I. This, in turn, led to wild speculation in Florida, which as you correctly stated, burst in 1927. Because rhis isdex is national, it also suppresses regional booms. As real estate peaked in Florida, the hot money then shifted to stocks creating the Phase Transition into 1929. It was this capital flows between asset classes into stocks where that concentration led to the 1929 bubble. The Case-Shiller index, which suddenly rose from the Great Depression, does not take into account the dollar devaluation that sparked that rise as it did in equities. That was virtually a 60% devaluation of the dollar that moved it from $20 to $35 on a gold standard by FDR. Was that rise real or currency related? Sorry, the real rise begins post-war from 1955. That was the real housing boom. The Case-Shiller does not accurately reflect the changes in currency. One must look at everything in terms of international value before they can see if they really made money or just broke even because the currency declined. From a value perspective, the 1929 high was more than three times that of the 1890s. So the high of the 1890s was purely a rise due to the collapse in the dollar; it was the hallmark of the panic of 1893 and was best expressed in Grover Clevelands speech before Congress. Im pretty sure the rei prices MUST peak here or it invalidates MA again...here they are almost doubled of 2007, thats right doubled... That invalidates his head and shoulders, i know in many spots in states the rei prices have also exceeded 2007.. On the whole im guessing its near or just above the 2007 peak. So if he is right, the dip should happen any week now... Feeels uber bubbly here.. Im talking ppl scrambling to the banks for thr right to flip a property in 3 months for $300k profit bubbly... Even raw lots are priced such that even if you build a home you only breakeven(forcing buyers to foot entire risk of market movement with no premium given to buyer for building a home)... That screams bubble to me. I shouldnt have listened to ma because just 3 months ago i sold my 13 yr old home and waited that many years to make $400ish k profit while in the span of last 3 months prices rose another $300k.. Theres an offer on that home for that.. Same as next door which i also owned. |
|
|
|
|
|
|
|
TPTB_need_war
|
|
February 20, 2016, 02:34:26 PM |
|
Martin warming up a wee bit to gold, it's just one paragraph so I copy 'n' paste it below (blue highlighting mine)
It's the same thing he has always said. He isn't warming. He has been a gold trader since the 1970s. |
|
|
|
|
|
|
m4nki
|
|
February 20, 2016, 08:24:49 PM |
|
Bitcoin Reality QUESTION: Mr. Armstrong : Since you have deep knowledge about coins and currencies going back to ancient times, it would be really helpful to get your view of what Bitcoin is or could be as a sort of World Currency. Is it a fad or something that should be taken seriously? Thank you BH https://www.armstrongeconomics.com/qa/bitcoin-reality/martin armstrong on Bitcoin Nice catch. I would agree with Armstrong that electronic "money" will NOT become any world currency for a long time. There are NO local businesses that I know of (major US city: metro population over 2,000,000) that even take BTC. NO ONE in Peru takes it that I know of. Bitcoin may catch on as a popular payment option, I hope so. But, I would expect that to happen in the USA and Europe first. If BTC cannot become widely used in the developed countries, I doubt that it would be worldwide. TPTB also has raised the issue of Chinese dominance in mining of BTC, a mild negative to BTC IMO. "world currency" is an insanely high bar. why not address the question of whether cryptocurrencies will find a niche and how big that niche could be? obviously bitcoin is not going to be made the sole "world currency." it's a dumb question to begin with. people are buying bitcoin with the idea that it is playing some role in the global economy and will play a larger role in the coming years. larger than 6 or 10 billion dollars worth. there's a lot of space in between 10 billion and the world's total money supply. if there's a 100-bagger, i won't give a flying fuck about the fact that bitcoin didn't become the world currency or that some governments end up banning it. i LOVE this article of Martin Armstrong. This was his chance to back up his previous short interview comments on Bitcoin where he was pointing out that "the government can shut it down anytime they want" without giving further explanation. Now in this blog post, he does not point out any argument that neglects the potential of Bitcoin. What he is basically saying in the end of his post is that after the next crash (financial meltdown), a new system (blockchain based crypto stuff) will start having it's REAL rise. From his blog post: Bitcoin will eventually clash with government for they are hunting money. They will want their piece of the action. That is just how things evolve. After the crash and burn, the system will be completely new. That is when we will have a chance to reshape the world. Good times to come. |
|
|
|
OROBTC (OP)
Legendary
Offline
Activity: 2912
Merit: 1852
|
|
February 23, 2016, 06:35:20 AM |
|
... Armstrong asks the question, then answers it. In short, only a few assets are "safe". SILVER (!), CA$H (somewhat safe, depending) and even stocks are. Many other assets are not, particularly government short-term bonds (which could be changed over to long-term ones by .gov). "Is Any Asset Safe?" https://www.armstrongeconomics.com/qa/is-any-asset-that-is-safe/ |
|
|
|
|
Alex-11
Newbie
Offline
Activity: 133
Merit: 0

|
|
February 24, 2016, 07:10:55 AM |
|
Are we out of the woods here or are we going to retest lows or possibly break support?? Looks weak still, though.
MA says that retesting lows is still possible and even breaking them. Gold has to close first above 1309 and then above 1363 by the end of March before a change in trend is indicated. Support lies at 1170 - 1160. That should not break on a weekly closing basis. MA is in general still rather bearish on Gold - for the next weeks and month ahead. |
|
|
|
|
|
TPTB_need_war
|
|
February 24, 2016, 11:06:36 PM |
|
The Ethereum Paradox, indeed. 1. The value has increased to 450M$. Meanwhile the author of the system has written 0 lines of code in the last month. https://github.com/vbuterin2. The former CEO of the project has presented the potential of smart contracts, mentions ethereum, but doesn't show running code. https://www.youtube.com/watch?v=3bY66Zgr8Cs3. The algorithm will be changed to PoS, yet its entirely unclear how the current currency can survive this. AFAIK, and I'd like to be corrected with tangible evidence, nobody uses the software for anything. All the examples I've seen were theoretical. It is, as far as I can tell a purely speculative vehicle. 3.POS is still in development and the currency will survive it just fine in fact it will probably increase in value, again. We are at the end of an Austrian "Crackup Boom" cycle globally, where excess credit has destroyed all profitable investments. Given the global collapse contagion underway which will accelerate from 2017 to 2020, the exodus from government bonds (and other conservative investments which are no longer viable) has really only one place to go (as Martin Armstrong predicted): stock speculation $450 million mcap is nothing. No where near $450 million has changed hands, rather only $10s of millions at most. So everyone position yourself to partake of the trend. Fundamentals aren't the only factor involved. Speculation follows speculation. Ethereum doesn't have a monopoly on this phenomenon... |
|
|
|
|
|
|
TPTB_need_war
|
|
February 26, 2016, 11:53:17 PM |
|
The Theory of the Firm can be explained from one perspective with the erroneous theory that knowledge
creation can be duplicated and redundant thus managers play an important role of making sure there are backup employees in case one gets sick, leaves, or otherwise fails.
We've needed corporations to aggregate work, because for example you don't build Mozilla Firefox with one programmer. You need a large team.
This is why I was working so hard on solving the Expression Problem for computer programming language (which I think I've solved and will be working on after I finish the crypto work), because with true modularity (no need to refactor), then programmers can work on their own smaller modules and then other programmers can combine modules into large programs. This is the Holy Grail of programming yet to be achieved.
In any case, the point is knowledge creation is becoming more autonomous, e.g. the 3D printer and 3D printer designs for download. You used to need a corporation to accomplish what you can now do individually.
You are quoting me. |
|
|
|
|
TPTB_need_war
|
|
February 26, 2016, 11:54:31 PM
Last edit: February 27, 2016, 12:16:03 AM by TPTB_need_war |
|
Why due to a lack of religious belief in government Mexico, Italy, Brazil, France, Spain, Colombia, S. Africa, and Argentina will be leaders in the Knowledge Age that I predict is developing: 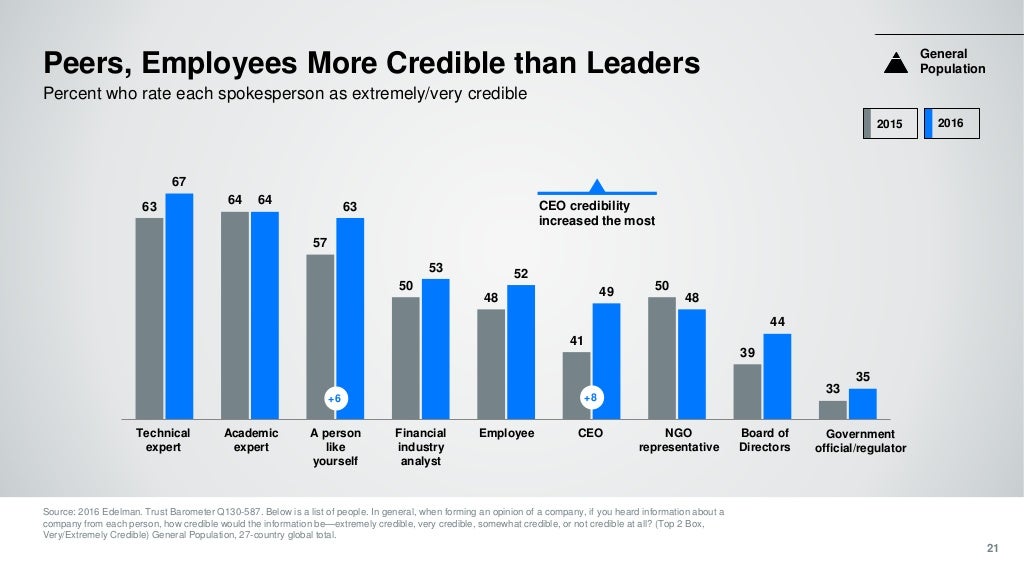 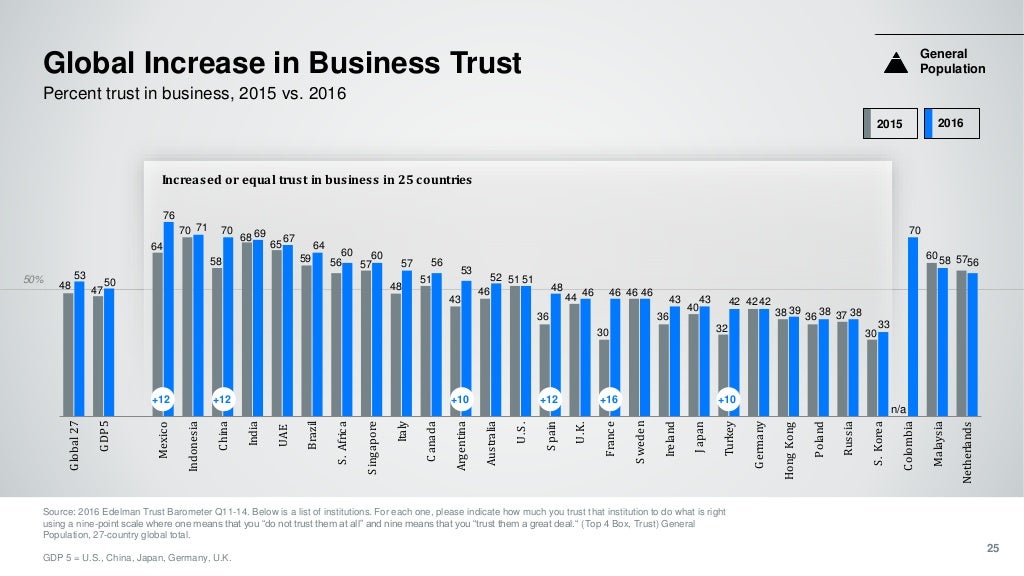 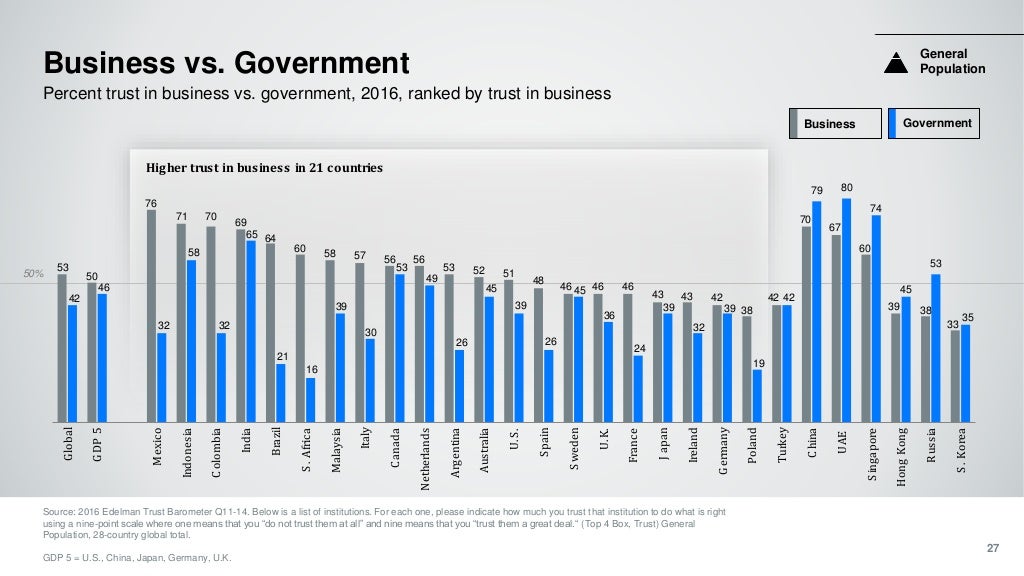 Note that China's trust in business is rising very fast, but China is retarded by its religious belief in the collective. Do not bet big on the future of China, as most of the growth will occur outside of China from here forward. |
|
|
|
|


