|
segeln
|
 |
January 15, 2014, 04:59:12 PM
Last edit: January 16, 2014, 12:07:35 PM by segeln |
|
"The Trend Is Your Friend, Until It Ends" very nice,I saw it first time now. We probably agree in a more practical sense: price would have to fall much much deeper before I begin questioning the overall uptrend that BTC saw since trading began. It's just that I would never call it a "bull market" if price would deflate all the way to, say, 90 USD. So in that sense, it's a semantical distinction: what you call "bull market" I wouldn't apply to such a long time frame, but calling it an "uptrend" I'm fine with. So we both are fine with. Since I am not an english native Speaker you had really challenged me. But tbh, I highly doubt it'll come to that. In fact, I'd be surprised if we ever visit sub-500 for longer than a few hours, maybe a few days, again.
I agree |
|
|
|
|
|
|
|
|
|
|
|
"In a nutshell, the network works like a distributed
timestamp server, stamping the first transaction to spend a coin. It
takes advantage of the nature of information being easy to spread but
hard to stifle." -- Satoshi
|
|
|
Advertised sites are not endorsed by the Bitcoin Forum. They may be unsafe, untrustworthy, or illegal in your jurisdiction.
|
|
Ducky1
|
|
January 15, 2014, 09:05:12 PM |
|
re: double exponentiation. there is not "official" explanation, just like there is not "official" explanation of simple log linear price models. they tend to work as an approximation, although I would alway point out that they're too imprecise to trade on. If you want the actual source of the graph, I already gave you a name, user Ducky1.
I just wanted to say thank you to oda.krell for a splendid explanation of the graphs. Just a point of note: There are two (and only two) hypothesizes in this graph: 1. The price follows an exponential rise on this time scale (and onwards). 2. The price follows an double exponential rise on this time scale (and onwards). The coefficient of determination (R 2) clearly shows that hypothesizes 2 is more likely. http://en.wikipedia.org/wiki/Coefficient_of_determinationFrom end date of this graph and onwards, for every date the price stays closer to the green line than the red line the 2nd hypothesis is strengthened. I plan to revisit this graph at the end of the month to re- evaluate. What seems clear is that we need a substantial and long lasting price fall for the 1st hypothesis to be strengthened. |
|
|
|
oda.krell
Legendary

 Offline Offline
Activity: 1470
Merit: 1007

|
|
January 15, 2014, 11:03:26 PM |
|
re: double exponentiation. there is not "official" explanation, just like there is not "official" explanation of simple log linear price models. they tend to work as an approximation, although I would alway point out that they're too imprecise to trade on. If you want the actual source of the graph, I already gave you a name, user Ducky1.
I just wanted to say thank you to oda.krell for a splendid explanation of the graphs. Just a point of note: There are two (and only two) hypothesizes in this graph:1. The price follows an exponential rise on this time scale (and onwards). 2. The price follows an double exponential rise on this time scale (and onwards). The coefficient of determination (R 2) clearly shows that hypothesizes 2 is more likely. http://en.wikipedia.org/wiki/Coefficient_of_determinationFrom end date of this graph and onwards, for every date the price stays closer to the green line than the red line the 2nd hypothesis is strengthened. I plan to revisit this graph at the end of the month to re- evaluate. What seems clear is that we need a substantial and long lasting price fall for the 1st hypothesis to be strengthened. hehehe, at the risk of annoying you, and everyone else... you have one more assumption, what I called assumption a) in my post: that it is exactly *one* function generating the entire data. Absolutely non-obvious assumption, that one  |
Not sure which Bitcoin wallet you should use? Get Electrum!Electrum is an open-source lightweight client: fast, user friendly, and 100% secure. Download the source or executables for Windows/OSX/Linux/Android from, and only from, the official Electrum homepage.
|
|
|
|
samurai1200
|
|
January 16, 2014, 03:33:17 AM |
|
So anyway, then came (roughly) December 2012/January 2013, and that orange line was broken. So it had to be redrawn.
I think we are a bit hair-splitting now about drawing the proper line. I never drew the orange line and I dont not know wether the professional analysts from the german webside did it.(I doubt it) If a solid trend is going about to be broken you have also to take in account the time -scale. Breaking a solid trendline is not done in a few hours/days, it takes more time. Let me say a last word about the godmodetrader.de chart:in these nervous days/weeks here on bitcointalk.org I am very confident referring to that Chart since I am longterm-involved. I can`t stand these hour-/days-charts as posted here so many times. BTC is too dynamic to get "fenced" in charts like that. Do you agree ? Price has many components. Several components are best modeled as random variables in some distribution(s). If your trade frequency --which is limited by friction created by fees -- is high enough, then you can profit from relatively low S/N ratios, over the long run. This is the basic ideology of successfuly high-frequency trading. A great motivator for this approach is that risk is quite low for very short term trades. The result is slow steady gains. The analytic, technical, and market apparatus required is fairly substantial, however. The more frequently you can trade with a given constant edge, the greater your gains over time. Eliciting an edge of a given magnitude for a short term trade is much more difficult than eliciting an edge of that magnitude for a longer term trade. On a scale of human life, the reward/risk ratio for BTC is astronomical, and epistemic problems, analytic problems, market frictions, are inconsequential. A rational maximizer of expected outcome will attempt to scale their time-frames to their epistemic, analytic, and mechanical resources. Most players will fail to assess their correct scale, due to Dunning-Kruger effect. They will trade too frequently, and probably suffer from other deep mistakes. This was lovely. Thank you. |
|
|
|
|
|
masterluc (OP)
Legendary
Offline
Activity: 938
Merit: 1013
|
|
January 20, 2014, 01:40:31 PM
Last edit: January 20, 2014, 01:53:44 PM by masterluc |
|
Happy new year ) What I see? I see zig-zags, price in positive both daily and weekly BB. What could it mean? It could mean true ending diagonal, which never happened before. And also very fucking risky.   |
|
|
|
hdbuck
Legendary
Offline
Activity: 1260
Merit: 1002
|
|
January 20, 2014, 01:53:35 PM |
|
@masterluc happy new year to you too  so you dont see another important leg down on the price before it continues its surge? |
|
|
|
|
masterluc (OP)
Legendary
Offline
Activity: 938
Merit: 1013
|
|
January 20, 2014, 01:56:45 PM |
|
so you dont see another important leg down on the price before it continues its surge?
The bearish impulse had been destroyed by last lower high. This doesn't cancel bearish scenario, but creates a possibility of additional bullish leg up in form of zig-zag (not impulse). I mentioned this possible move when I was 80% out of bitcoins. |
|
|
|
|
ft73
|
|
January 20, 2014, 02:35:06 PM |
|
so you dont see another important leg down on the price before it continues its surge?
The bearish impulse had been destroyed by last lower high. This doesn't cancel bearish scenario, but creates a possibility of additional bullish leg up in form of zig-zag (not impulse). I mentioned this possible move when I was 80% out of bitcoins. Welcome back, lucif! |
|
|
|
|
|
ampere9765
|
|
January 20, 2014, 10:11:41 PM |
|
i'm having trouble drawing this. where is the top of subwave 1 in this formation? do you have ~ targets for throw-over? thanks. |
|
|
|
|
windjc
Legendary
Offline
Activity: 2156
Merit: 1070
|
|
January 20, 2014, 10:32:46 PM |
|
so you dont see another important leg down on the price before it continues its surge?
The bearish impulse had been destroyed by last lower high. This doesn't cancel bearish scenario, but creates a possibility of additional bullish leg up in form of zig-zag (not impulse). I mentioned this possible move when I was 80% out of bitcoins.
Wow. Are we to assume you are back into bitcoins now? Welcome back, btw. And Happy new year to you too. |
|
|
|
|
Miz4r
Legendary
Offline
Activity: 1246
Merit: 1000
|
|
January 20, 2014, 10:36:02 PM |
|
Happy new year ) What I see? I see zig-zags, price in positive both daily and weekly BB. What could it mean? It could mean true ending diagonal, which never happened before. And also very fucking risky. Interesting, other EW specialists have come out with a similar opinion as yours. Like DanV on tradingview: https://www.tradingview.com/v/mfpi2W6F/ . He's talking about a 'Flat Wave' and a 3-3-5 correction going on with a top around 1150 to 1300+ withing the next couple of weeks from now and then a serious correction down. I'm not really sure I understand and believe all of that, but I thought the resemblance with your EW analysis was interesting and was wondering what your thoughts were on this. |
Bitcoin = Gold on steroids
|
|
|
masterluc (OP)
Legendary
Offline
Activity: 938
Merit: 1013
|
|
January 20, 2014, 10:52:23 PM |
|
Wow. Are we to assume you are back into bitcoins now?
Welcome back, btw. And Happy new year to you too.
I'm 20% still =) Bought few cars =) |
|
|
|
sumantso
Legendary
Offline
Activity: 1050
Merit: 1000
|
|
January 21, 2014, 04:08:45 AM |
|
Wow. Are we to assume you are back into bitcoins now?
Welcome back, btw. And Happy new year to you too.
I'm 20% still =) Bought few cars =) 'few cars'? Are you totaling one each day? So, its still too risky for you to buy in? |
|
|
|
chessnut
Legendary
Offline
Activity: 924
Merit: 1001
|
|
January 21, 2014, 11:30:27 AM |
|
What I see? I see zig-zags, price in positive both daily and weekly BB. What could it mean? It could mean true ending diagonal, which never happened before. And also very fucking risky.
See this forecast: It's the result of long in-depth anal-ysis and fundamental investigation: ^^  A part of me agrees with this chart wholly. very reasonable and well proportioned. |
|
|
|
adamas
Legendary
Offline
Activity: 1014
Merit: 1003
VIS ET LIBERTAS

|
|
January 21, 2014, 01:17:20 PM |
|
A part of me agrees with this chart wholly. very reasonable and well proportioned.
 |
"Es ist kein Zeichen geistiger Gesundheit, gut angepasst an eine kranke Gesellschaft zu sein."
|
|
|
masterluc (OP)
Legendary
Offline
Activity: 938
Merit: 1013
|
|
January 21, 2014, 03:21:18 PM |
|
What I see? I see zig-zags, price in positive both daily and weekly BB. What could it mean? It could mean true ending diagonal, which never happened before. And also very fucking risky.
See this forecast: It's the result of long in-depth anal-ysis and fundamental investigation: ^^ A part of me agrees with this chart wholly. very reasonable and well proportioned. Irving Fisher was perhaps the first celebrity economist, but his reputation during his lifetime was irreparably harmed by his public statements, just prior to the Wall Street Crash of 1929, claiming that the stock market had reached "a permanently high plateau." Stock market crash of 1929 The stock market crash of 1929 and the subsequent Great Depression cost Fisher much of his personal wealth and academic reputation. He famously predicted, three days before the crash, " Stock prices have reached what looks like a permanently high plateau." Irving Fisher stated on October 21 that the market was "only shaking out of the lunatic fringe" and went on to explain why he felt the prices still had not caught up with their real value and should go much higher. On Wednesday, October 23, he announced in a bankers meeting "security values in most instances were not inflated." For months after the Crash, he continued to assure investors that a recovery was just around the corner. Once the Great Depression was in full force, he did warn that the ongoing drastic deflation was the cause of the disastrous cascading insolvencies then plaguing the American economy because deflation increased the real value of debts fixed in dollar terms. Fisher was so discredited by his 1929 pronouncements and by the failure of a firm he had started that few people took notice of his "debt-deflation" analysis of the Depression. People instead eagerly turned to the ideas of Keynes. Fisher's debt-deflation scenario has since seen a revival since the 1980s. |
|
|
|
|
segeln
|
|
January 21, 2014, 03:32:28 PM |
|
See this forecast: It's the result of long in-depth anal-ysis and fundamental investigation: ^^ A part of me agrees with this chart wholly. very reasonable and well proportioned.
it`s a bad drawn graph,not according to TA-Rules This one is by professionals: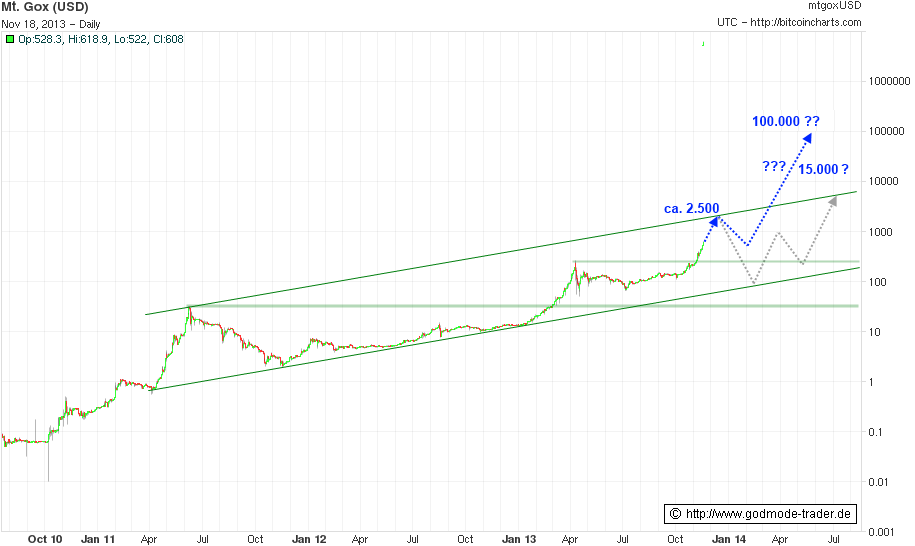 |
|
|
|
|
|
segeln
|
|
January 21, 2014, 04:58:22 PM |
|
|
|
|
|
|
BrightAnarchist
Donator
Legendary
 Offline
Activity: 853
Merit: 1000
|
|
January 23, 2014, 01:34:24 AM |
|
Happy new year ) What I see? I see zig-zags, price in positive both daily and weekly BB. What could it mean? It could mean true ending diagonal, which never happened before. And also very fucking risky. Funny, an ending diagonal is also in formation on the dow transports |
|
|
|
|
|


